|
|
|
Decomposition analysis of energy-related carbon dioxide emissions in the iron and steel industry in China |
Wenqiang SUN( ), Jiuju CAI, Hai YU, Lei DAI ), Jiuju CAI, Hai YU, Lei DAI |
| SEP Key Laboratory of Eco-industry, Institute of Thermal and Environmental Engineering, Northeastern University, Shenyang 110819, China |
|
|
|
|
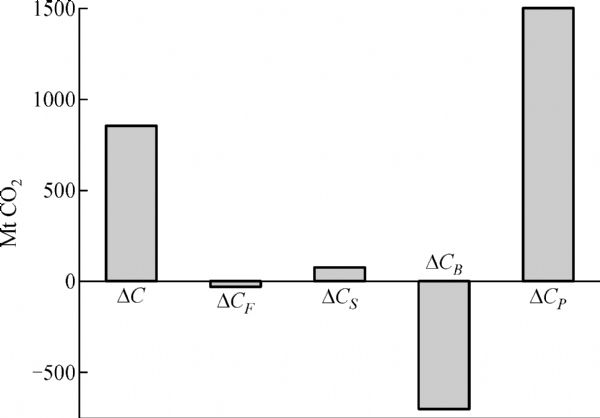
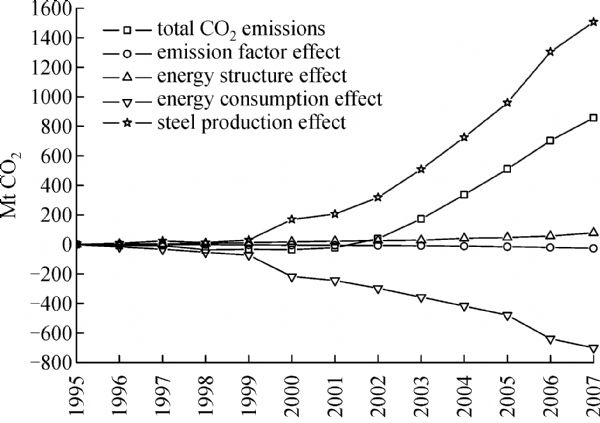
Abstract This work aims to identify the main factors influencing the energy-related carbon dioxide (CO2) emissions from the iron and steel industry in China during the period of 1995–2007. The logarithmic mean divisia index (LMDI) technique was applied with period-wise analysis and time-series analysis. Changes in energy-related CO2 emissions were decomposed into four factors: emission factor effect, energy structure effect, energy consumption effect, and the steel production effect. The results show that steel production is the major factor responsible for the rise in CO2 emissions during the sampling period; on the other hand the energy consumption is the largest contributor to the decrease in CO2 emissions. To a lesser extent, the emission factor and energy structure effects have both negative and positive contributions to CO2 emissions, respectively. Policy implications are provided regarding the reduction of CO2 emissions from the iron and steel industry in China, such as controlling the overgrowth of steel production, improving energy-saving technologies, and introducing low-carbon energy sources into the iron and steel industry.
|
| Keywords
carbon dioxide (CO2) emissions
decomposition analysis
logarithmic mean divisia index (LMDI) technique
time-series analysis
|
|
Corresponding Author(s):
SUN Wenqiang,Email:neu20031542@163.com
|
|
Issue Date: 01 April 2012
|
|
| 1 |
Xu K D. Low Carbon Economy and Steel Industry. In: 2009 CSM Annual Meeting Proceedings . Beijing: Metallurgical Industry Press, 2009 (in Chinese)
|
| 2 |
Zhang C X, Shangguan F Q, Hu C Q, Qi Y H, Yin R Y. Steel process structure and its impact on CO2 emission. Iron and Steel , 2010, 45(5): 1-6 (in Chinese)
|
| 3 |
Hatzigeorgiou E, Polatidis H, Haralambopoulos D. CO2 emissions in Greece for 1990-2002: a decomposition analysis and comparison of results using the Arithmetic Mean Divisia Index and Logarithmic Mean Divisia Index techniques. Energy , 2008, 33(3): 492-499
doi: 10.1016/j.energy.2007.09.014
|
| 4 |
Hoekstra R, Bergh J V D. Comparing structural decomposition analysis and index. Energy Economy , 2003, 25(1): 39-64
doi: 10.1016/S0140-9883(02)00059-2
|
| 5 |
Ang B W. The LMDI approach to decomposition analysis: a practical guide. Energy Policy , 2005, 33(7): 867-871
doi: 10.1016/j.enpol.2003.10.010
|
| 6 |
Kaya Y. Impact of Carbon Dioxide Emission Control on GNP Growth: Interpretation of Proposed Scenarios. Paris: IPCC Energy and Industry Subgroup, Response Strategies Working Group, 1990
|
| 7 |
IPCC. Special Report on Emissions Scenarios. Cambridge: Cambridge University Press, 2001
|
| 8 |
Ang B W, Choi K H. Decomposition of aggregated energy and gas emission intensities for industry: a refined Divisia index method. Energy , 1997, 18(3): 59-73
|
| 9 |
Ang B W, Huang H C, Mu A R. Properties and linkages of some index decomposition analysis methods. Energy Policy , 2009, 37(11): 4624-4632
doi: 10.1016/j.enpol.2009.06.017
|
| 10 |
IPCC. 2006 IPCC Guidelines for National Greenhouse Gas Inventories: Volume 2 Energy. Kanagawa: IGES, 2006
|
| 11 |
National Bureau of Statistics of China. China Statistical Yearbook. Beijing: China Statistics Press, 1995-2007 (in Chinese)
|
| 12 |
National Development and Reform Commission. China Energy Statistical Yearbook. Beijing: China Statistics Press, 1995-2007 (in Chinese)
|
| 13 |
Research Team of China Climate Change Country Study. China Climate Change Country Study. Beijing: Tsinghua University Press, 1999
|
| 14 |
GD Power Development Co., Ltd. China Electric Power Yearbook. Beijing: China Electric Power Press, 1995-2007 (in Chinese)
|
|
Viewed |
|
|
|
Full text
|
|
|
|
|
Abstract
|
|
|
|
|
Cited |
|
|
|
|
| |
Shared |
|
|
|
|
| |
Discussed |
|
|
|
|