|
|
|
Spillover effect of environmental investment: evidence from panel data at provincial level in China |
Qunhui LIN1( ), Guanyi CHEN1, Wencui DU2, Haipeng NIU3 ), Guanyi CHEN1, Wencui DU2, Haipeng NIU3 |
| 1. School of Environmental Science and Engineering, Tianjin University, Tianjin 300072, China; 2. School of Economics & Business Administration, Beijing Normal University, Beijing 100875, China; 3. School of Business, Renmin University of China, Beijing 100872, China |
|
|
|
|
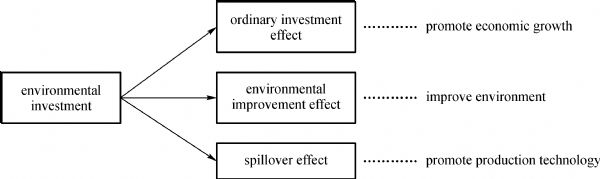
Abstract This paper considers pollution density as a function of environmental investment. The higher environmental investment, the lower pollution density. The lower the pollution density is the higher production technology becomes. This is called the spillover effect. We collected China’s panel data at the provincial level from 2005 to 2009, and tested the spillover effect of environmental investment. This paper finds that the environmental investment influenced production technology positively. There is a significant positive relation between government expenditure and spillover effect.
|
| Keywords
environmental investment
spillover effect
endogenous growth
|
|
Corresponding Author(s):
LIN Qunhui,Email:janetlqh@hotmail.com
|
|
Issue Date: 01 June 2012
|
|
| 1 |
Dasgupta P, Heal G. The optimal depletion of exhaustible resources. The Review of Economic Studies , 1974, 41(2): 3–28
doi: 10.2307/2296369
|
| 2 |
Stiglitz J. Growth with exhaustible natural resources: efficient and optimal growth paths. Review of Economic Studies , 1974, 41(5): 123–137
doi: 10.2307/2296377
|
| 3 |
Romer P M. Increasing returns and long-run growth. Journal of Political Economy , 1986, 94(5): 1002–1037
|
| 4 |
Romer P M. Endogenous technological change. Journal of Political Economy , 1990, 98(5): 71–102
|
| 5 |
Lucas R E. On the mechanics of economic development. Journal of Monetary Economics , 1988, 22(1): 3–42
doi: 10.1016/0304-3932(88)90168-7
|
| 6 |
Bovenberg A L, Smulders S A. Environmental quality and pollution-augmenting technological change in a two-sector endogenous growth model. Journal of Public Economics , 1995, 57(3): 369–391
doi: 10.1016/0047-2727(95)80002-Q
|
| 7 |
Hung V T Y, Chang P, Blackburn K. Endogenous growth, environment and R&D. In: Carraro C, ed. Trade Innovation and Environment . Dordrecht: Kluwer Academic Press, 1994
|
| 8 |
Scholz C M, Ziemes G. Exhaustible resources, monopolistic competition, and endogenous growth. Environmental & Resource Economics, European Association of Environmental and Resource Economists , 1999, 13(2): 169–185
|
| 9 |
Stokey N. Are there limits to growth? International Economic Review , 1998, 39(1): 1–31
|
| 10 |
Aghion P, Howitt P. Endogenous Growth Theory. Cambridge: MIT Press, 1998
|
| 11 |
Barbier E. Endogenous growth and natural resource scarcity. Environmental and Resource Economics , 1999, 14(1): 51–74
doi: 10.1023/A:1008389422019
|
| 12 |
Grimaud A, Rouge L. Non-renewable resources and growth with vertical innovations: optimum, equilibrium and economic policies. Journal of Environmental Economics and Management , 2003, 45(2): 433–453
doi: 10.1016/S0095-0696(02)00049-9
|
| 13 |
Grimaud A, Giuseppe D V. Captal accumulation, interest, and the income-pollution pattern: a simple model. Economic Modelling , 2008, 25(2): 225–235
|
| 14 |
Sun G. Pollution, environmental protection and sustained growth. World Economic Forum , 2004, 47(5): 47–58 (in Chinese)
|
| 15 |
Peng S J, Bao Q. Environmental pollution, endogenous growth and sustainable development. The Journal of Quantitative & Technical Economics , 2006, 23(9): 114–126 (in Chinese)
|
| 16 |
Li S B, Zhao D T. Economy sustainable development endogenous growth model under the restrains of environment pollution. Forecasting , 2008, 27(1): 72–76 (in Chinese)
|
| 17 |
Ministry of Environmental Protection of China. China Environment Statistical Yearbook (2005). Beijing: China Environmental Press, 2006 (in Chinese)
|
| 18 |
Ministry of Environmental Protection of China. China Environment Statistical Yearbook (2006). Beijing: China Environmental Press, 2007 (in Chinese)
|
| 19 |
Ministry of Environmental Protection of China. China Environment Statistical Yearbook (2007). Beijing: China Environmental Press, 2008 (in Chinese)
|
| 20 |
Ministry of Environmental Protection of China. China Environment Statistical Yearbook (2008). Beijing: China Environmental Press, 2009 (in Chinese)
|
| 21 |
Ministry of Environmental Protection of China. China Environment Statistical Yearbook (2009). Beijing: China Environmental Press, 2010 (in Chinese)
|
| 22 |
National Bureau of Statistics of China. China Statistical Yearbook for Regional Economy (2005). Beijing: China Statistics Press, 2006 (in Chinese)
|
| 23 |
National Bureau of Statistics of China. China Statistical Yearbook for Regional Economy (2006). Beijing: China Statistics Press, 2007 (in Chinese)
|
| 24 |
National Bureau of Statistics of China. China Statistical Yearbook for Regional Economy (2007). Beijing: China Statistics Press, 2008 (in Chinese)
|
| 25 |
National Bureau of Statistics of China. China Statistical Yearbook for Regional Economy (2008). Beijing: China Statistics Press, 2009 (in Chinese)
|
| 26 |
National Bureau of Statistics of China. China Statistical Yearbook for Regional Economy (2009). Beijing: China Statistics Press, 2010 (in Chinese)
|
|
Viewed |
|
|
|
Full text
|
|
|
|
|
Abstract
|
|
|
|
|
Cited |
|
|
|
|
| |
Shared |
|
|
|
|
| |
Discussed |
|
|
|
|