|
|
|
Changes in hourly precipitation may explain the sharp reduction of discharge in the middle reach of the Yellow River after 2000 |
Lin LUO, Zhongjing WANG( ) ) |
| State Key Laboratory of Hydroscience and Engineering, Department of Hydraulic Engineering, Tsinghua University, Beijing 100084, China |
|
|
|
|
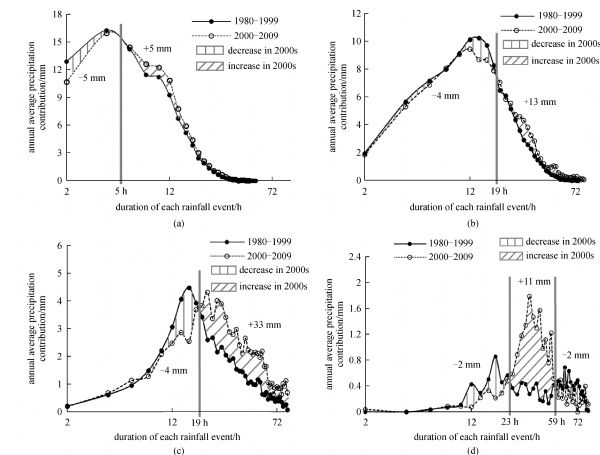
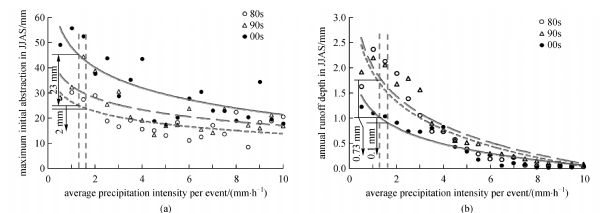
Abstract The Hekou-Longmen reach, together with local floods, is the main source area for coarse sedimentations into the Yellow River. When total rainfall slightly increased in the area, discharge dramatically decreased by 40%–70% after the year of 2000, and attracting extensive attention in the context of global climate change. High temporal resolution precipitation (timescales between 1 and 4 h) data from the June to September period from 270 rain gauges over the past three decades was mined in order to help explain the phenomenon. Each rainfall event was classified as light/moderate rain, large rain, heavy rain or rainstorm by the event’s rainfall amount, and further classified as low intensity rain, medium intensity rain and high intensity rain by the event’s rainfall intensity. The Mann-Kendall trend test was applied to detect the presence and significance of monotonic trends, and to find the change points in the mean and variance of the precipitation characteristics series, including the amount, intensity, frequency and duration of each rainfall category. Results show that although the total amount of precipitation has slightly increased, the average rainfall intensity has significantly decreased. The larger change happened in light/moderate rain events and low/medium intensity rain events, and the intensity changes have a great extent occurred around the threshold of Non-Runoff Rainfall regime, which was proposed for the approximate calculation of initial losses. Changes in rainfall distribution between different classes of the Runoff Rainfall regime in the 2000s could lead to 0.9 mm less runoff depth (17.3% of the total reduction) than the 1980–1999 period. The study indicates that changes in hourly precipitation may be responsible for the sharp reduction of discharge.
|
| Keywords
precipitation intensity
Mann-Kendall rank statistic
spatial and temporal distribution
climatic change
|
|
Corresponding Author(s):
WANG Zhongjing,Email:zj.wang@tsinghua.edu.cn
|
|
Issue Date: 01 October 2013
|
|
| 1 |
Lenderink G, Meijgaard E V. Increase in hourly precipitation extremes beyond expectations from temperature changes. Nature Geoscience , 2008, 1(8): 511–514
doi: 10.1038/ngeo262
|
| 2 |
Allen M R, Ingram W J. Constraints on future changes in climate and the hydrologic cycle. Nature , 2002, 419(6903): 224–232
doi: 10.1038/nature01092 pmid:12226677
|
| 3 |
Trenberth K E, Dai A, Rasmussen R M, Parsons D B. The changing character of precipitation. Bulletin of the American Meteorological Society , 2003, 84(9): 1205–1217
doi: 10.1175/BAMS-84-9-1205
|
| 4 |
Menzel L, Bürger G. Climate change scenarios and runoff response in the Mulde catchment (Southern Elbe, Germany). Journal of Hydrology (Amsterdam) , 2002, 267(1-2): 53–64
doi: 10.1016/S0022-1694(02)00139-7
|
| 5 |
Martin L P. Climate Change and World Agriculture. London: Earthscan Publications Limited, 1990
|
| 6 |
Robert C B, Gregory B G. Spatial analysis of variations in precipitation intensity in the USA. Theoretical and Applied Climatology , 2011, 104(3-4): 415–421
|
| 7 |
Mailhot A, Duchesne S, Caya D, Talbot G. Assessment of future change in intensity-duration-frequency (IDF) curves for southern Quebec using the Canadian Regional Climate Model (CRCM). Journal of Hydrology (Amsterdam) , 2007, 347(1-2): 197–210
doi: 10.1016/j.jhydrol.2007.09.019
|
| 8 |
Karl T R, Knight R W, Plummer N. Trends in high-frequency climate variability in the twentieth century. Nature , 1995, 377(6546): 217–220
doi: 10.1038/377217a0
|
| 9 |
Intergovernmental Panel on Climate Change (IPCC). Climate Change 2007: The Physical Science Basis. Contribution of Working Group I to the Fourth Assessment Report of the Intergovernmental Panel on Climate Change. Cambridge, UK: Cambridge University Press, 2007. Available online at http://ipcc-wg1.ucar.edu/wg1/wg1-report.html (accessed October10, 2012)
|
| 10 |
Trenberth K E. Changes in precipitation with climate change. Climate Research , 2011, 47(1): 123–138
doi: 10.3354/cr00953
|
| 11 |
Kharin V V, Zwiers F W, ZhangX B, Hegerl G C. Changes in temperature and precipitation extremes in the IPCC ensemble of global coupled model simulations. Journal of Climate , 2007, 20(8): 1419–1444
doi: 10.1175/JCLI4066.1
|
| 12 |
Zhang X B, Zwiers F W, Hegerl G C, Lambert F H, Gillett N P, Solomon S, Stott P A, Nozawa T. Detection of human influence on twentieth-century precipitation trends. Nature , 2007, 448(7152): 461–465
doi: 10.1038/nature06025 pmid:17646832
|
| 13 |
Yu R C, Li J, Yuan W H, Chen H. Changes in characteristics of late-summer precipitation over Eastern China in the past 40 years revealed by hourly precipitation data. Journal of Climate , 2010, 23(12): 3390–3396
doi: 10.1175/2010JCLI3454.1
|
| 14 |
Lenderink G, Meijgaard E V. Linking increases in hourly precipitation extremes to atmospheric temperature and moisture changes. Environmental Research Letters , 2010, 5(2):
doi: 10.1088/1748-9326/5/2/025208
|
| 15 |
Mishra V, Wallace J M, Lettenmaier D P. Relationship between hourly extreme precipitation and local air temperature in the United States. Geophysical Research Letters , 2012, 39(16):
doi: 10.1029/2012GL052790
|
| 16 |
Fujibe V, Yamazaki N, Katsuyama V, Kobayashi K. The increasing trend of intense precipitation in Japan based on four hourly data for a hundred years. SOLA (Scientific Online Letters on the Atmosphere) , 2005, (1): 41–44
doi: 10.2151/sola.2005-012
|
| 17 |
Zhai P, Zhang X, Wan H, Pan X. Trends in total precipitation and frequency of daily precipitation extremes over China. Journal of Climate , 2005, 18(7): 1096–1108
doi: 10.1175/JCLI-3318.1
|
| 18 |
Wang Q C, Li L, Liu P, Qin N S, Zhu J W. Climate variational characteristics of rain day and rain intensity for the last 40 years in Qinghai Province. Meteorological Monthly , 2005, 31(03): 69–73 (In Chinese)
|
| 19 |
Cong Z T, Zhao J, Yang D, Ni G. Understanding the hydrological trends of river basins in China. Journal of Hydrology (Amsterdam) , 2010, 388(3-4): 350–356
doi: 10.1016/j.jhydrol.2010.05.013
|
| 20 |
Yang L, Villarini G, Smith J A, Tian F Q, Hu H P. Changes in seasonal maximum daily precipitation in China over the period 1961-2006. International Journal of Climatology ,
doi: 10.1002/joc.3539 pmid:. Available online at http://onlinelibrary.wiley.com/doi/10.1002/joc.3539/abstract (accessed September20, 2012)
|
| 21 |
Liang L Q, Li L J, Liu Q. Precipitation variability in Northeast China from 1961 to 2008. Journal of Hydrology (Amsterdam) , 2011, 404(1-2): 67–76
doi: 10.1016/j.jhydrol.2011.04.020
|
| 22 |
Liang S, Ge S, Wan L, Zhang J. Can climate change cause the Yellow River to dry up? Water Resources Research , 2010, 46(2):
doi: 10.1029/2009WR007971
|
| 23 |
Xu X, Yang D, Sivapalan M. Assessing the impact of climate variability on catchment water balance and vegetation cover. Hydrology and Earth System Sciences , 2012, 16(1): 43–58
doi: 10.5194/hess-16-43-2012
|
| 24 |
Fu B J, Liu Y, Lü Y H, He C S, Zeng Y, Wu B F . Assessing the soil erosion control service of ecosystems change in the Loess Plateau of China. Ecological Complexity , 2011, 8(4): 284-293
|
| 25 |
Jiao J Y, Zhang Z G, Bai W J, Jia Y F, Wang N . Assessing the ecological success of restoration by afforestation on the Chinese Loess Plateau. Restoration Ecology , 2012, 20(2): 240–249
|
| 26 |
Xu L G, Zhou H F, Li Y, Li H, Tang Y. Analysis of the precipitation stability and variety trend in the desert region of northern China. Advances in Water Science , 2008, 19(6): 792–799 (In Chinese)
|
| 27 |
Mann H B. Non-parametric test against trend. Econometrica , 1945, 13(3): 245–259
doi: 10.2307/1907187
|
| 28 |
Kendall M G. Rank Correlation Methods. London, UK: Griffin, 1975
|
| 29 |
Michell J M, Dzerdzeevskii B, Flohn H, Hofmeyr W L, Lamb H H, Rao K H, Wallen C C. Climatic Change, WTO Technical Note No.79. Geneva: World Meteorological Organization, 1966
|
| 30 |
Goossens C, Berger A. Annual and seasonal climatic variations over the northern hemisphere and Europe during the last century. Annales Geophysicae , 1986, 4(4): 385–399
|
| 31 |
Liu B H, Xu M, Henderson M, Qi Y. Observed trends of precipitation amount, frequency, and intensity in China, 1960-2000. Journal of Geophysical Research , 2005, 110(D8): D08103
doi: 10.1029/2004JD004864
|
| 32 |
Yu R, Zhou T. Seasonality and three-dimensional structure of interdecadal change in the East Asian monsoon. Journal of Climate , 2007, 20(21): 5344–5355
doi: 10.1175/2007JCLI1559.1
|
| 33 |
Barnett T P, Adam J C, Lettenmaier D P. Potential impacts of a warming climate on water availability in snow-dominated regions. Nature , 2005, 438(7066): 303–309
doi: 10.1038/nature04141 pmid:16292301
|
| 34 |
Knapp A K, Smith M D. Variation among biomes in temporal dynamics of aboveground primary production. Science , 2001, 291(5503): 481–484
doi: 10.1126/science.291.5503.481 pmid:11161201
|
|
Viewed |
|
|
|
Full text
|
|
|
|
|
Abstract
|
|
|
|
|
Cited |
|
|
|
|
| |
Shared |
|
|
|
|
| |
Discussed |
|
|
|
|