|
|
|
Application of k-means clustering to environmental risk zoning of the chemical industrial area |
Weifang SHI, Weihua ZENG( ) ) |
| State Key Joint Laboratory of Environmental Simulation and Pollution Control, School of Environment, Beijing Normal University, Beijing 100875, China |
|
|
|
|
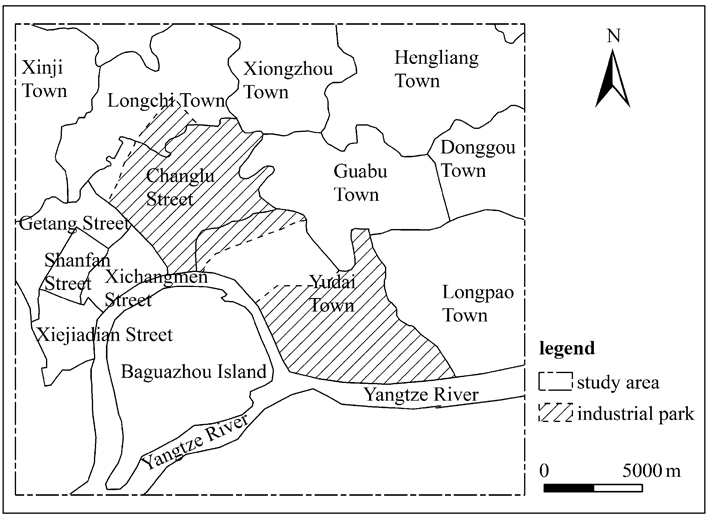
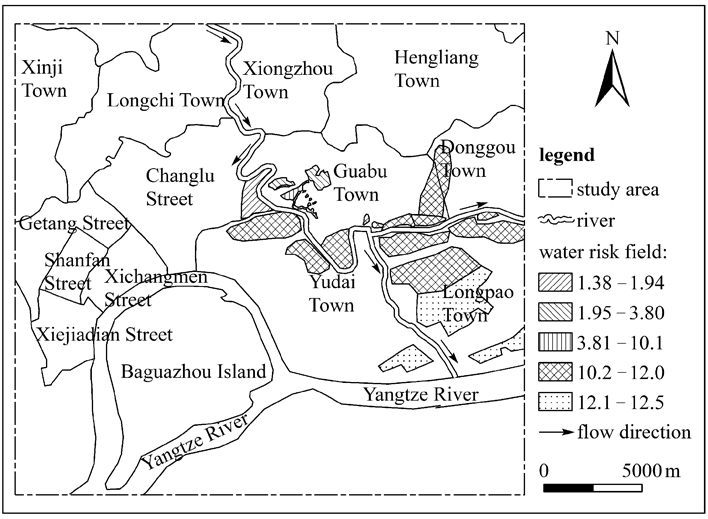
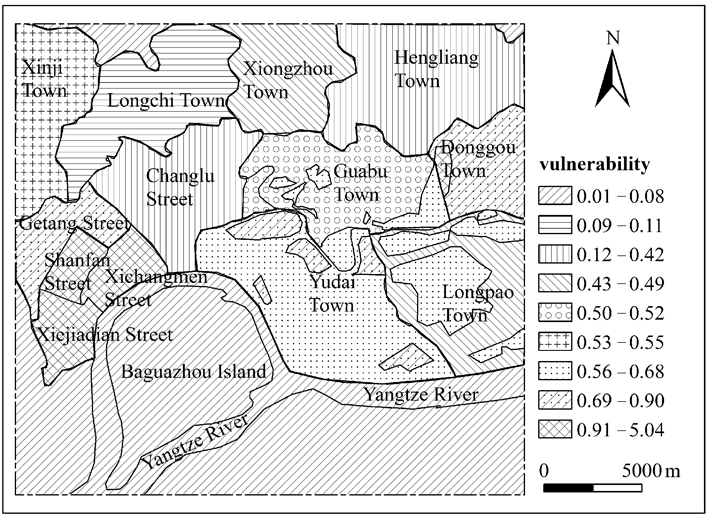
Abstract The homogeneous risk characteristics within a sub-area and the heterogeneous from one sub-area to another are unclear using existing environmental risk zoning methods. This study presents a new zoning method by determining and categorizing the risk characteristics using the k-means clustering data mining technology. The study constructs indices and develops index quantification models for environmental risk zoning by analyzing the mechanism of environmental risk occurrence. We calculate the source risk index, air risk field index, water risk field index, and target vulnerability of the study area with Nanjing Chemical Industrial Park using a 100 m × 100 m mesh grid as the basic zoning unit, and then use k-means clustering to analyze the environmental risk in the area. We obtain the optimal clustering number with the largest average silhouette coefficient by calculating the average silhouette coefficients of clustering at different k-values. The clustering result with the optimal clustering number is then used for the environmental risk zoning, and the zoning result is mapped using the geographic information system. The study area is divided into five sub-areas. The common environmental risk characteristics within the same sub-area, as well as the differences between sub-areas, are presented. The zoning is helpful in risk management and is convenient for decision makers to distribute limited resources to different sub-areas in the design of risk reducing intervention.
|
| Keywords
environmental risk zoning
k-means clustering
silhouette coefficient
chemical industrial park
risk management
|
|
Corresponding Author(s):
ZENG Weihua,Email:zengwh@bnu.edu.cn
|
|
Issue Date: 01 February 2014
|
|
| 1 |
Fadlelmawla A A, Fayad M, El-Gamily H, Rashid T, Mukhopadhyay A, Kotwicki V. A land surface zoning approach based on three-component risk criteria for groundwater quality protection. Water Resources Management , 2011, 25(6): 1677–1697
|
| 2 |
de Oliveira P T S, Sobrinho T A, Rodrigues D B B, Panachuki E. Erosion risk mapping applied to environmental zoning. Water Resources Management , 2011, 25(3): 1021–1036
|
| 3 |
Fell R, Corominas J, Bonnard C, Cascini L, Leroi E, Savage W Z. Guidelines for landslide susceptibility, hazard and risk zoning for land-use planning. Engineering Geology , 2008, 102(3–4): 99–111
|
| 4 |
Gupta A K, Suresh I V, Misra J, Yunus M. Environmental risk mapping approach: risk minimization tool for development of industrial growth centres in developing countries. Journal of Cleaner Production , 2002, 10(3): 271–281
|
| 5 |
Merad M M, Verdel T, Roy B, Kouniali S. Use of multi-criteria decision-aids for risk zoning and management of large area subjected to mining-induced hazards. Tunnelling and Underground Space Technology , 2004, 19(2): 125–138
|
| 6 |
Calvo F, Moreno B, Ramos á, Zamorano M. Implementation of a new environmental impact assessment for municipal waste landfills as tool for planning and decision-making process. Renewable & Sustainable Energy Reviews , 2007, 11(1): 98–115
|
| 7 |
Dagnino A, Sforzini S, Dondero F, Fenoglio S, Bona E, Jensen J, Viarengo A A. A “weight of evidence” approach for the integration of environmental “triad” data to assess ecological risk and biological vulnerability. Integrated Environmental Assessment and Management , 2008, 4(3): 314–326
pmid:18393577
|
| 8 |
Lan D D, Liu R Z, Zeng W H. Technique to regional risk zonation of environmental pollution accident and its application. Journal of Basic Science and Engineering , 2009, 17(Suppl): 82–91 (in Chinese)
|
| 9 |
Tingsanchali T, Karim F. Flood-hazard assessment and risk-based zoning of a tropical flood plain: case study of the Yom River, Thailand. Hydrological Sciences Journal–Journal Des Sciences Hydrologiques , 2010, 55(2): 145–161
|
| 10 |
Yang J, Bi J, Li Q L, Zhang B. Study on theory and methodology of regional environmental risk zoning. Research of Environmental Sciences , 2006, 19(4): 132–137 (in Chinese)
|
| 11 |
Xu L Y, Liu G Y. The study of a method of regional environmental risk assessment. Journal of Environmental Management , 2009, 90(11): 3290–3296
pmid:19525058
|
| 12 |
Zeng W H, Cheng S T. Introduction to environmental catastrophology. Beijing: China Environmental Science Press, 2000 (in Chinese)
|
| 13 |
Zeng W H, Cheng S T. Risk forecasting and evaluating model of environmental pollution accident. Journal of Environmental Sciences (China) , 2005, 17(2): 263–267
pmid:16295902
|
| 14 |
Crichton D. The risk triangle. In: Ingleton J, ed. Natural Disaster Management. London: Tudor Rose, 1999, 102–103
|
| 15 |
Crichton D. UK and global insurance responses to flood hazard. Water International , 2002, 27(1): 119–131
|
| 16 |
Lugeri N, Kundzewicz Z W, Genovese E, Hochrainer S, Radziejewski M. River flood risk and adaptation in Europe-assessment of the present status. Mitigation and Adaptation Strategies for Global Change , 2010, 15(7): 621–639
|
| 17 |
Hu E B. Environmental Risk Assessment Practical Technology, Method and Cases. Beijing: China Environmental Science Press, 2009 (in Chinese)
|
| 18 |
Liverman D M. Vulnerability to global environmental change. In: Kasperson J X, Kasperson R E, eds. Global Environmental Risk . Tokyo: United Nations University Press, 2001, 201–216
|
| 19 |
Schneider S, Sarukhan J. Overview of impacts, adaptation, and vulnerability to climate change. In: McCarthy J J, Canziani O F, Leary N A, Dokken D J, White K S, eds. Climate Change 2001: Impacts, Adaptation, and Vulnerability . Cambridge: Cambridge University Press, 2001, 75–103
|
| 20 |
Peichl M, Leava N A, Kiely G. Above- and belowground ecosystem biomass, carbon and nitrogen allocation in recently afforested grassland and adjacent intensively managed grassland. Plant and Soil , 2012, 350(1–2): 281–296
|
| 21 |
Mu M, Wang B. Nonlinear instability and sensitivity of a theoretical grassland ecosystem to finite-amplitude perturbations. Nonlinear Processes in Geophysics , 2007, 14(4): 409–423
|
| 22 |
Tan P N, Steinbach M, Kumar V. Introduction to Data Mining. Boston: Pearson Addison Wesley, 2006
|
| 23 |
Everitt B S, Landau S, Leese M, Stahl D. Cluster Analysis. 5th ed. Chichester: John Wiley, 2011
|
| 24 |
Kaufman L, Rousseeuw P J. Finding Groups in Data: an Introduction to Cluster Analysis. New Jersey: John Wiley, 2005
|
|
Viewed |
|
|
|
Full text
|
|
|
|
|
Abstract
|
|
|
|
|
Cited |
|
|
|
|
| |
Shared |
|
|
|
|
| |
Discussed |
|
|
|
|