Please wait a minute...
Frontiers of Environmental Science & Engineering

ISSN 2095-2201

ISSN 2095-221X(Online)

CN 10-1013/X

Postal Subscription Code 80-973

2018 Impact Factor: 3.883

Front. Environ. Sci. Eng.    2015, Vol. 9 Issue (2) : 334-351    https://doi.org/10.1007/s11783-014-0626-4
RESEARCH ARTICLE
Optimization of thermophilic anaerobic-aerobic treatment system for Palm Oil Mill Effluent (POME)
Yijing CHAN(),Meifong CHONG,Chunglim LAW
Department of Chemical and Environmental Engineering, The University of Nottingham Malaysia Campus, Selangor 43500, Malaysia
 Download: PDF(2005 KB)   HTML
 Export: BibTeX | EndNote | Reference Manager | ProCite | RefWorks
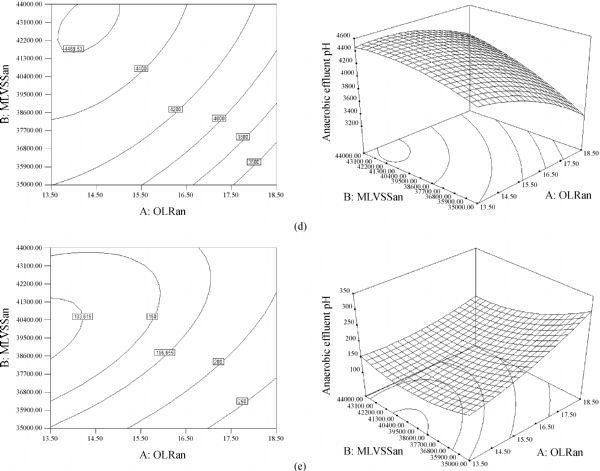
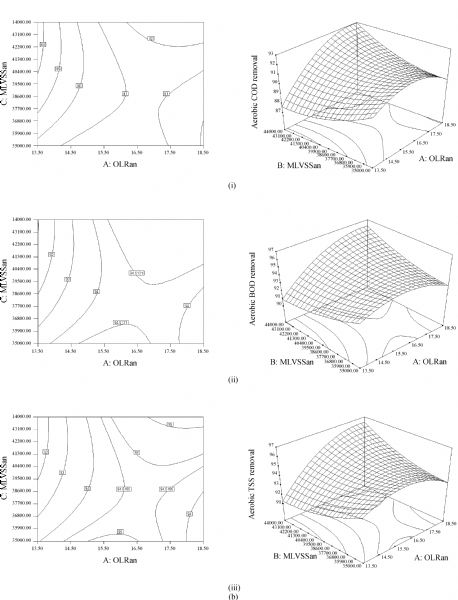
Abstract

Optimization of an integrated anaerobic-aerobic bioreactor (IAAB) treatment system for the reduction of organic matter (Chemical Oxygen Demand (COD), Biochemical Oxygen Demand (BOD) and Total Suspended Solids (TSS) concentrations) in Palm Oil Mill Effluent (POME) to legal standards with high methane yield was performed for the first time under thermophilic condition (50°C–55°C) by using response surface methodology (RSM). The experiments were conducted based on a central composite rotatable design (CCRD) with three independent operating variables, organic loading rates in anaerobic compartment (OLRan) and mixed liquor volatile suspended solids (MLVSS) concentration in anaerobic (MLVSSan) and aerobic compartments (MLVSSa). The optimum conditions for the POME treatment were determined as OLRan of 15.6 g COD·L-1·d-1, MLVSSan of 43100 mg·L-1, and MLVSSa of 18600 mg·L-1, where high aerobic COD, BOD and TSS removal efficiencies of 96.3%, 97.9%, and 98.5% were achieved with treated BOD of 56 mg·L-1 and TSS of 28 mg·L-1 meeting the discharge standard. This optimization study successfully achieved a reduction of 42% in the BOD concentrations of the final treated effluent at a 48% higher OLRan as compared to the previous works. Besides, thermophilic IAAB system scores better feasibility and higher effectiveness as compared to the optimized mesophilic system. This is due to its higher ability to handle high OLR with higher overall treatment efficiencies (more than 99.6%), methane yield (0.31 L CH4·g-1 CODremoved) and purity of methane (67.5%). Hence, these advantages ascertain the applicability of thermophilic IAAB in the POME treatment or even in other high-strength wastewaters treatment.

Keywords palm oil mill effluent (POME)      anaerobic      aerobic      thermophilic      biogas      optimization     
Corresponding Author(s): Yijing CHAN   
Online First Date: 07 January 2014    Issue Date: 13 February 2015
 Cite this article:   
Yijing CHAN,Meifong CHONG,Chunglim LAW. Optimization of thermophilic anaerobic-aerobic treatment system for Palm Oil Mill Effluent (POME)[J]. Front. Environ. Sci. Eng., 2015, 9(2): 334-351.
 URL:  
https://academic.hep.com.cn/fese/EN/10.1007/s11783-014-0626-4
https://academic.hep.com.cn/fese/EN/Y2015/V9/I2/334
parameter average range
pH 4.5±0.10 4.18–4.7
BOD/(mg·L-1) 30100±10391 19100–46700
COD/(mg·L-1) 70000±7612 65900–85300
total suspended solids (TSS) /(mg·L-1) 28900±3065 24200–34300
total nitrogen (TN) /(mg·L-1) 780±50 700–920
total phosphorus (TP) /(mg·L-1) 608±81 690–910
volatile fatty acids (VFA) /(mg·L-1) 470±240 300–870
oil and grease/(mg·L-1) 10540 8700–13800
Tab.1  Characteristics of POME
run variable response
AOLRan/(g COD·L-1·d-1) BMLVSSan/(mg·L-1) CMLVSSa/(mg·L-1) anaerobic COD removal/% anaerobic BOD removal/% anaerobic TSS removal/% methanecontent/% methane yield/(L CH4·g-1 CODrem·d-1) effluent pH effluent VFA/(mg·L-1) effluent TA/(mg·L-1) aerobic COD/% aerobic BOD/% aerobic TSS/% final treated effluent COD/(mg·L-1) final treated effluent BOD/(mg·L-1) final treated effluent TSS/(mg·L-1)
1 (2)21.0 (0)39500 (0)19000 81.1 82.1 84.1 58.5 0.12 6.60 310 3000 87.0 90.5 90.6 1695.1 438.1 435.0
2 (0)16.0 (0)39500 (0)19000 94.0 95.0 97.1 66.0 0.29 7.43 160 4289 91.0 94.4 94.6 372.5 72.1 45.6
3 (-2)11.0 (0)39500 (0)19000 94.5 95.5 97.8 68.0 0.33 7.47 145 4350 83.0 86.5 87.0 662.8 160.8 85.5
4 (-1)13.5 (1)44000 (1)22000 95.2 96.4 98.2 68.4 0.33 7.50 135 4510 85.0 88.5 89.0 489.6 105.1 56.8
5 (0)16.0 (0)39500 (0)19000 94.0 95.0 97.1 66.0 0.29 7.43 160 4289 91.0 94.4 94.6 372.1 72.0 45.5
6 (0)16.0 (0)39500 (2)25000 94.0 95.0 97.0 66.0 0.29 7.43 160 4289 86.5 90.0 90.2 555.3 128.0 85.0
7 (-1)13.5 (-1)35000 (-1)16000 92.5 93.5 95.5 65.5 0.29 7.33 175 4110 89.5 93.0 93.2 539.8 116.5 88.5
8 (0)16.0 (0)39500 (-2)13000 94.0 95.0 97.1 66.0 0.29 7.43 160 4289 86.0 89.5 89.7 595.5 139.0 89.3
9 (1)18.5 (-1)35000 (-1)16000 82.0 83.0 85.0 59.0 0.15 6.75 320 3310 87.5 91.0 91.2 1550.3 393.7 383.7
10 (-1)13.5 (1)44000 (-1)16000 95.2 96.4 98.2 68.4 0.33 7.50 135 4515 87.0 90.5 90.6 423.1 86.6 48.4
11 (1)18.5 (-1)35000 (1)22000 82.0 83.0 85.0 59.0 0.15 6.75 320 3310 90.0 93.5 93.7 1240.2 284.3 274.7
12 (1)18.5 (1)44000 (-1)16000 92.2 93.2 95.2 64.0 0.25 7.18 183 4223 91.5 95.0 95.2 449.5 86.1 65.9
13 (0)16.0 (0)39500 (0)19000 94.0 95.0 97.1 66.0 0.29 7.43 160 4289 91.0 94.4 94.6 372.1 72.0 45.5
14 (0)16.0 (-2)30500 (0)19000 82.0 83.0 85.0 59.0 0.15 6.80 320 3455 94.0 96.5 97.0 729.0 150.0 128.2
15 (1)18.5 (1)44000 (1)22000 92.2 93.2 95.2 64.0 0.25 7.18 183 4223 92.0 95.5 95.7 449.3 82.3 62.7
16 (0)16.0 (0)39500 (0)19000 94.0 95.0 97.1 66.0 0.29 7.43 160 4289 91.0 94.4 94.6 370.2 71.7 45.3
17 (0)16.0 (2)48500 (0)19000 89.0 90.0 92.0 64.1 0.23 7.20 250 4226 94.5 97.0 97.4 414.7 76.8 60.2
18 (-1)13.5 (-1)35000 (-1)22000 92.5 93.5 95.5 65.5 0.29 7.33 175 4110 88.0 91.5 91.7 625.5 143.4 109.5
19 (0)16.0 (0)39500 (0)19000 94.0 95.0 97.1 66.0 0.29 7.43 160 4289 91.0 94.4 94.6 372.6 72.2 45.6
20 (0)16.0 (0)39500 (0)19000 94.0 95.0 97.1 66.0 0.29 7.43 160 4289 91.0 94.4 94.6 372.6 72.2 45.6
Tab.2  Experimental conditions and results of CCD for the study of three variables in coded and actual units
process parameter average range
1) anaerobic temperature/°C 55.0±0.6 54.5–55.7
Van/L 23.0 23.0
OLRan/(g COD·L-1·d-1) 11.0–21.0
HRTan/d 3.3–6.4
Qin/(L·d-1) 3.5–7.0
MLVSSan/(mg·L-1) 30500–48500
pH 6.6–7.47
R 15 15
Qr/(L·d-1) 53.2–104.3
SRTan/d 43.1–660.3
food to microorganism ratio (F/M) /(g COD·g-1 MLVSS·d-1) 0.31–0.53
2) aerobic temperature/°C 50±0.5 49.5–50.8
Va/L 24.0 24.0
OLRa 0.58–3.78
HRTa/d 3.5–6.8
MLVSSa/(mg·L-1) 13000–25000
MLVSSRAS/(mg·L-1) 28340–58750
pH 8.50–8.98
DO/(mg·L-1) 2.8±1.2 2.60–2.95
QRAS/(L·d-1) 2.8–5.6
QWAS/(L·d-1) 0.5 0.5
SRTa/d 18.0–22.1
F/M 0.03–0.20
Tab.3  General operating conditions of IAAB
No. factor designed value in design of experiment (DOE) average measured value during experiment standard deviation
1 OLRan 11.0 11.0 ± 0.01
13.5 13.5 ± 0.05
16.0 16.0 ± 0.02
18.5 18.5 ± 0.03
21.0 21.0 ± 0.01
2 MLVSSan 30500 30480 ± 43
35000 35054 ± 66
39500 39531 ± 51
44000 44090 ± 78
48500 48553 ± 55
3 MLVSSa 13000 13000 ± 20
16000 16036 ± 49
19000 19100 ± 38
22000 22101 ± 75
25000 24067 ± 52
Tab.4  Standard deviation of operating conditions applied in this study
No. response modified equations in terms of coded values with significant terms model probability(Prob>F) modelF-value R2 adj. R2 pred. R2 adeq. precision SD CV/% PRESS
1 anaerobic COD removal 94.04–3.36A + 2.49B + 1.88AB–1.54A2 -2.11B2 <0.0001 147.1 0.9813 0.9747 0.8907 32.23 0.79 0.87 51.5
2 anaerobic BOD removal 95.06–3.39A + 2.51B + 1.83AB–1.54A2–2.11B2 <0.0001 137.1 0.9800 0.9728 0.8832 31.24 0.82 0.89 55.5
3 anaerobic TSS removal 97.11–3.40A + 2.49B + 1.88AB–1.53A2–2.14B2 <0.0001 150.2 0.9817 0.9752 0.8927 32.87 0.79 0.63 51.25
4 methane content 66.01–2.55A + 1.62B + 0.53AB–0.69A2–1.11B2 <0.0001 214.1 0.9871 0.9825 0.9242 44.49 0.42 0.63 14.39
5 methane yield 0.29–0.053A + 0.027B + 0.015AB–0.016A2–0.025B2 <0.0001 192.2 0.9853 0.9801 0.9187 42.40 0.000 3.53 0.000
6 effluent pH 7.42–0.22A + 0.12B + 0.065AB–0.10A2–0.11B2 <0.0001 284.4 0.9902 0.9868 0.9485 50.44 0.033 0.46 0.081
7 effluent VFA 158.61+ 44.75A–30.88B–24.25AB + 16.53A2 + 30.90B2 <0.0001 71.17 0.9621 0.9486 0.7801 25.34 15.04 7.65 18401
8 effluent TA 4293.43–304.94A + 260.81B + 127.63AB–152.39A2–111.02B2 <0.0001 106.6 0.9744 0.9653 0.8503 31.37 81.15 1.99 5.39E5
9 aerobic COD removal 90.94+ 1.22A + 0.094B + 0.031C + 1.44AB + 0.81AC–0.31BC–1.53A2 + 0.78B2–1.22C2 <0.0001 115.80 0.9905 0.9819 0.9240 41.61 0.40 0.45 13.03
10 aerobic BOD removal 94.39+ 1.22A + 0.094B + 0.031C + 1.44AB + 0.81AC–0.31BC–1.48A2 + 0.58B2–1.17C2 <0.0001 138.28 0.9920 0.9849 0.9359 44.23 0.35 0.37 9.72
11 aerobic TSS removal 94.58+ 1.16A + 0.094B + 0.056C + 1.41AB + 0.76AC–0.26BC–1.46A2 + 0.64B2–1.17C2 <0.0001 102.04 0.9892 0.9795 0.9142 38.28 0.40 0.43 12.91
12 final treated effluent COD 483.24+ 229.74A–173.30B–204.87AB + 186.67A2 <0.0001 28.43 0.8835 0.8524 0.7552 20.50 151.5 23.94 7.22E5
13 final treated effluent BOD 98.93+ 59.33A–45.26B–55.19AB + 52.77A2 <0.0001 25.28 0.8708 0.8364 0.7237 19.43 43.26 30.65 60029
14 final treated effluent TSS 71.88+ 73.92A–47.41B–54.62AB + 50.56A2 <0.0001 25.85 0.8733 0.8395 0.6970 19.43 45.79 40.77 75222
Tab.5  ANOVA results for the studied responses
Fig.1  Contour and response surface plots of the (a) COD, (b) BOD, and (c) TSS removal efficiencies (%) in the anaerobic compartment as the function of OLRan (g COD·L-1·d-1) and MLVSSan concentration (mg·L-1) at the MLVSSa concentration of 19000 mg·L-1
Fig.2  Contour and response surface plots of (a) methane content (%) (b) methane yield (L CH4 (STP)·g-1 CODremoved) (c) effluent pH (d) effluent TA, (mg·L-1) and (e) effluent VFA (mg·L-1) of the anaerobic compartment as the function of OLRan (g COD·L-1·d-1) and MLVSSan concentration (mg·L-1) at the MLVSSa concentration of 19000 mg·L-1
Fig.3  Contour and response surface plots of (i) COD, (ii) BOD, and (iii) TSS removal efficiencies (%) in the aerobic compartment as the function of OLRan (g COD·L-1·d-1) and MLVSSa concentration (mg·L-1) at the (a) MLVSSan of 39500 mg·L-1(b) and MLVSSa concentration of 19000 mgL-1
Fig.4  Contour and response surface plots of the effluent (a) COD, (b) BOD, and (c) TSS concentrations in the aerobic compartment as the function of OLRan (g COD·L-1·d-1) and MLVSSan concentration (mg·L-1) at the MLVSSa concentration of 19000 mg·L-1
variables/responses goals constraints unit importance
A:OLRan is in range 13.50–18.5 g COD·L-1·d-1 3
B:MLVSSan is in range 35000–44000 mg·L-1 3
C:MLVSSa is in range 16000–22000 mg·L-1 3
anaerobic COD removal maximize >90 % 3
anaerobic BOD removal maximize >90 % 3
anaerobic TSS removal maximize >90 % 3
aerobic COD removal maximize >95 % 3
aerobic BOD removal maximize >95 % 3
aerobic TSS removal maximize >95 % 3
anaerobic effluent pH maximize >7.0 3
anaerobic effluent TA maximize >2500 mg·L-1 3
methane content maximize >60 % 3
methane yield maximize >0.24 L CH4 (STP)·g-1 CODremoved 3
final treated effluent BOD minimize <100 mg·L-1 3
Tab.6  The optimization criteria for chosen responses
response experimental values in the current study(50°C–55°C) model response with CI 95% standard deviation error/% experimental valuesat 28°C[3]
anaerobic COD removal/% 95.0 94.9 0.79 0.07 84.9
anaerobic BOD removal/% 96.4 96.0 0.82 0.39 86.0
anaerobic TSS removal/% 98.3 98.0 0.79 0.32 90.0
methane content/% 67.5 66.9 0.42 0.89 63.0
methane yield/(L CH4·g-1 CODremoved) 0.310 0.304 0.01 1.92 0.240
anaerobic effluent pH 7.53 7.47 0.03 0.76 7.35
anaerobic effluent VFA/(mg·L-1) 154 150 15.04 2.59 101
anaerobic effluent TA/(mg·L-1) 4450 4458 81.15 -0.17 3900
aerobic COD removal/% 91.0 91.1 0.40 -0.22 96.0
aerobic BOD removal/% 94.6 94.5 0.35 0.13 98.9
aerobic TSS removal/% 94.8 94.7 0.40 0.11 98.3
final treated effluent COD/(mg·L-1) 312 340 151.46 -8.14 417
final treated effluent BOD/(mg·L-1) 56 62 43.26 -9.57 37
final treated effluent TSS/(mg·L-1) 28 31 45.79 -9.66 52
Tab.7  Verification of experiment at optimum condition
1 LaPara T M, Alleman J E. Thermophilic aerobic biological wastewater treatment. Water Research, 1999, 33(4): 895–908
https://doi.org/10.1016/S0043-1354(98)00282-6
2 Ahn J H, Forster C F. Kinetic analyses of the operation of mesophilic and thermophilic anaerobic filters treating a simulated starch wastewater. Process Biochemistry, 2000, 36(1–2): 19–23
https://doi.org/10.1016/S0032-9592(00)00166-7
3 Yeoh B G, Roslan M Y, Quah S K. Optimising methane yield in anaerobic POME treatment through temperature and process manipulations. Journal of Information Technology, 1991, 1: 19–31
4 Kim M, Ahn Y H, Speece R E. Comparative process stability and efficiency of anaerobic digestion; mesophilic vs. thermophilic. Water Research, 2002, 36(17): 4369–4385
https://doi.org/10.1016/S0043-1354(02)00147-1 pmid: 12420941
5 Barr T A, Taylor J M, Duff S J B. Effect of HRT, SRT and temperature on the performance of activated sludge reactors treating bleached kraft mill effluent. Water Research, 1996, 30(4): 799–810
https://doi.org/10.1016/0043-1354(95)00218-9
6 van Lier J B, Groeneveld N, Lettinga G. Development of thermophilic methanogenic sludge in compartmentalized upflow reactors. Biotechnology and Bioengineering, 1996, 50(2): 115–124
https://doi.org/10.1002/(SICI)1097-0290(19960420)50:2<115::AID-BIT1>3.0.CO;2-P pmid: 18626928
7 Chan Y J. A complete Palm Oil Mill Effluent (POME) treatment system using a novel integrated anaerobic-aerobic bioreactor (IAAB). Dissertation for the Doctoral Degree. Selangor, Malaysia: University of Nottingham, 2011
8 Beg Q K, Sahai V, Gupta R. Statistical media optimization and alkaline protease production from Bacillus mojavensis in a bioreactor. Process Biochemistry, 2003, 39(2): 203–209
https://doi.org/10.1016/S0032-9592(03)00064-5
9 Zinatizadeh A A L, Mohamed A R, Mashitah M D, Abdullah A Z, Isa M H. Optimization of pre-treated palm oil mill effluent digestion in an up-flow anaerobic sludge fixed film bioreactor: a comparative study. Biochemical Engineering Journal, 2007, 35(2): 226–237
https://doi.org/10.1016/j.bej.2007.01.018
10 Zinatizadeh A A L, Mohamed A R, Abdullah A Z, Mashitah M D, Hasnain Isa M, Najafpour G D. Process modeling and analysis of palm oil mill effluent treatment in an up-flow anaerobic sludge fixed film bioreactor using response surface methodology (RSM). Water Research, 2006, 40(17): 3193–3208
https://doi.org/10.1016/j.watres.2006.07.005 pmid: 16949124
11 Bhatia S, Othman Z, Ahmad A L. Coagulation–flocculation process for POME treatment using Moringa oleifera seeds extract: optimization studies. Chemical Engineering Journal, 2007, 133(1–3): 205–212
https://doi.org/10.1016/j.cej.2007.01.034
12 Chan Y J, Chong M F, Law C L. An integrated anaerobic-aerobic bioreactor (IAAB) for the treatment of palm oil mill effluent (POME): start-up and steady state performance. Process Biochemistry, 2012, 47(3): 485–495
https://doi.org/10.1016/j.procbio.2011.12.005
13 Chan Y J, Chong M F, Law C L. Effects of temperature on aerobic treatment of anaerobically digested palm oil mill effluent (POME). Industrial & Engineering Chemistry Research, 2010, 49(15): 7093–7101
https://doi.org/10.1021/ie901952m
14 Chan Y J, Chong M F, Law C L. Biological treatment of anaerobically digested palm oil mill effluent (POME) using a Lab-Scale Sequencing Batch Reactor (SBR). Journal of Environmental Management, 2010, 91(8): 1738–1746
https://doi.org/10.1016/j.jenvman.2010.03.021 pmid: 20430515
15 Box G E P, Hunter J S. Multi-factor experimental design for exploring response surfaces. Annals of Mathematical Statistics, 1957, 28(1): 195–241
https://doi.org/10.1214/aoms/1177707047
16 Jenkins D, Richard M G, Daigger G T. Manual on the Causes and Control of Activated Sludge Bulking, Foaming, and Other Solids Separation Problems. 3rd ed. London, UK: IWA Publishing, 2004
17 Kumar A, Yadav A K, Sreekrishnan T R, Satya S, Kaushik C P. Treatment of low strength industrial cluster wastewater by anaerobic hybrid reactor. Bioresource Technology, 2008, 99(8): 3123–3129
18 Shen C F, Guiot S R. Long-term impact of dissolved O2 on the activity of anaerobic granules. Biotechnology and Bioengineering, 1996, 49(6): 611–620
https://doi.org/10.1002/(SICI)1097-0290(19960320)49:6<611::AID-BIT2>3.3.CO;2-Z pmid: 18626856
19 Bashir M J K, Aziz H A, Yusoff M S, Adlan M N. Application of response surface methodology (RSM) for optimization of ammoniacal nitrogen removal from semi-aerobic landfill leachate using ion exchange resin. Desalination, 2010, 254(1–3): 154–161
https://doi.org/10.1016/j.desal.2009.12.002
20 Mosey F E, Fernandes X A. Patterns of hydrogen in biogas from the anaerobic-digestion of milk-sugars. Water Science and Technology, 1989, 21: 187–196
21 Fannin K F. Start-up, operation, stability and control. In: Chynoweth D P, Isaacson R, eds. Anaerobic Digestion of Biomass. London: Elsevier, 1987
[1] Yi Qian, Weichuan Qiao, Yunhao Zhang. Toxic effect of sodium perfluorononyloxy-benzenesulfonate on Pseudomonas stutzeri in aerobic denitrification, cell structure and gene expression[J]. Front. Environ. Sci. Eng., 2021, 15(5): 100-.
[2] Qinxue Wen, Shuo Yang, Zhiqiang Chen. Mesophilic and thermophilic anaerobic digestion of swine manure with sulfamethoxazole and norfloxacin: Dynamics of microbial communities and evolution of resistance genes[J]. Front. Environ. Sci. Eng., 2021, 15(5): 94-.
[3] Ruijie Li, Mengmeng Zhou, Shilong He, Tingting Pan, Jing Liu, Jiabao Zhu. Deciphering the effect of sodium dodecylbenzene sulfonate on up-flow anaerobic sludge blanket treatment of synthetic sulfate-containing wastewater[J]. Front. Environ. Sci. Eng., 2021, 15(5): 91-.
[4] Ying Xu, Hui Gong, Xiaohu Dai. High-solid anaerobic digestion of sewage sludge: achievements and perspectives[J]. Front. Environ. Sci. Eng., 2021, 15(4): 71-.
[5] Yuxin Li, Jiayin Ling, Pengcheng Chen, Jinliang Chen, Ruizhi Dai, Jinsong Liao, Jiejing Yu, Yanbin Xu. Pseudomonas mendocina LYX: A novel aerobic bacterium with advantage of removing nitrate high effectively by assimilation and dissimilation simultaneously[J]. Front. Environ. Sci. Eng., 2021, 15(4): 57-.
[6] Jing Ding, Wanyi Seow, Jizhong Zhou, Raymond Jianxiong Zeng, Jun Gu, Yan Zhou. Effects of Fe(II) on anammox community activity and physiologic response[J]. Front. Environ. Sci. Eng., 2021, 15(1): 7-.
[7] Mona Akbar, Muhammad Farooq Saleem Khan, Ling Qian, Hui Wang. Degradation of polyacrylamide (PAM) and methane production by mesophilic and thermophilic anaerobic digestion: Effect of temperature and concentration[J]. Front. Environ. Sci. Eng., 2020, 14(6): 98-.
[8] Quan Yuan, Hui Gong, Hao Xi, Kaijun Wang. Aerobic granular sludge formation based on substrate availability: Effects of flow pattern and fermentation pretreatment[J]. Front. Environ. Sci. Eng., 2020, 14(3): 49-.
[9] Yilei Lu, Yunqing Huang, Siyu Zeng, Can Wang. Scenario-based assessment and multi-objective optimization of urban development plan with carrying capacity of water system[J]. Front. Environ. Sci. Eng., 2020, 14(2): 21-.
[10] Zuotao Zhang, Chongyang Wang, Jianzhong He, Hui Wang. Anaerobic phenanthrene biodegradation with four kinds of electron acceptors enriched from the same mixed inoculum and exploration of metabolic pathways[J]. Front. Environ. Sci. Eng., 2019, 13(5): 80-.
[11] Zunaira Asif, Zhi Chen. An integrated optimization and simulation approach for air pollution control under uncertainty in open-pit metal mine[J]. Front. Environ. Sci. Eng., 2019, 13(5): 74-.
[12] Chao Pang, Chunhua He, Zhenhu Hu, Shoujun Yuan, Wei Wang. Aggravation of membrane fouling and methane leakage by a three-phase separator in an external anaerobic ceramic membrane bioreactor[J]. Front. Environ. Sci. Eng., 2019, 13(4): 50-.
[13] Jie Liao, Chaoxiang Liu, Lin Liu, Jie Li, Hongyong Fan, Jiaqi Ye, Zhichao Zeng. Influence of hydraulic retention time on behavior of antibiotics and antibiotic resistance genes in aerobic granular reactor treating biogas slurry[J]. Front. Environ. Sci. Eng., 2019, 13(3): 31-.
[14] Mengli Wang, Ruying Li, Qing Zhao. Distribution and removal of antibiotic resistance genes during anaerobic sludge digestion with alkaline, thermal hydrolysis and ultrasonic pretreatments[J]. Front. Environ. Sci. Eng., 2019, 13(3): 43-.
[15] Qinqin Liu, Miao Li, Rui Liu, Quan Zhang, Di Wu, Danni Zhu, Xuhui Shen, Chuanping Feng, Fawang Zhang, Xiang Liu. Removal of trimethoprim and sulfamethoxazole in artificial composite soil treatment systems and diversity of microbial communities[J]. Front. Environ. Sci. Eng., 2019, 13(2): 28-.
Viewed
Full text


Abstract

Cited

  Shared   
  Discussed