|
|
|
Chemical characteristics of fine particulate matter emitted from commercial cooking |
Bing PEI1,2,Hongyang CUI3,Huan LIU4,*( ),Naiqiang YAN1,*() ),Naiqiang YAN1,*() |
1. School of Environmental Science and Engineering, Shanghai Jiao Tong University, Shanghai 200040, China
2. Shanghai Environmental Monitoring Center, Shanghai 200030, China
3. Ministry of Education Key Laboratory for Earth System Modeling, Center for Earth System Science, Tsinghua University, Beijing 100084, China
4. School of Environment, State Key Joint Laboratory of Environment Simulation and Pollution Control (SKLESPC), Tsinghua University, Beijing 100084, China |
|
|
|
|
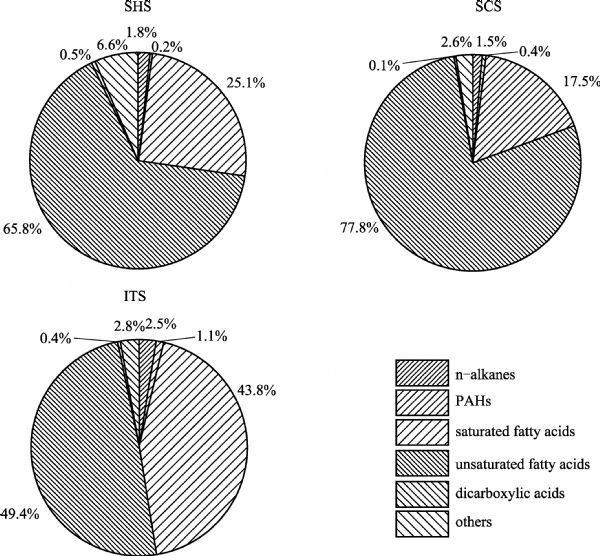
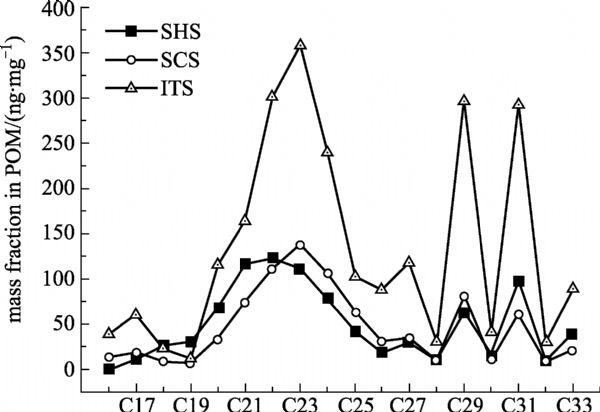
Abstract The chemical characteristics of fine particulate matter (PM2.5) emitted from commercial cooking were explored in this study. Three typical commercial restaurants in Shanghai, i.e., a Shanghai-style one (SHS), a Sichuan-style one (SCS) and an Italian-style one (ITS), were selected to conduct PM2.5 sampling. Particulate organic matter (POM) was found to be the predominant contributor to cooking-related PM2.5 mass in all the tested restaurants, with a proportion of 69.1% to 77.1%. Specifically, 80 trace organic compounds were identified and quantified by gas chromatography/mass spectrometry (GC/MS), which accounted for 3.8%–6.5% of the total PM2.5 mass. Among the quantified organic compounds, unsaturated fatty acids had the highest concentration, followed by saturated fatty acids. Comparatively, the impacts of other kinds of organic compounds were much smaller. Oleic acid was the most abundant single species in both SCS and ITS. However, in the case of SHS, linoleic acid was the richest one. ITS produced a much larger mass fraction of most organic species in POM than the two Chinese cooking styles except for monosaccharide anhydrides and sterols. The results of this study could be utilized to explore the contribution of cooking emissions to PM2.5 pollution and to develop the emission inventory of PM2.5 from cooking, which could then help the policy-makers design efficient treatment measures and control strategies on cooking emissions in the future.
|
| Keywords
commercial cooking
PM2.5
chemical characteristics
organic matter
|
|
Corresponding Author(s):
Huan LIU,Naiqiang YAN
|
|
Online First Date: 25 January 2016
Issue Date: 05 April 2016
|
|
| 1 |
Lin L, He X C, Wu J P, Yu P G, Guo T T. Research of Shanghai cooking fume pollution. Environmental Science & Technology, 2014, 37(120): 546–549 (In Chinese)
|
| 2 |
Schauer J J, Rogge W F, Hildemann L M, Mazurek M A, Cass G R, Simoneit B R. Source apportionment of airborne particulate matter using organic compounds as tracers. Atmospheric Environment, 1996, 30(22): 3837–3855
https://doi.org/10.1016/1352-2310(96)00085-4
|
| 3 |
Zheng M, Cass G R, Schauer J J, Edgerton E S. Source apportionment of PM2.5 in the Southeastern United States using solvent-extractable organic compounds as tracers. Environmental Science & Technology, 2002, 36(11): 2361–2371
https://doi.org/10.1021/es011275x
pmid: 12075791
|
| 4 |
Robinson A L, Subramanian R, Donahue N M, Bernardo-Bricker A, Rogge W F. Source apportionment of molecular markers and organic aerosol. 3. Food cooking emissions. Environmental Science & Technology, 2006, 40(24): 7820–7827
https://doi.org/10.1021/es060781p
pmid: 17256533
|
| 5 |
Abdullahi K L, Delgado-Saborit J M, Harrison R M. Emissions and indoor concentrations of particulate matter and its specific chemical components from cooking: A review. Atmospheric Environment, 2013, 71: 260–294
https://doi.org/10.1016/j.atmosenv.2013.01.061
|
| 6 |
Abbey D E, Ostro B E, Petersen F, Burchette R J. Chronic respiratory symptoms associated with estimated long-term ambient concentrations of fine particulates less than 2.5 microns in aerodynamic diameter (PM2.5) and other air pollutants. Journal of Exposure Analysis and Environmental Epidemiology, 1995, 5(2): 137–159
pmid: 7492903
|
| 7 |
Romieu I, Meneses F, Ruiz S, Sienra J J, Huerta J, White M C, Etzel R A. Effects of air pollution on the respiratory health of asthmatic children living in Mexico City. American Journal of Respiratory and Critical Care Medicine, 1996, 154(2): 300–307
https://doi.org/10.1164/ajrccm.154.2.8756798
pmid: 8756798
|
| 8 |
Lighty J S, Veranth J M, Sarofim A F. Combustion aerosols: factors governing their size and composition and implications to human health. Journal of the Air & Waste Management Association, 2000, 50(9): 1565–1622
https://doi.org/10.1080/10473289.2000.10464197
pmid: 11055157
|
| 9 |
Song Y, Zhang Y H, Xie S D, Zeng L M, Zheng M, Salmon L G, Shao M, Slanina S. Source apportionment of PM2.5 in Beijing by positive matrix factorization. Atmospheric Environment, 2006, 40(8): 1526–1537
https://doi.org/10.1016/j.atmosenv.2005.10.039
|
| 10 |
Shu J, Dearing J A, Morse A P, Yu L, Yuan N. Determining the sources of atmospheric particles in Shanghai, China, from magnetic and geochemical properties. Atmospheric Environment, 2001, 35(15): 2615–2625
https://doi.org/10.1016/S1352-2310(00)00454-4
|
| 11 |
Zhang Y, Wang X, Chen H, Yang X, Chen J, Allen J O. Source apportionment of lead-containing aerosol particles in Shanghai using single particle mass spectrometry. Chemosphere, 2009, 74(4): 501–507
https://doi.org/10.1016/j.chemosphere.2008.10.004
pmid: 19027137
|
| 12 |
Schauer J J, Kleeman M J, Cass G R, Simoneit B R. Measurement of emissions from air pollution sources. 4. C1–C27 organic compounds from cooking with seed oils. Environmental Science & Technology, 2002, 36(4): 567–575
https://doi.org/10.1021/es002053m
pmid: 11883419
|
| 13 |
Rogge W F, Hildemann L M, Mazurek M A, Cass G R, Simoneit B R. Sources of fine organic aerosol. 1. Charbroilers and meat cooking operations. Environmental Science & Technology, 1991, 25(6): 1112–1125
https://doi.org/10.1021/es00018a015
|
| 14 |
Schauer J J, Kleeman M J, Cass G R, Simoneit B R. Measurement of emissions from air pollution sources. 1. C1 through C29 organic compounds from meat charbroiling. Environmental Science & Technology, 1999, 33(10): 1566–1577
https://doi.org/10.1021/es980076j
|
| 15 |
McDonald J D, Zielinska B, Fujita E M, Sagebiel J C, Chow J C, Watson J G. Emissions from charbroiling and grilling of chicken and beef. Journal of the Air & Waste Management Association, 2003, 53(2): 185–194
https://doi.org/10.1080/10473289.2003.10466141
pmid: 12617292
|
| 16 |
See S W, Balasubramanian R. Chemical characteristics of fine particles emitted from different gas cooking methods. Atmospheric Environment, 2008, 42(39): 8852–8862
https://doi.org/10.1016/j.atmosenv.2008.09.011
|
| 17 |
He L Y, Hu M, Huang X F, Yu B D, Zhang Y H, Liu D Q. Measurement of emissions of fine particulate organic matter from Chinese cooking. Atmospheric Environment, 2004, 38(38): 6557–6564
https://doi.org/10.1016/j.atmosenv.2004.08.034
|
| 18 |
Zhao Y, Hu M, Slanina S, Zhang Y. Chemical compositions of fine particulate organic matter emitted from Chinese cooking. Environmental Science & Technology, 2007, 41(1): 99–105
https://doi.org/10.1021/es0614518
pmid: 17265933
|
| 19 |
Zhao Y, Hu M, Slanina S, Zhang Y. The molecular distribution of fine particulate organic matter emitted from Western-style fast food cooking. Atmospheric Environment, 2007, 41(37): 8163–8171
https://doi.org/10.1016/j.atmosenv.2007.06.029
|
| 20 |
China National Environmental Monitoring Centre. Guidelines for Monitoring Methods of Ambient Air Particulate Matter Source Apportionment.Beijing: China National Environmental Monitoring Centre, 2014 (in Chinese).
|
| 21 |
Chow J C, Watson J G, Chen L W A, Chang M C, Robinson N F, Trimble D, Kohl S. The IMPROVE_A temperature protocol for thermal/optical carbon analysis: maintaining consistency with a long-term database. Journal of the Air & Waste Management Association, 2007, 57(9): 1014–1023
https://doi.org/10.3155/1047-3289.57.9.1014
pmid: 17912920
|
| 22 |
Gu Z, Feng J, Han W, Wu M, Fu J, Sheng G. Characteristics of organic matter in PM2.5 from an e-waste dismantling area in Taizhou, China. Chemosphere, 2010, 80(7): 800–806
https://doi.org/10.1016/j.chemosphere.2010.04.078
pmid: 20510434
|
| 23 |
Mattson F H, Lutton E S. The specific distribution of fatty acids in the glycerides of animal and vegetable fats. The Journal of Biological Chemistry, 1958, 233(4): 868–871
pmid: 13587507
|
| 24 |
Simoneit B R, Mazurek M A. Organic matter of the troposphere—II. Natural background of biogenic lipid matter in aerosols over the rural western United States. Atmospheric Environment, 1982, 16(9): 2139–2159
https://doi.org/10.1016/0004-6981(82)90284-0
|
| 25 |
Simoneit B R. Biomass burning—A review of organic tracers for smoke from incomplete combustion. Applied Geochemistry, 200217(3): 129–162
https://doi.org/10.1016/S0883-2927(01)00061-0
|
| 26 |
van Drooge B L, Ballesta P P. Seasonal and daily source apportionment of polycyclic aromatic hydrocarbon concentrations in PM10 in a semirural European area. Environmental Science & Technology, 2009, 43(19): 7310–7316
https://doi.org/10.1021/es901381a
pmid: 19848139
|
| 27 |
Gao B, Guo H, Wang X M, Zhao X Y, Ling Z H, Zhang Z, Liu T Y. Polycyclic aromatic hydrocarbons in PM2.5 in Guangzhou, southern China: spatiotemporal patterns and emission sources. Journal of Hazardous Materials, 2012, 239–240: 78–87
https://doi.org/10.1016/j.jhazmat.2012.07.068
pmid: 23021315
|
|
Viewed |
|
|
|
Full text
|
|
|
|
|
Abstract
|
|
|
|
|
Cited |
|
|
|
|
| |
Shared |
|
|
|
|
| |
Discussed |
|
|
|
|