|
|
|
Development and case study of a new-generation model-VAT for analyzing the boundary conditions influence on atmospheric mercury simulation |
Wenwei Yang1, Yun Zhu1,2( ), Carey Jang3, Shicheng Long4, Che-Jen Lin5, Bin Yu6, Zachariah Adelman7, Shuxiao Wang2, Jia Xing2, Long Wang1,2, Jiabin Li1 ), Carey Jang3, Shicheng Long4, Che-Jen Lin5, Bin Yu6, Zachariah Adelman7, Shuxiao Wang2, Jia Xing2, Long Wang1,2, Jiabin Li1 |
1. Guangdong Provincial Key Laboratory of Atmospheric Environment and Pollution Control, College of Environment and Energy, South China University of Technology, Guangzhou Higher Education Mega Center, Guangzhou 510006, China
2. State Key Joint Laboratory of Environment Simulation and Pollution Control, School of Environment, Tsinghua University, Beijing 100084, China
3. USEPA/Office of Air Quality Planning & Standards, RTP, NC 27711, USA
4. Guangzhou Urban Environmental Cloud Information Technology R&D Co. Ltd, Guangzhou 510006, China
5. Department of Civil Engineering, Lamar University, Beaumont, TX 77710-0024, USA
6. Guangzhou Environmental Monitoring Center Station, Guangzhou 510030, China
7. Institute for the Environment, The University of North Carolina at Chapel Hill, Chapel Hill, NC 27517, USA |
|
|
|
|
Abstract Performance of CMAQ-Hg is better using Model-driven BCs than default BC. Model-VAT provides a better user experience to convert Model-driven BCs. Model-VAT is designed to efficiently access and analyze the results of multi-models.
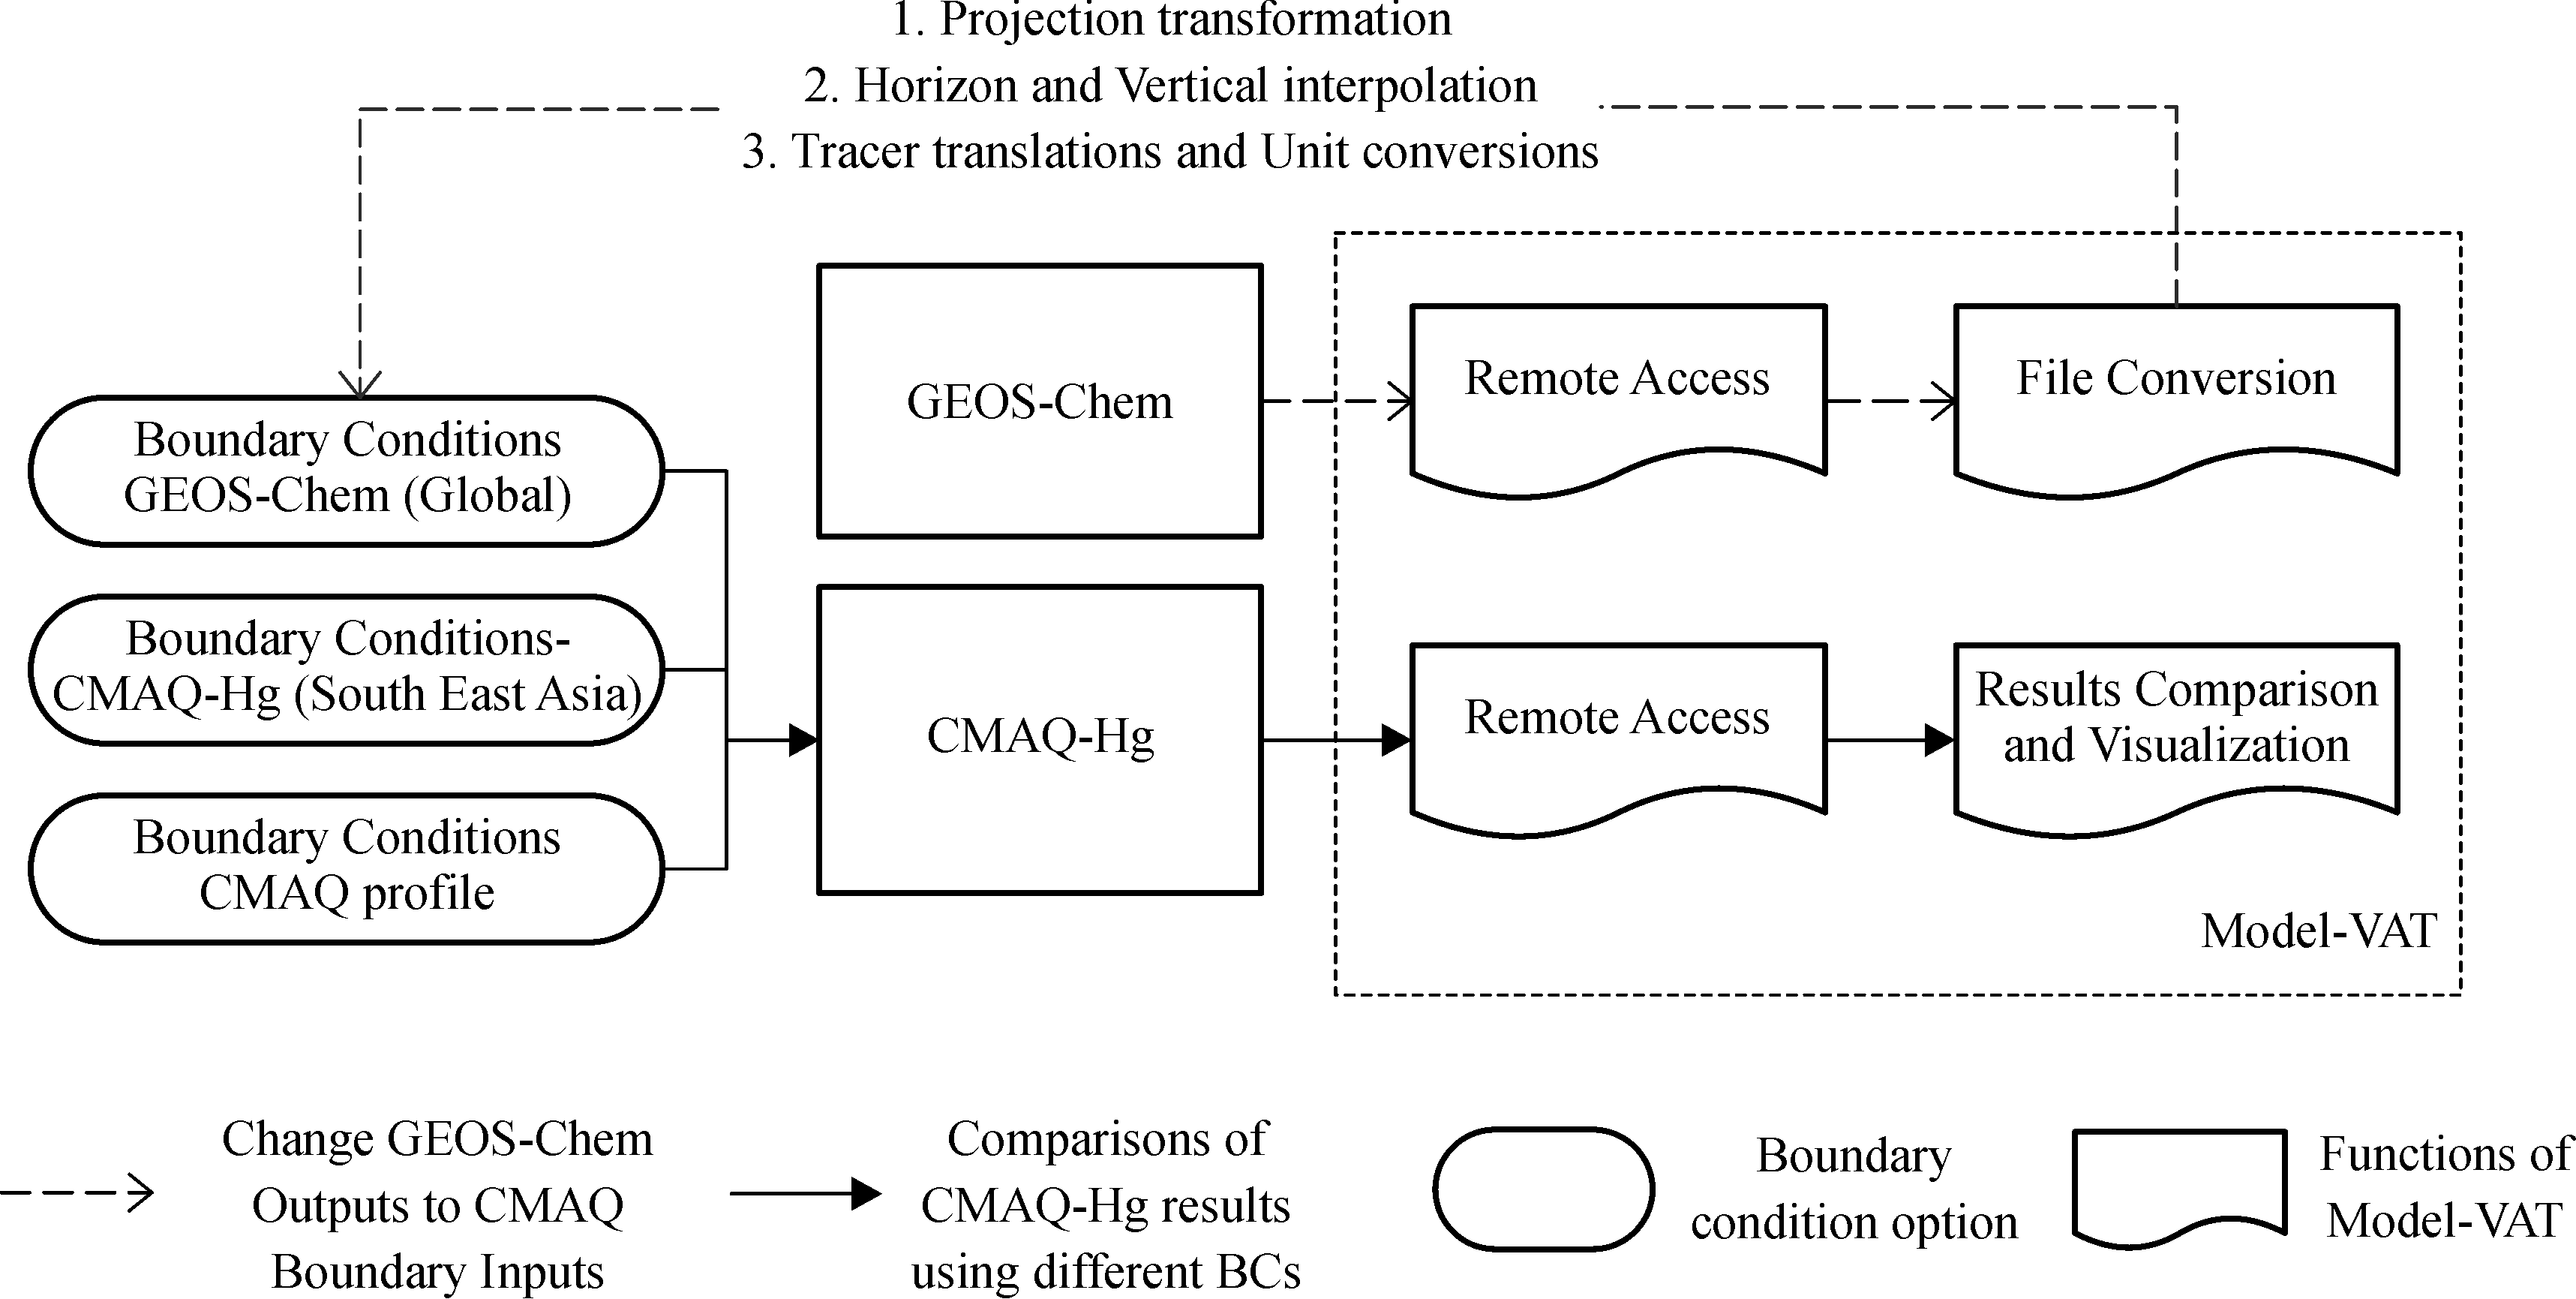
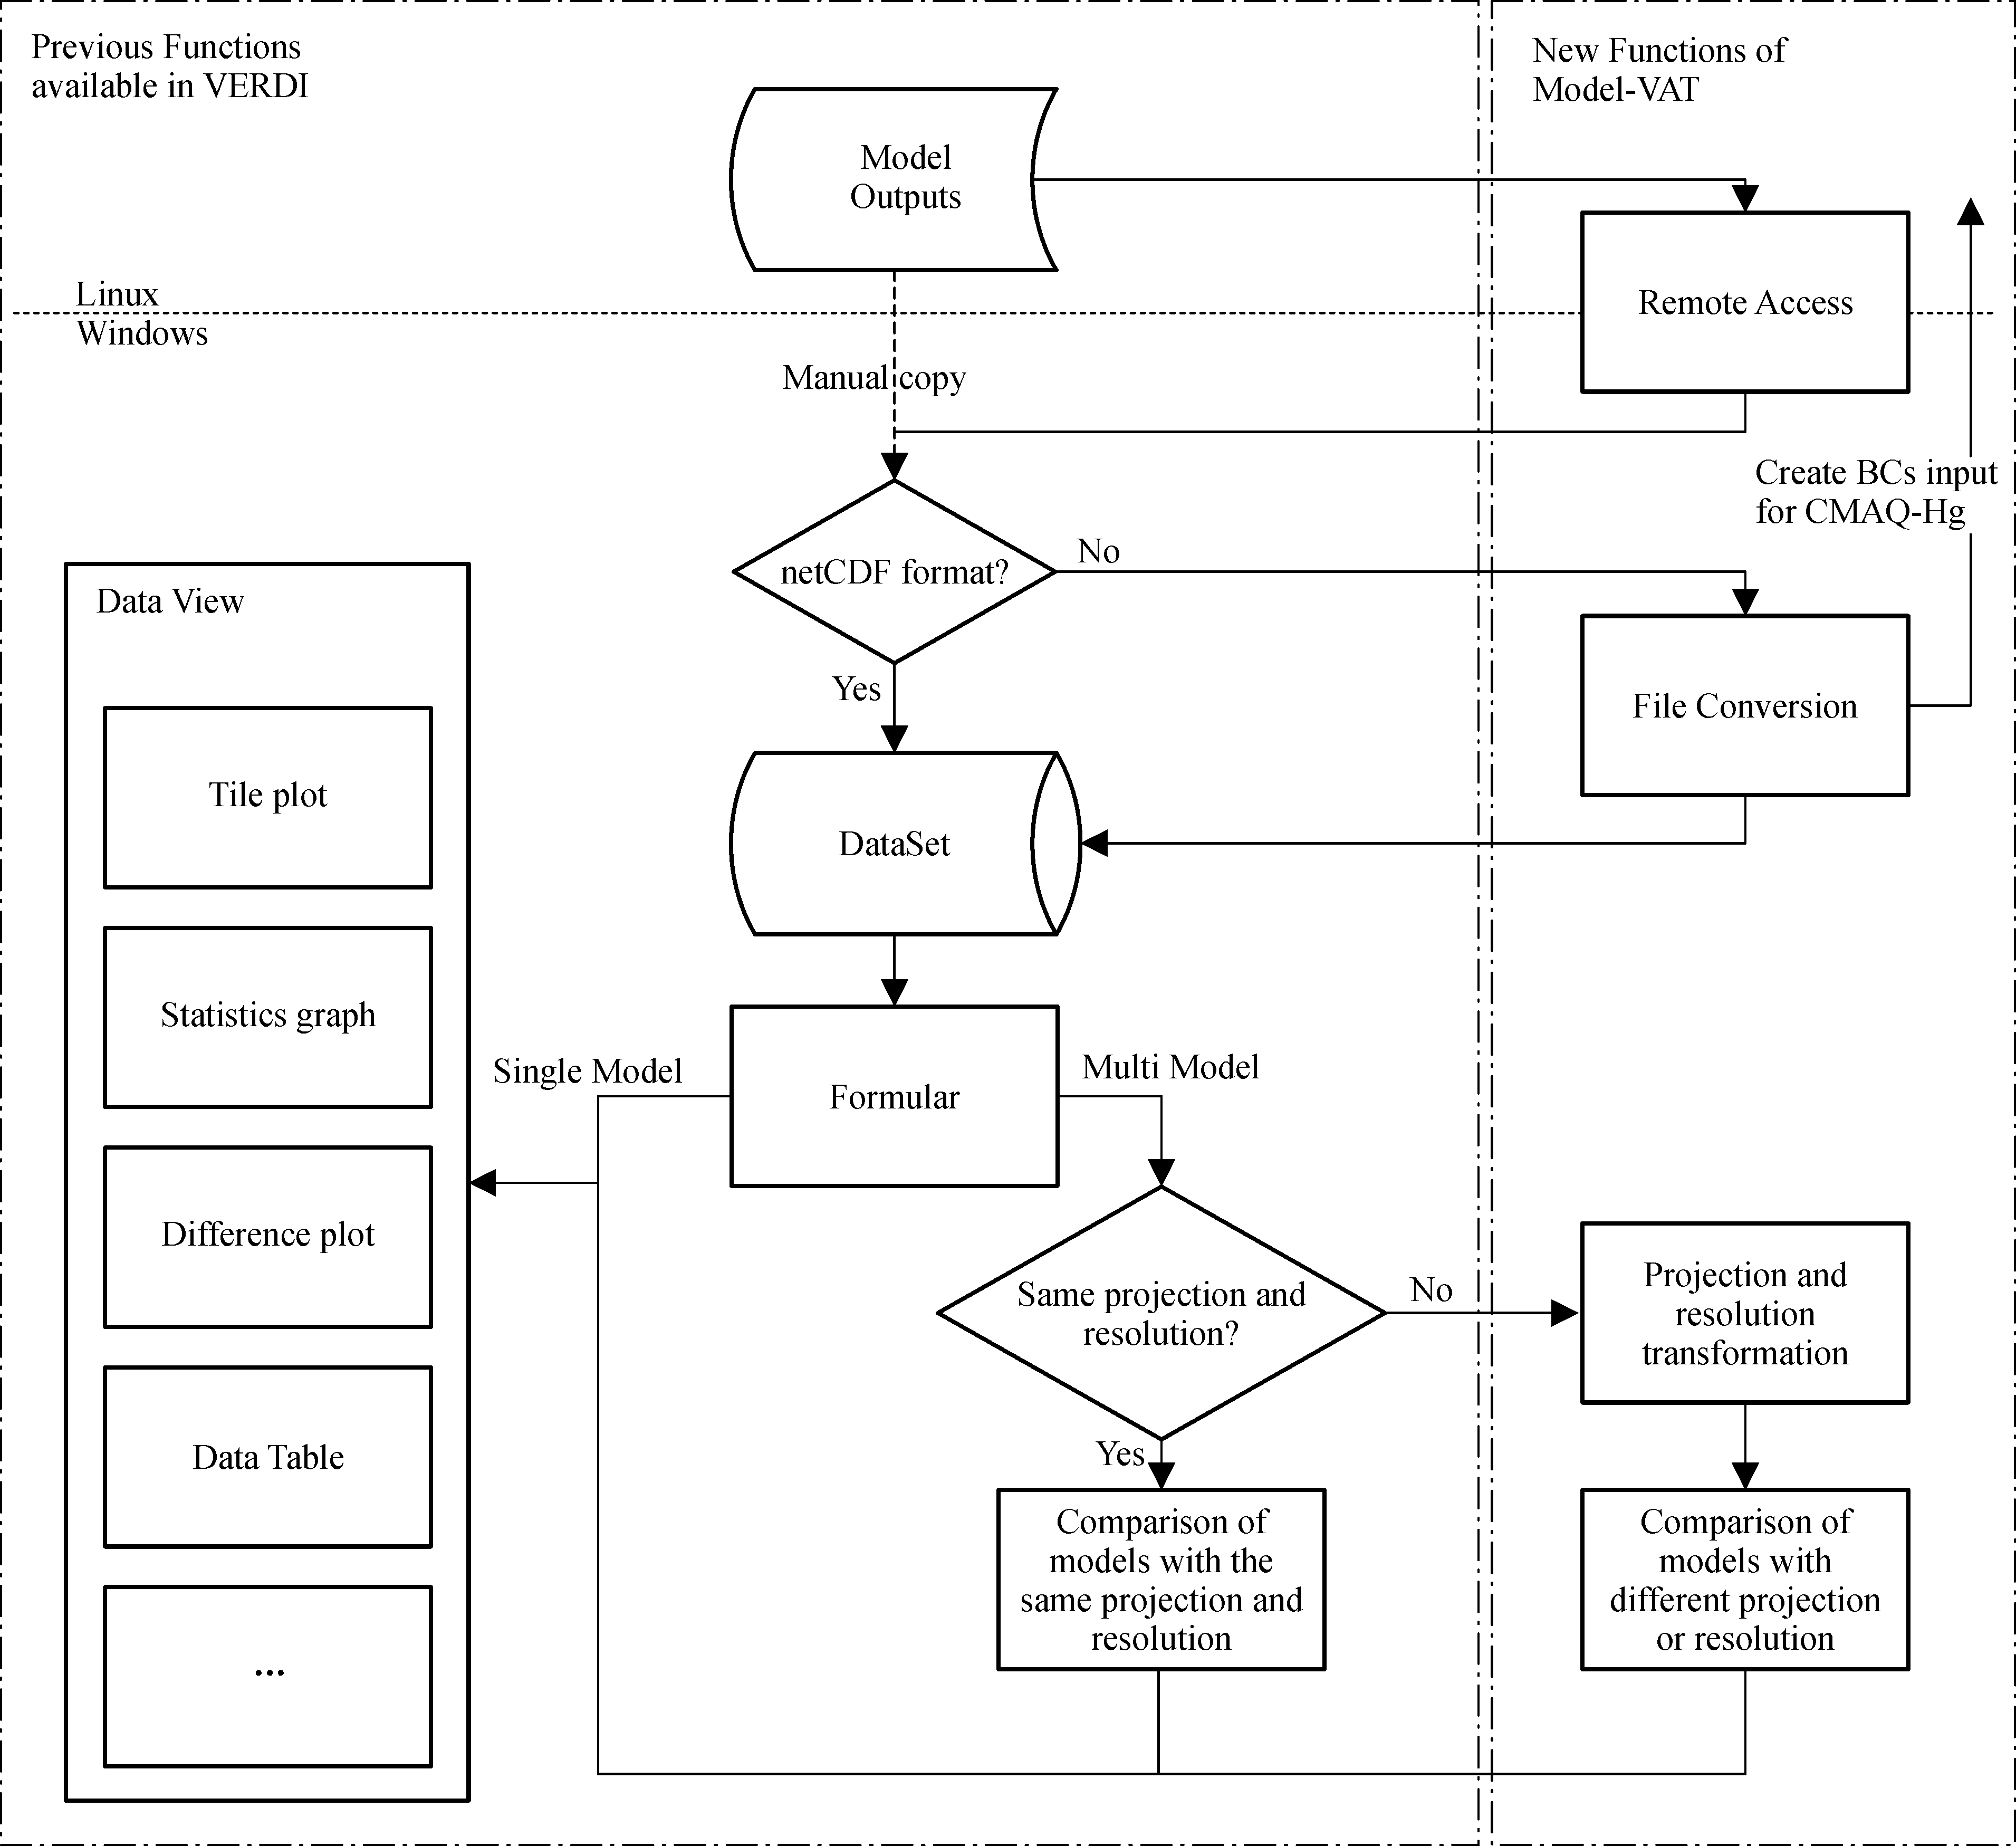
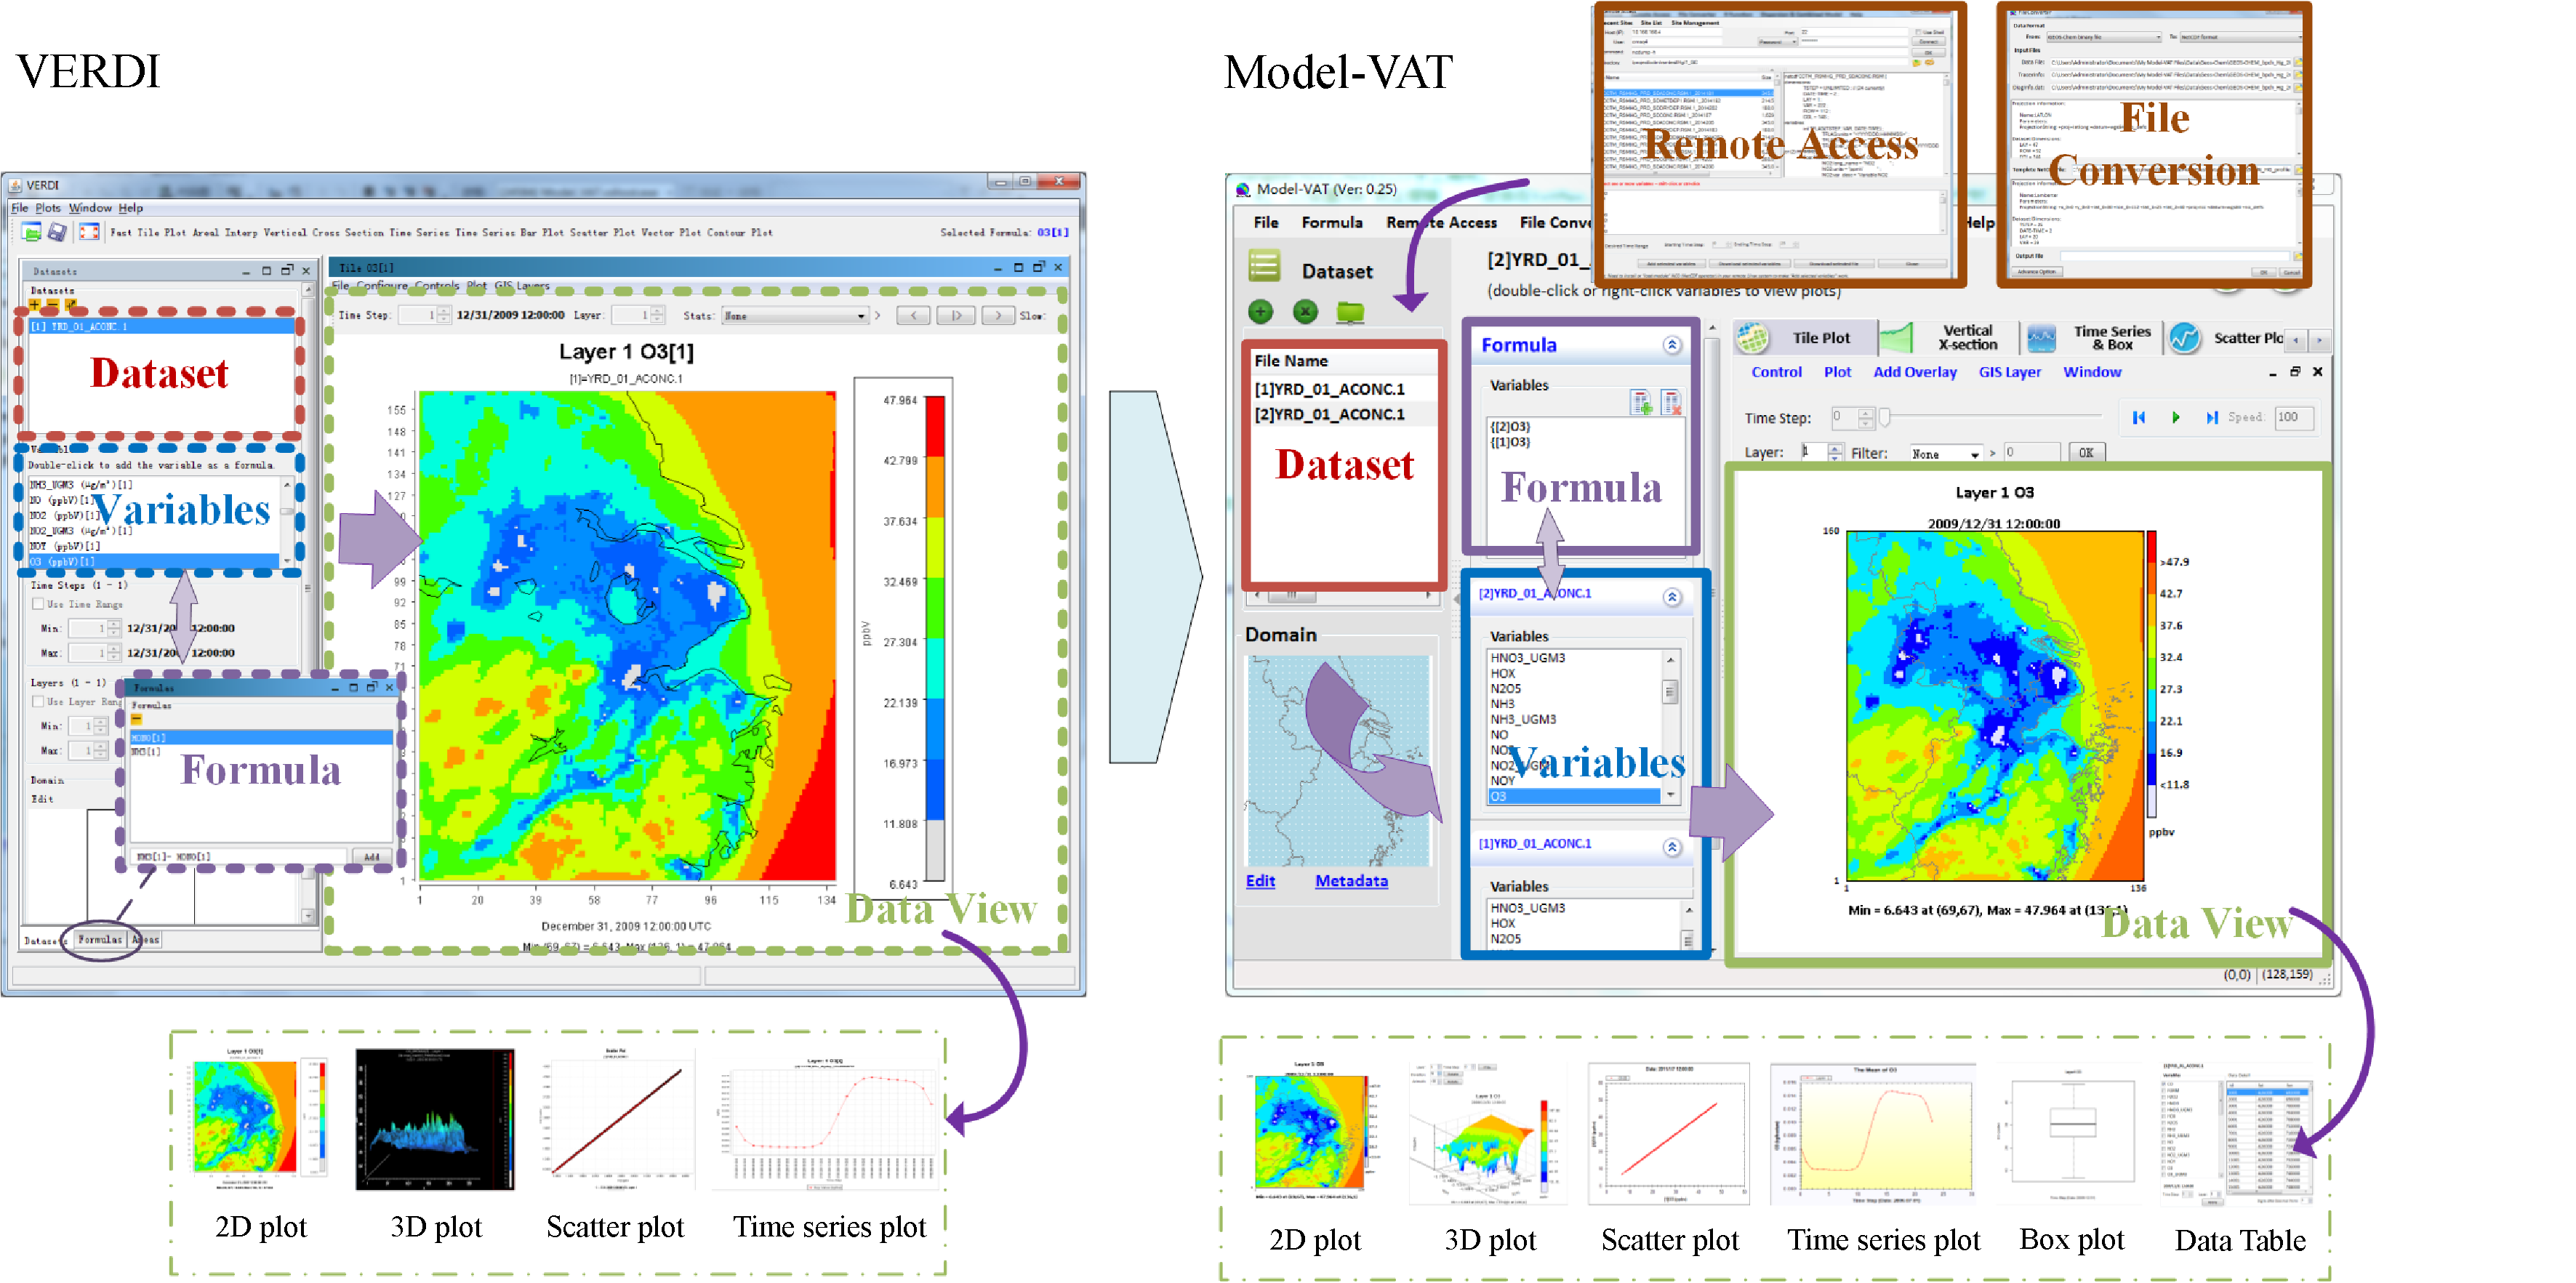
![]() Atmospheric models are essential tools to study the behavior of air pollutants. To interpret the complicated atmospheric model simulations, a new-generation Model Visualization and Analysis Tool (Model-VAT) has been developed for scientists to analyze the model data and visualize the simulation results. The Model-VAT incorporates analytic functions of conventional tools and enhanced capabilities in flexibly accessing, analyzing, and comparing simulated results from multi-scale models with different map projections and grid resolutions. The performance of the Model-VAT is demonstrated by a case study of investigating the influence of boundary conditions (BCs) on the ambient Hg formation and transport simulated by the CMAQ model over the Pearl River Delta (PRD) region. The alternative BC options are taken from (1) default time-independent profiles, (2) outputs from a CMAQ simulation of a larger nesting domain, and (3) concentration files from GEOS-Chem (re-gridded and re-projected using the Model-VAT). The three BC inputs and simulated ambient concentrations and deposition were compared using the Model-VAT. The results show that the model simulations based on the static BCs (default profile) underestimates the Hg concentrations by ~6.5%, dry depositions by ~9.4%, and wet depositions by ~43.2% compared to those of the model-derived (e.g. GEOS-Chem or nesting CMAQ) BCs. This study highlights the importance of model nesting approach and demonstrates that the innovative functions of Model-VAT enhances the efficiency of analyzing and comparing the model results from various atmospheric model simulations.
|
| Keywords
Model and data visualization
Model and data analysis
CMAQ
Boundary conditions
Mercury
|
|
Corresponding Author(s):
Yun Zhu
|
|
Issue Date: 18 December 2017
|
|
| 1 |
Wang H, Zhu Y, Jang C, Lin C J, Wang S, Fu J S, Gao J, Deng S, Xie J, Ding D, Qiu X, Long S. Design and demonstration of a next-generation air quality attainment assessment system for PM2.5 and O3. Journal of Environmental Sciences (China), 2015, 29(3): 178–188
https://doi.org/10.1016/j.jes.2014.08.023
|
| 2 |
Zhu Y, Lao Y, Jang C, Lin C J, Xing J, Wang S, Fu J S, Deng S, Xie J, Long S. Development and case study of a science-based software platform to support policy making on air quality. Journal of Environmental Sciences (China), 2015, 27(1): 97–107
https://doi.org/10.1016/j.jes.2014.08.016
|
| 3 |
Byun D W, Ching J K S, Byun D W, Ching J K S. Science Algorithms of the EPA Models- 3 Community Multiscale Air Quality (CMAQ) Modeling System. Environmental Protection Agency Office of Research & Development, 1999
|
| 4 |
Thorpe S, Ambrosiano J, Balay R, Coats C, Eyth A, Fine S, Dan H, Smith T, Tray-Anov A, Turner T. The Package for Analysis and Visualization of Environmental Data. Computing in Environmental Resource Management, Air and Waste Management Association, 1996
|
| 5 |
Schwede D, Collier N, Dolph J, Widing M A B, Howe T. A New Tool for Analyzing CMAQ Modeling Results: Visualization Environment for Rich Data Interpretation (VERDI). 2007
|
| 6 |
You Z, Zhu Y, Jang C, Wang S, Gao J, Lin C J, Li M, Zhu Z, Wei H, Yang W. Response surface modeling-based source contribution analysis and VOCs emission control policy assessment in a typical ozone-polluted urban Shunde, China. Journal of Environmental Sciences (China), 2016, 51: 294–304
https://doi.org/10.1016/j.jes.2016.05.034
|
| 15 |
Grant S L, Kim M, Lin P, Crist K C, Ghosh S, Kotamarthi V R. A simulation study of atmospheric mercury and its deposition in the Great Lakes. Atmospheric Environment, 2014, 94: 164–172
https://doi.org/10.1016/j.atmosenv.2014.05.033
|
| 16 |
Pleim J, Roselle S, Young J, Gipson G, Mathur R, Roselle S, Young J, Gipson G, Mathur R. New developments in the community multiscale air quality (CMAQ) model. Atmospheric Chemistry and Physics Discussion, 2012, (1): 2131–2166
|
| 17 |
Wang S X, Liu M, Jiang J K, Hao J M, Wu Y, Streets D G. Estimate the mercury emissions from non-coal sources in China. Environmental Sciences, 2006, 27(12): 2401
|
| 18 |
Jaeglé L, Strode S A, Selin N E, Jacob D J. The Geos-Chem model. Mercury Fate and Transport in the Global Atmosphere: Emissions, Measurements and Models. New York: Springer, 2009: 533–545
|
| 19 |
Strode S A, Jaegle L, Jaffe D A, Swartzendruber P C, Selin N E, Holmes C, Yantosca R M. Trans-Pacific transport of mercury. Journal of Geophysical Research, D, Atmospheres, 2008, 113(D15): D15305
https://doi.org/10.1029/2007JD009428
|
| 20 |
AMAP/UNEP. Technical Background Report for the Global Mercury Assessment 2013. Arctic Monitoringand Assessment Programme, Oslo, Norway/UNEP Chemicals Branch, Geneva, Switzerland, 2013
|
| 21 |
Moon N K, Byun D W. A Simple User's Guide for “geos2cmaq” Code: Linking CMAQ with GEOS-CHEM. Version 1.0, Interim report from Institute for Multidimensional Air Quality studies (IMAQS), University of Houston, TX. Available online at: . 2004
|
| 22 |
Gbor P K, Wen D, Meng F, Yang F, Zhang B, Sloan J J. Improved model for mercury emission, transport and deposition. Atmospheric Environment, 2006, 40(5): 973–983
https://doi.org/10.1016/j.atmosenv.2005.10.040
|
| 23 |
Pongprueksa P, Lin C J, Lindberg S E, Jang C, Braverman T, Russell Bullock O Jr, Ho T C, Chu H W. Scientific uncertainties in atmospheric mercury models III: Boundary and initial conditions, model grid resolution, and Hg(II) reduction mechanism. Atmospheric Environment, 2008, 42(8): 1828–1845
https://doi.org/10.1016/j.atmosenv.2007.11.020
|
| 24 |
Wang L, Wang S, Zhang L, Wang Y, Zhang Y, Nielsen C, McElroy M B, Hao J. Source apportionment of atmospheric mercury pollution in China using the GEOS-Chem model. Environmental Pollution, 2014, 190: 166–175
https://doi.org/10.1016/j.envpol.2014.03.011
|
| 25 |
Gao W, Tang G, Dongsheng J. Implementation effects and countermeasures of China’s Air Pollution Prevention and Control Action Plan. Research of Environmental Sciences, 2016, 29(11): 1567–1574 (in Chinese)
|
| 7 |
Long S, Yun Z, Jang C, Lin C J, Wang S, Zhao B, Jian G, Shuang D, Xie J, Qiu X. A case study of development and application of a streamlined control and response modeling system for PM2.5 attainment assessment in China. Journal of Environmental Sciences (China), 2016, 41(3): 69–80
https://doi.org/10.1016/j.jes.2015.05.019
|
| 26 |
Wang S, Zhang L, Wang L, Wu Q, Wang F, Hao J. A review of atmospheric mercury emissions, pollution and control in China. Frontiers of Environmental Science & Engineering, 2014, 8(5): 631–649
https://doi.org/10.1007/s11783-014-0673-x
|
| 27 |
Buch A C, Correia M E F, Teixeira D C, Silva-Filho E V. Characterization of soil fauna under the influence of mercury atmospheric deposition in Atlantic Forest, Rio de Janeiro, Brazil. Journal of Environmental Sciences (China), 2015, 32(6): 217–227
https://doi.org/10.1016/j.jes.2015.01.009
|
| 28 |
Li Z, Xia C, Wang X, Xiang Y, Xie Z. Total gaseous mercury in Pearl River Delta region, China during 2008 winter period. Atmospheric Environment, 2011, 45(4): 834–838
https://doi.org/10.1016/j.atmosenv.2010.11.032
|
| 29 |
Chen L, Liu M, Xu Z, Fan R, Tao J, Chen D, Zhang D, Xie D, Sun J. Variation trends and influencing factors of total gaseous mercury in the Pearl River Delta—A highly industrialised region in South China influenced by seasonal monsoons. Atmospheric Environment, 2013, 77(7): 757–766
https://doi.org/10.1016/j.atmosenv.2013.05.053
|
| 30 |
Liu M, Chen L G, Fan R F, Xu Z C, Chen D H, Zhang D Q, Zheng J P, Zhou Y, Sun J R. Preliminary study of the concentration and variation characteristics of total gaseous mercury in Dinghu Mountain Area. Acta Scientiae Circumstantiae, 2012, 32(4): 932–939
|
| 31 |
Liu M, Chen L G, Tao J, Xu Z C, Zhu L H, Qian D L, Fan R F. Seasonal and diurnal variation of total gaseous mercury in Guangzhou City, China. Environmental Sciences, 2012, 32(9): 1554–1558
|
| 8 |
Skamarock W C, Klemp J B, Dudhia J, Gill D O, Barker D M, Wang W, Powers J G. A Description of the Advanced Research WRF Version 2. NCAR Technical Note NCAR/TN-468+STR, 2005, 88: 7–25
|
| 9 |
Selin N E, Jacob D J. Seasonal and spatial patterns of mercury wet deposition in the United States: constraints on the contribution from North American anthropogenic sources. Atmospheric Environment, 2008, 42(21): 5193–5204
https://doi.org/10.1016/j.atmosenv.2008.02.069
|
| 10 |
Venkatram A, Brode R W, Lee R F, Paine R J, Peters W D, Weil J C, Cimorelli A J, Wilson R B, Perry S G. AERMOD: A dispersion model for industrial source applications. Part I: General model formulation and boundary layer characterization. Journal of Applied Meteorology, 2005, 44(5): 682–693
https://doi.org/10.1175/JAM2227.1
|
| 11 |
Perry S G, Cimorelli A J, Paine R J, Brode R W, Weil J C, Venkatram A, Wilson R B, Lee R F, Peters W D. AERMOD: A dispersion model for industrial source applications. Part II: Model performance against 17 field study databases. Journal of Applied Meteorology, 2005, 44(5): 694–708
https://doi.org/10.1175/JAM2228.1
|
| 12 |
Russell A, Dennis R. NARSTO critical review of photochemical models and modeling. Atmospheric Environment, 2000, 34(12–14): 2283–2324
https://doi.org/10.1016/S1352-2310(99)00468-9
|
| 13 |
Zhang L. Intercontinental transport of air pollution. Frontiers of Environmental Science & Engineering in China, 2010, 4(1): 20–29
https://doi.org/10.1007/s11783-010-0014-7
|
| 14 |
Myers T, Atkinson R D, Bullock O R, Bash J O. Investigation of effects of varying model inputs on mercury deposition estimates in the Southwest US. Atmospheric Chemistry and Physics, 2012, 12(4): 10273–10304
|
|
Viewed |
|
|
|
Full text
|
|
|
|
|
Abstract
|
|
|
|
|
Cited |
|
|
|
|
| |
Shared |
|
|
|
|
| |
Discussed |
|
|
|
|