|
|
|
Permitted emissions of major air pollutants from coal-fired power plants in China based on best available control technology |
Xiaohui Song1,2, Chunlai Jiang1( ), Yu Lei1, Yuezhi Zhong1, Yanchao Wang1 ), Yu Lei1, Yuezhi Zhong1, Yanchao Wang1 |
1. Atmospheric Environment Department, Chinese Academy for Environmental Planning, Beijing 100012, China
2. College of Environmental Science and Engineering, Nankai University, Tianjin 300350, China |
|
|
|
|
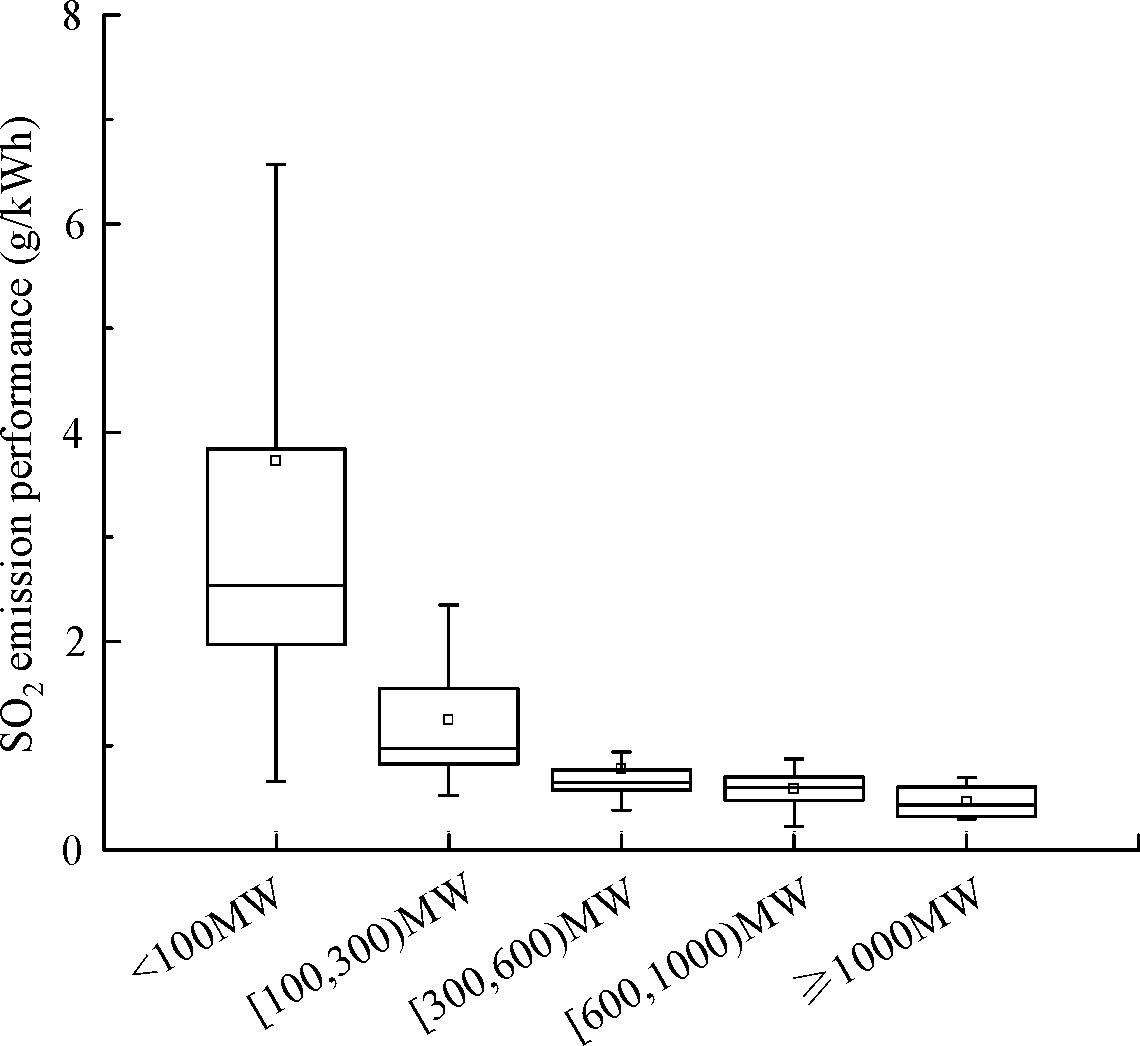
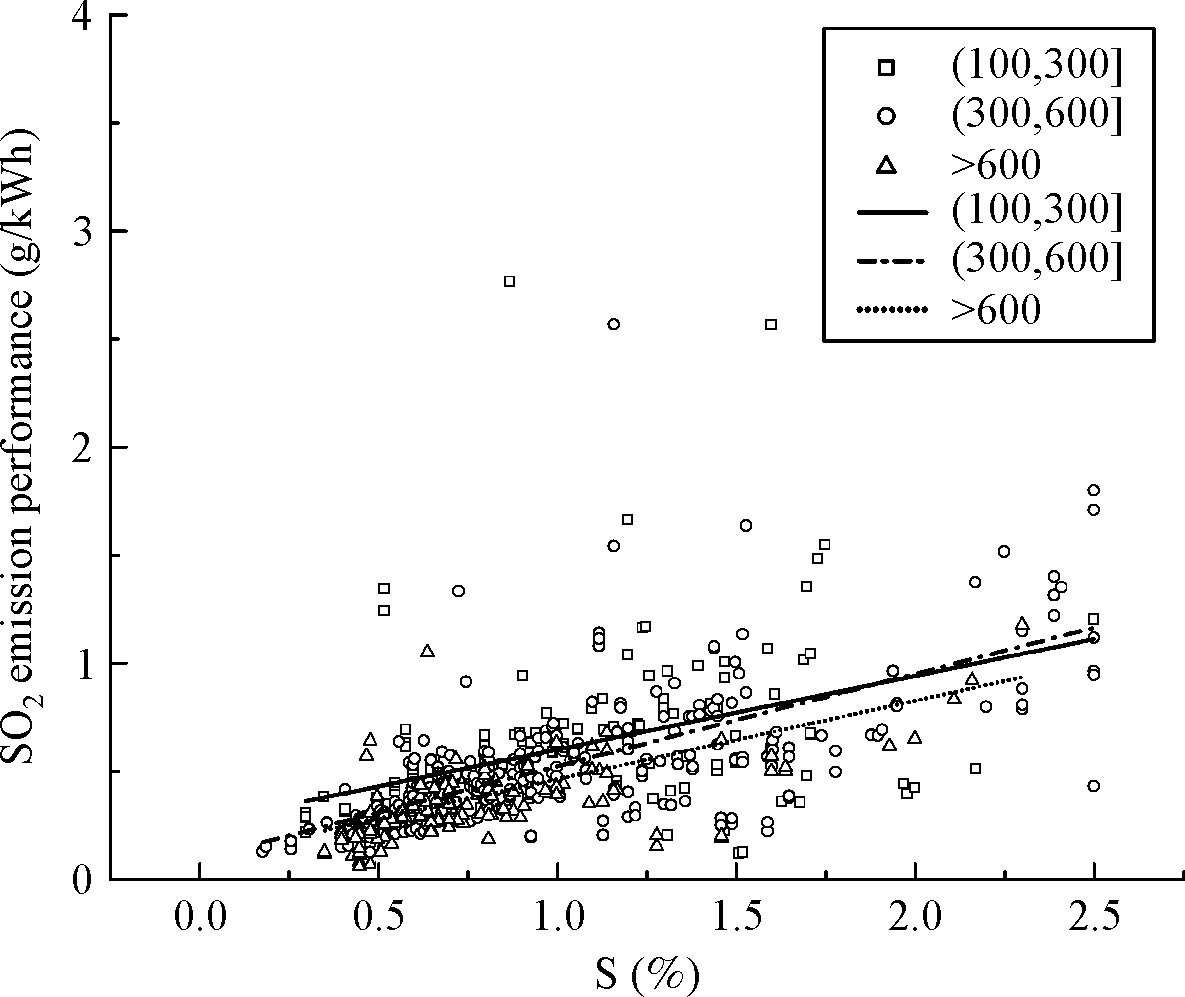
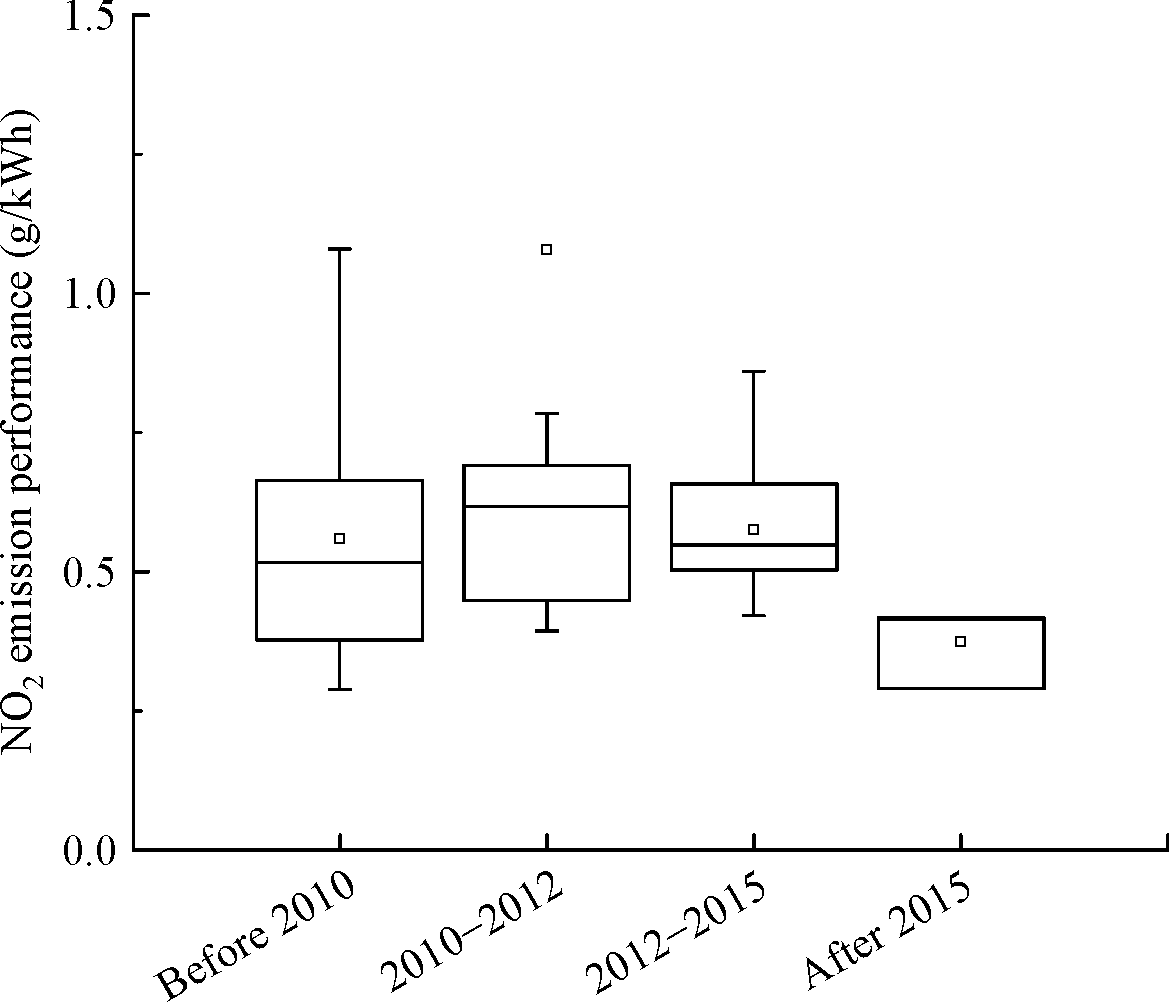
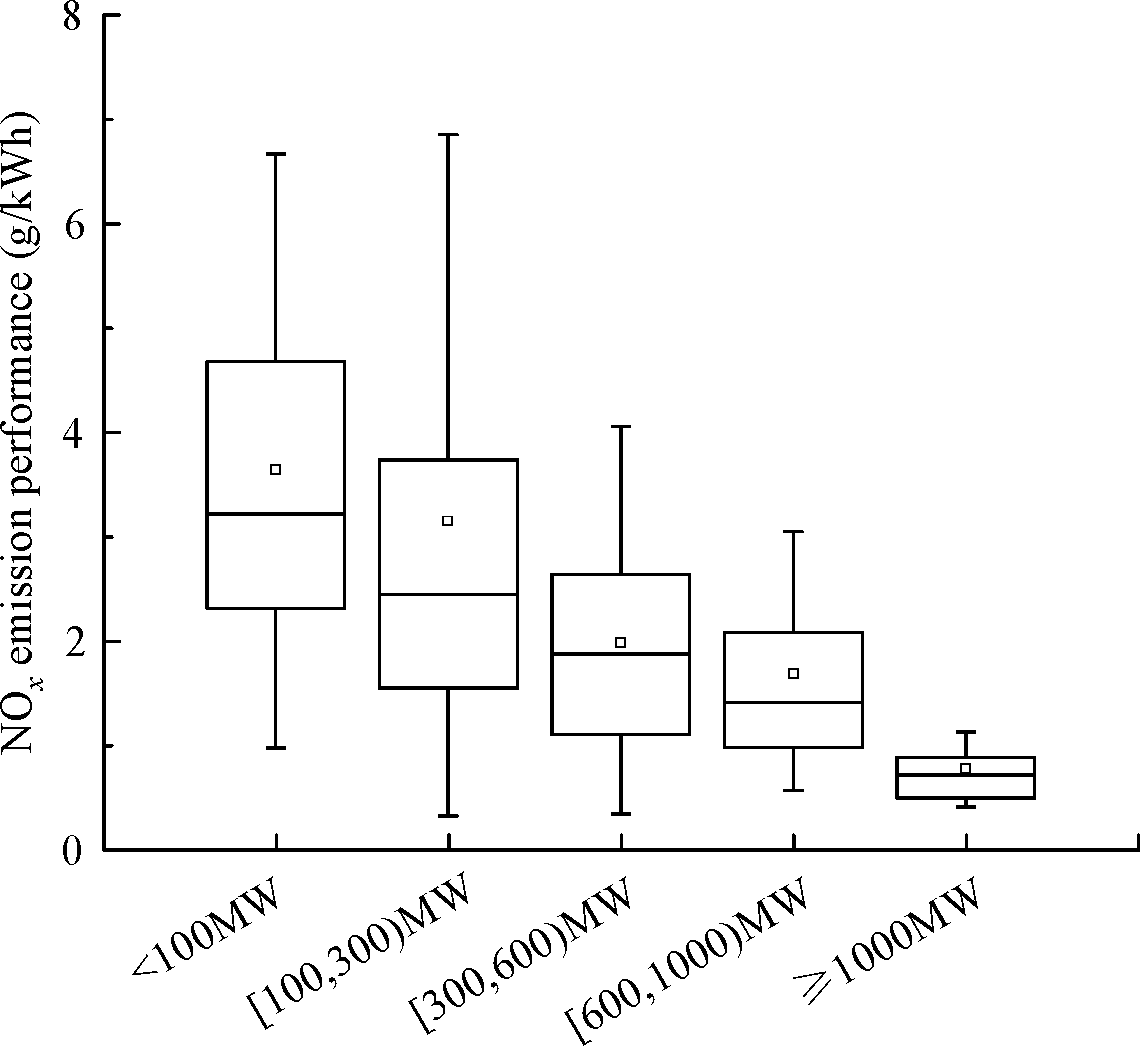
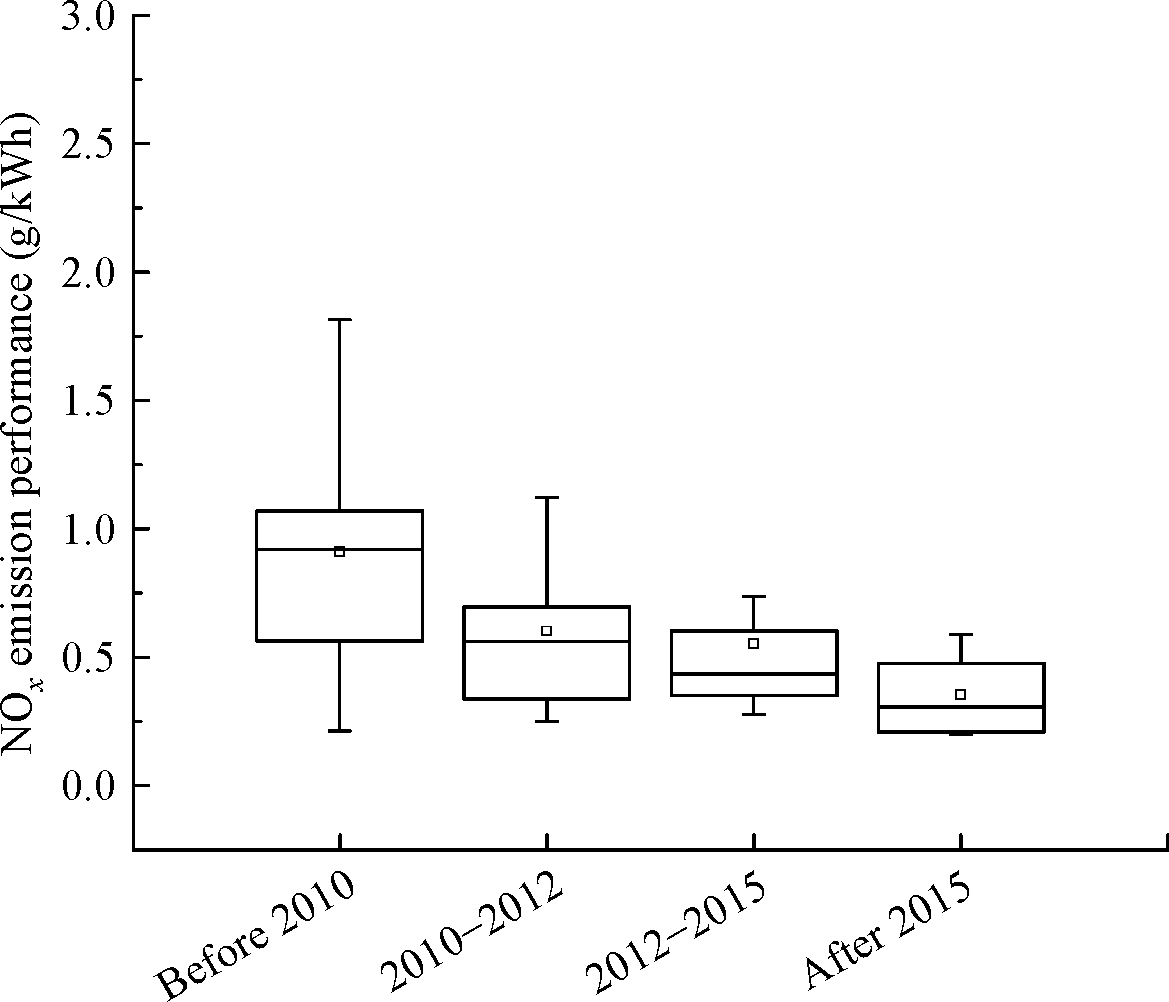
Abstract We proposed the SO2 and NOx emission performance standards for coal-fired power plants based on the best available control technology. The CFPGUs’ SO2 emission performance reference values should be 0.34 g/kWh for active units in general areas and 0.13 g/kWh for newly built units and active units in key areas. The CFPGUs’ NOx emission performance standard reference values should be 0.35 g/kWh for active units in general areas and 0.175 g/kWh for new units and active units in key areas.
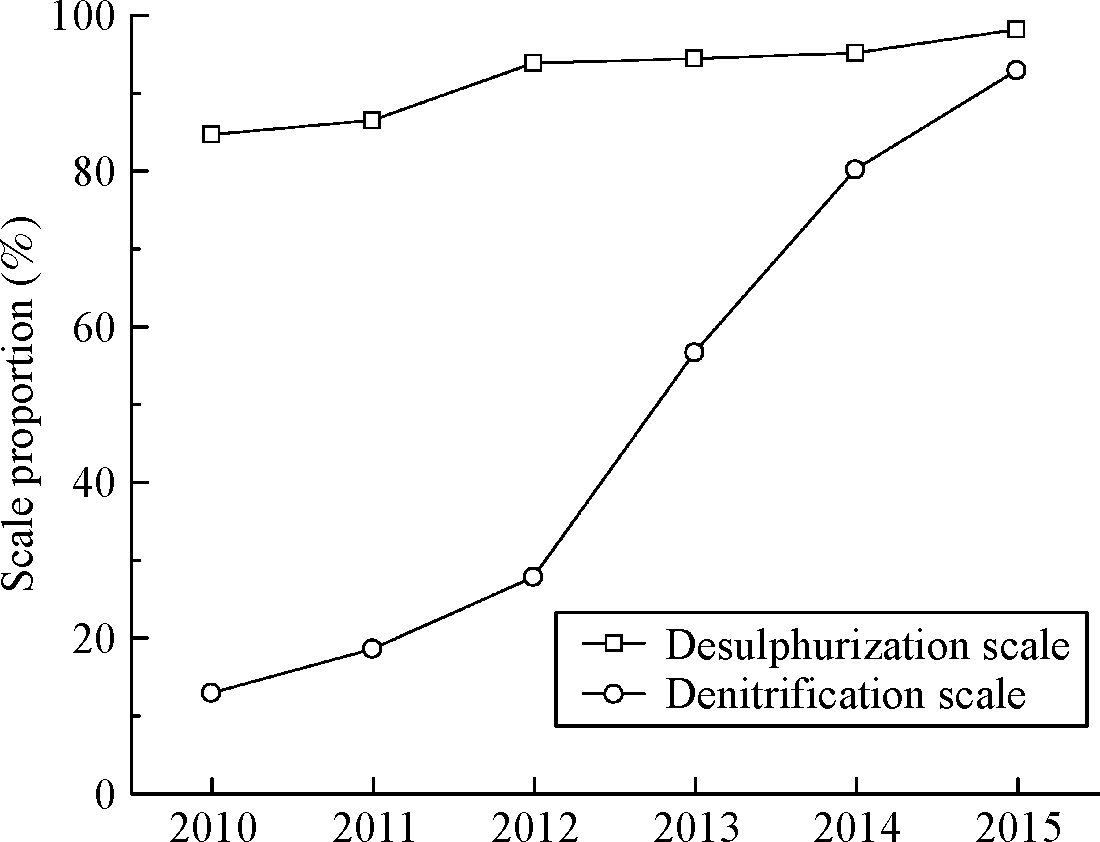
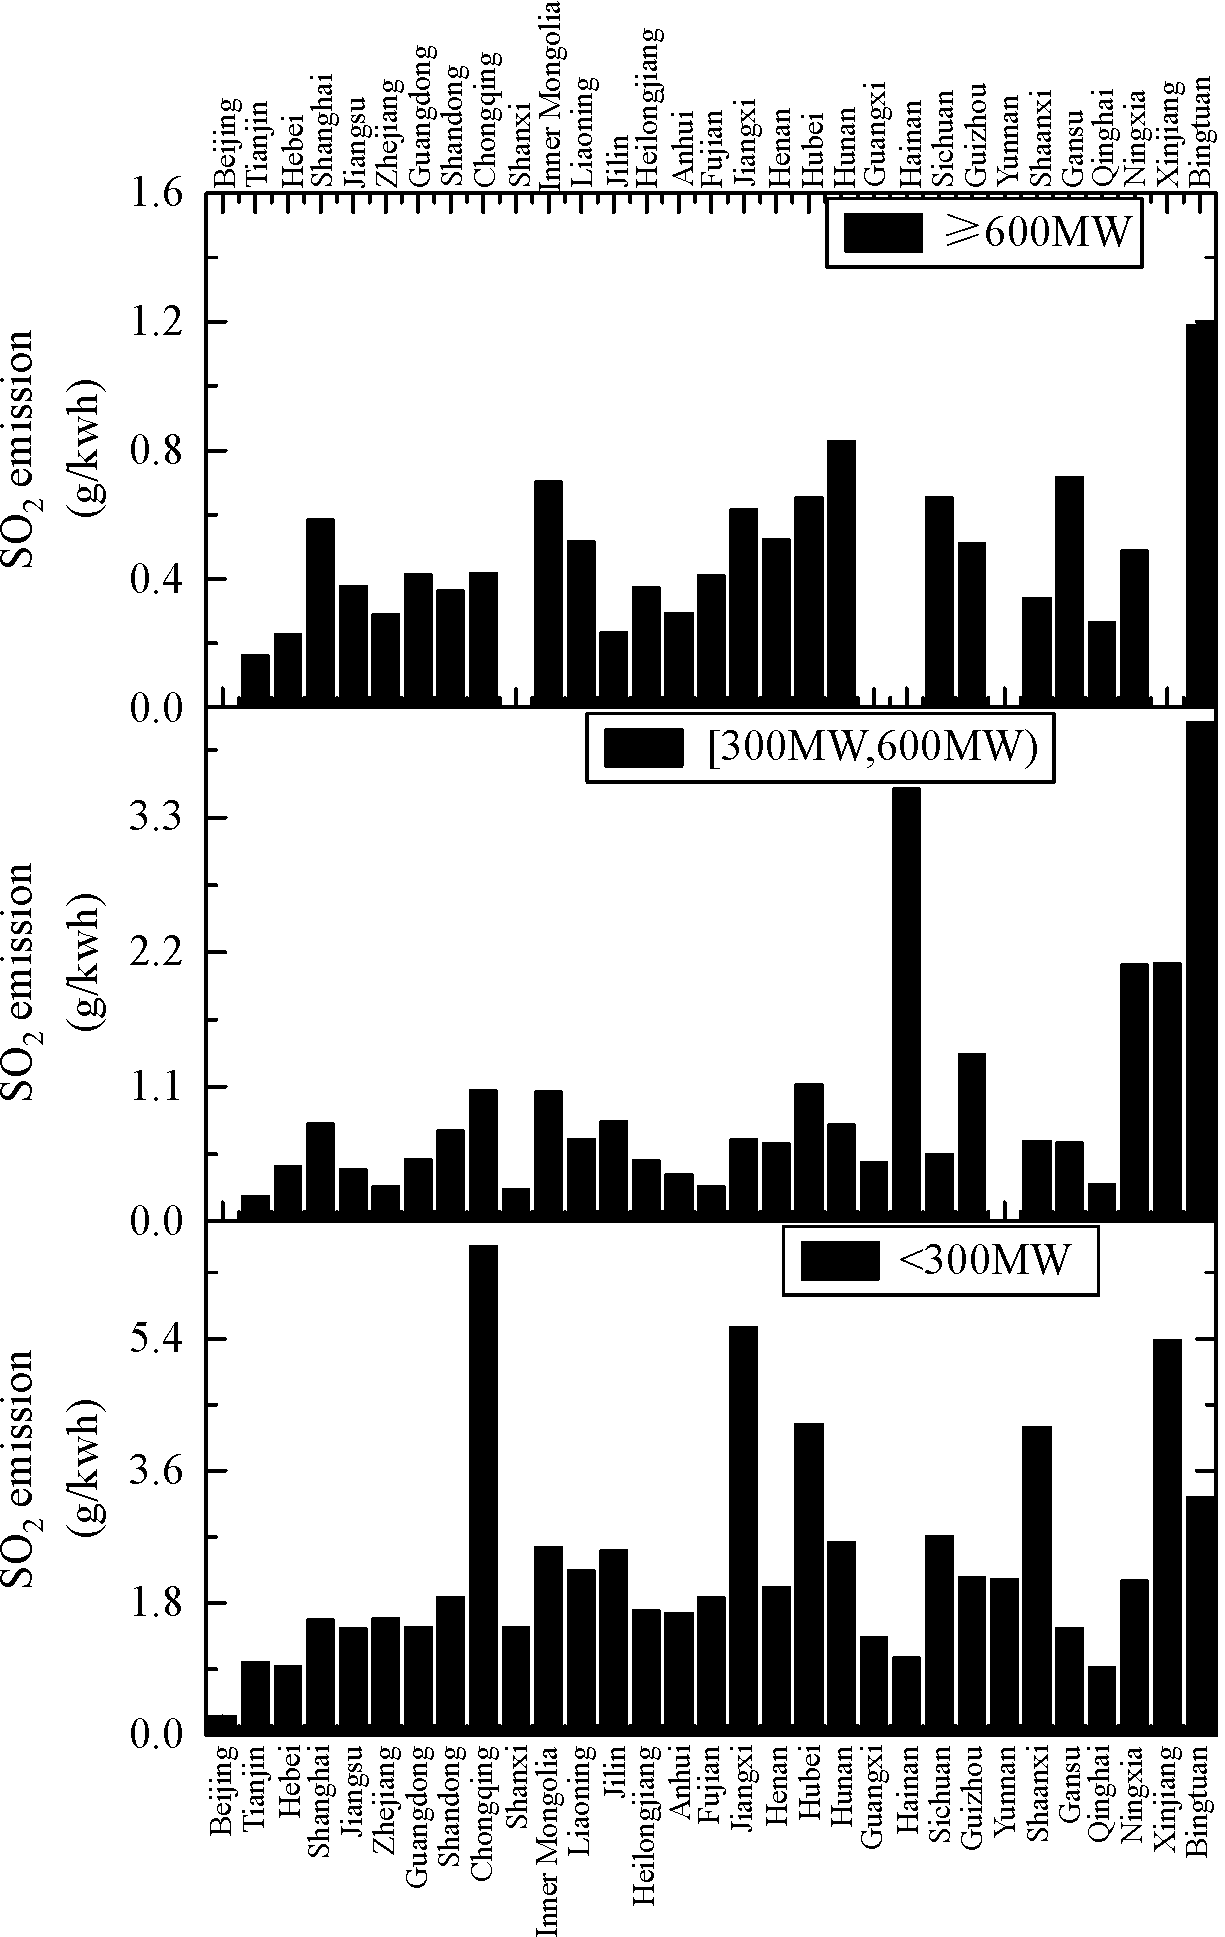
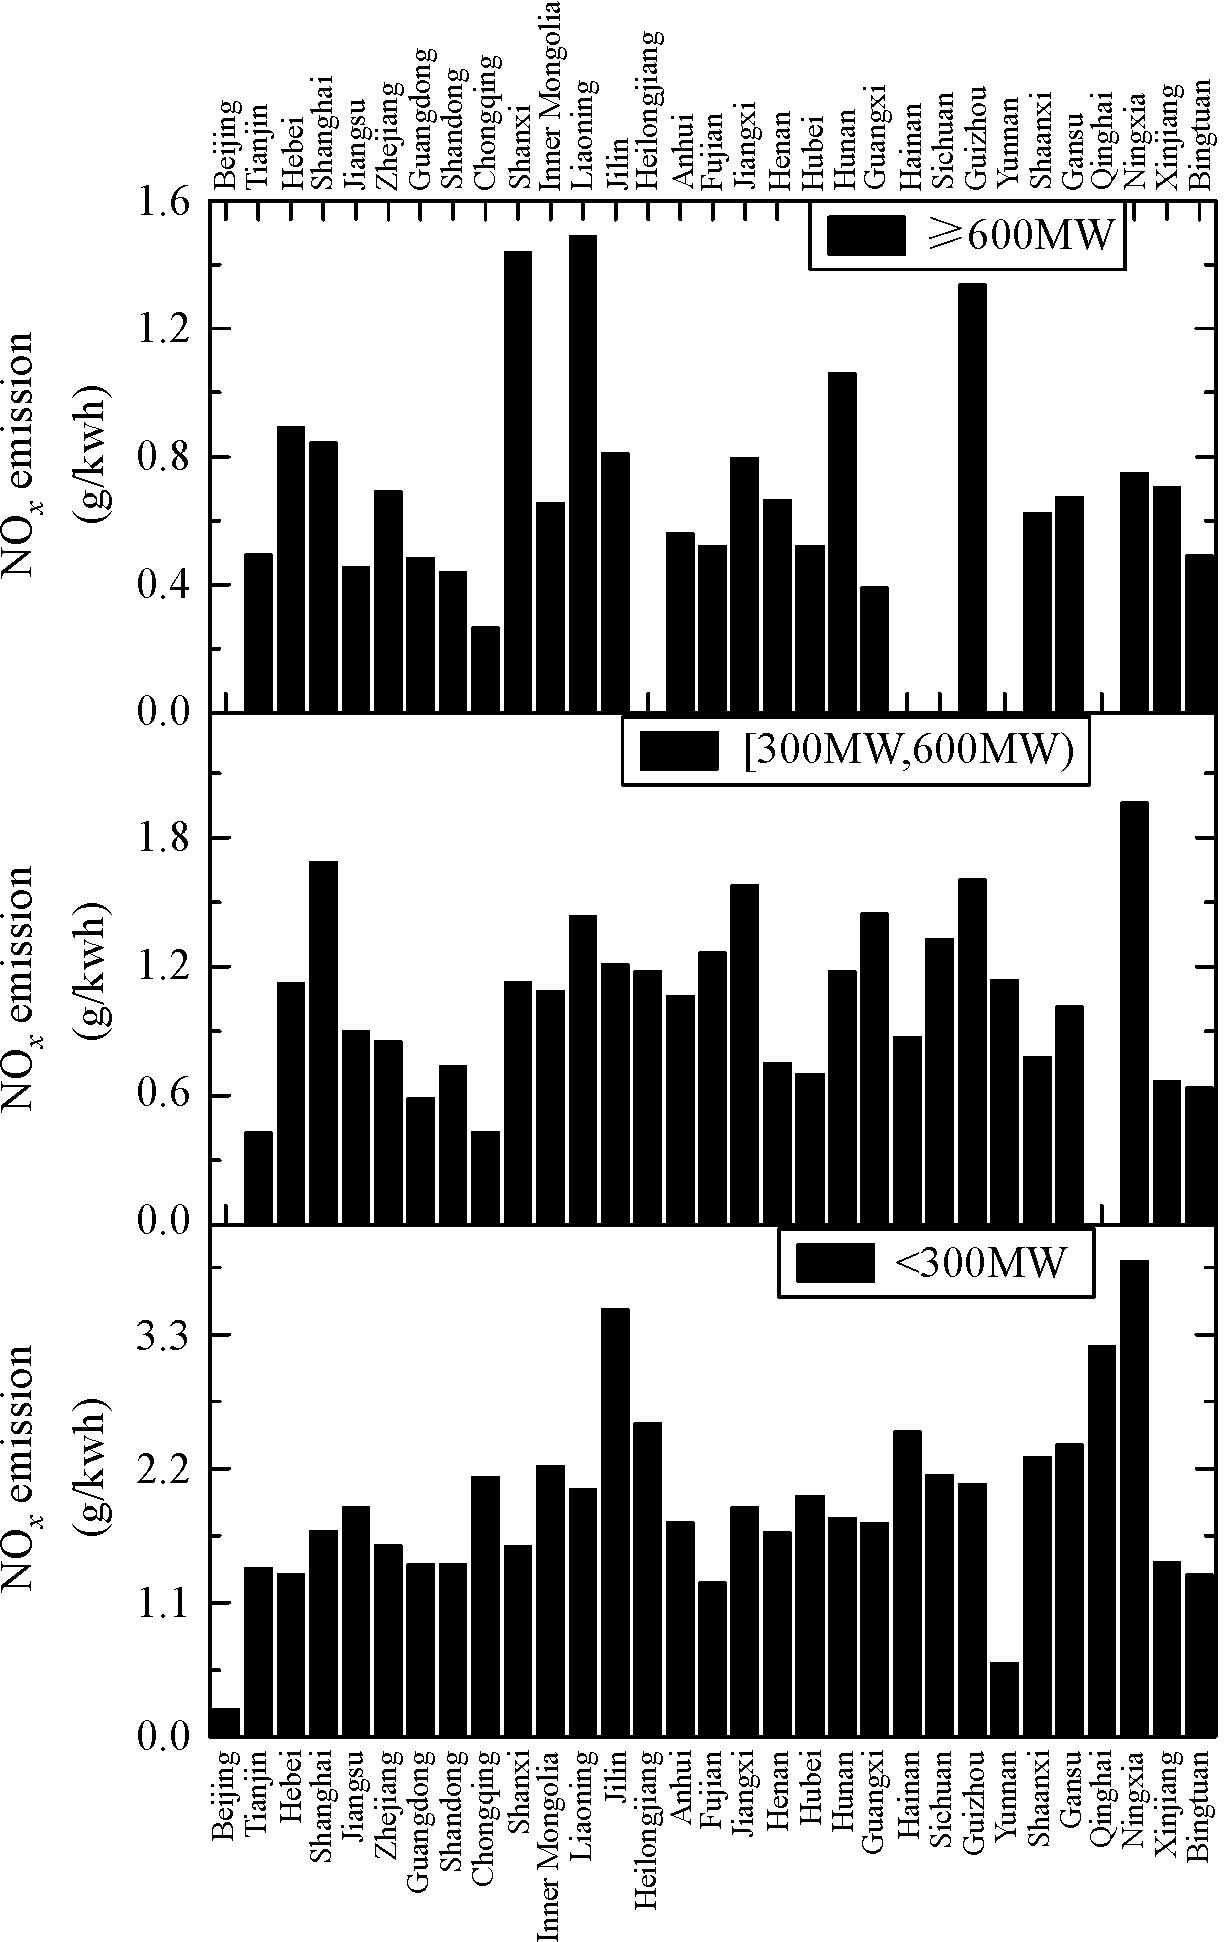
![]() Based on the activity level and technical information of coal-fired power-generating units (CFPGU) obtained in China from 2011 to 2015, we, 1) analyzed the time and spatial distribution of SO2 and NOx emission performance of CFPGUs in China; 2) studied the impact of installed capacity, sulfur content of coal combustion, and unit operation starting time on CFPGUs’ pollutant emission performance; and 3) proposed the SO2 and NOx emission performance standards for coal-fired power plants based on the best available control technology. Our results show that: 1) the larger the capacity of a CFPGU, the higher the control level and the faster the improvement; 2) the CFPGUs in the developed eastern regions had significantly lower SO2 and NOx emission performance values than those in other provinces due to better economic and technological development and higher environmental management levels; 3) the SO2 and NOx emission performance of the Chinese thermal power industry was significantly affected by the single-unit capacity, coal sulfur content, and unit operation starting time; and 4) based on the achievability analysis of best available pollution control technology, we believe that the CFPGUs’ SO2 emission performance reference values should be 0.34 g/kWh for active units in general areas, 0.8 g/kWh for active units in high-sulfur coal areas, and 0.13 g/kWh for newly built units and active units in key areas. In addition, the NOx emission performance reference values should be 0.35 g/kWh for active units in general areas and 0.175 g/kWh for new units and active units in key areas.
|
| Keywords
Coal-fired power-generating units (CFPGU)
Emission performance
Best available control technology
|
|
Corresponding Author(s):
Chunlai Jiang
|
|
Issue Date: 03 September 2018
|
|
| 1 |
Burtraw D, Szambelan S J F (2009). U.S. Emissions Trading Markets for SO2 and NOx. Washington: Social Science Electronic Publishing
|
| 2 |
Chan G, Stavins R, Stowe R, Sweeney R. The SO2 allowance trading system and the clean air act amendments of 1990: Reflections on twenty years of policy innovation. Social Science Electronic Publishing, 2012, 65(2): 419–452
|
| 3 |
Crossland J, Li B, Roca E (2013). Is the European Union Emissions Trading Scheme (EU ETS) informationally efficient? Evidence from momentum-based trading strategies. Applied Energy, 109(2): 10–23
https://doi.org/10.1016/j.apenergy.2013.03.079
|
| 4 |
Department of Science, Technology and Standards (2017). Guidelines on Available Technologies of Pollution Prevention and Control for Thermal Power Plant (HJ 2301–2017). Beijing: China Environmental Science Press
|
| 5 |
EPA (2006). NOx Budget Trading Program: 2005 Program Compliance and Environmental Results. Washington, D C: EPA
|
| 6 |
EPA (2017). Emissions & Generation Resource Integrated Database (eGRID2014). Washington, D C: EPA
|
| 7 |
Han W. A case study of determining target value of total amount of air pollutants control (2007). Dissertation for the Master Degree. Changchun: Northeast Normal University
|
| 8 |
Jin L(2013). Study on allocation mechanism of total air pollutants in China. Dissertation for the Master Degree. Beijing: Chinese Research Academy of Environmental Sciences
|
| 9 |
Liang R (2010). Study on American clean air law. Dissertation for the Doctoral Degree. Qingdao: Ocean University of China
|
| 10 |
Liu F, Zhang Q, Tong D, Zheng B, Li M, Huo H, He K B (2015). High-resolution inventory of technologies, activities, and emissions of coal-fired power plants in China from 1990 to 2010. Atmospheric Chemistry and Physics, 15(13): 18787–18837
|
| 11 |
Liu P G, Jiang N, Yu Y, Chen W L (2007). Genetic algorithm based method of atmospheric pollutant total emission control. Environmental Pollution and Control, 29(3): 266–237
|
| 12 |
Ministry of Environmental Protection (2011). Accounting rules for major pollutants emission reduction in the 12th Five-Year Plan. Beijing: Ministry of Environmental Protection
|
| 13 |
Office of Air and Radiation (2006). Contributions of CAIR/CAMR/CAVR to NAAQS Attainment: Focus on Control Technologies and Emission Reductions in the Electric Power Sector. Washington, D C: EPA
|
| 14 |
Qiu H(2016). Research on calculation of atmospheric capacity and control of total air pollutant emission: A case study of Hechuan, Chongqing. Dissertation for the Master Degree. Chongqing: Chongqing University
|
| 15 |
Shi X F, Lu L. Matlab language. Study of method of distribution of air capacity and total amount control of pollutants emission. Environmental Engineering, 2008, 18(1): 50–53
|
| 16 |
Wang J N, Pan X Z ( 2005). Application of linear programming in the allocation of environmental capacity resources. Environmental Sciences, 26(6): 195–198
|
| 17 |
Wang Q J (2011). On the initial allocation of emission rights. Dissertation for the Doctor Degree. Wuhan: Wuhan University
|
| 18 |
Wu Z F(2011). Research about initial allocation of emission rights. Dissertation for the Master Degree. Wuhan: Wuhan University of Science and Technology
|
| 19 |
Xu T L(2005). Study on pollution load allocation of total air pollutant control. Dissertation for the Master Degree. Changchun: Northeast Normal University
|
| 20 |
Xu Y L, Yang J T, Jiang C L, Chen X J, Lei Y, Zhong Y Z ( 2013). Application of generation performance standard in total emissions allocation of air pollutants in thermal power industry. Journal of Safety and Environment, 13(6): 108–111
|
| 21 |
Zhang W, Bai J (2015). The application and discussion of performance method of coal fired power generation industry in pollutant emission calculating. Environmental Development, 27(2): 11–14
|
| 22 |
Zhang Y, Chen G C ( 2014). Distribution and assessment of initial waste discharge rights. Environmental Science and Management, 39(5): 167–169
|
| 23 |
Zhang Y L, Zhang B, Bi J, He P (2013). Modeling the impact of uncertainty in emissions trading markets with bankable permits. Frontiers of Environmental Science & Engineering, 7(2): 231–241
https://doi.org/10.1007/s11783-012-0431-x
|
| 24 |
Zhong Y Z, Jiang C L, Song X H, Lv H D (2016). Scenario analysis of main air pollutant reduction potentials in thermal power industry during “The 13th Five-year Plan”. Environmental Science and Management, (12): 58–62
|
| 25 |
Zhou W(2010). Study on GPS-based nitrogen oxides control mechanism in thermal power sector. Dissertation for the Master Degree. Beijing: Chinese Research Academy of Environmental Sciences
|
| 26 |
Zhu F H, Wang S (2014). Technology integration and recommendations on ultra-low emission of coal-fired air pollutants. Environment and Ecology in the Three Gorges, (5): 25–29
|
| 27 |
Zhu F H, Xu Y Y, Wang S (2016). Reviewing the ultra-low emissions technology major progress of coal-fired power plants and analyzing its application effect. Environment and Progress, 44(6): 59–63
|
| 28 |
Zhu F H, Xue R J, Zhu G F, Cheng J (2003). To use GPS to distribute SO2 emission allowance in power industry. Electric Power, 36(12): 76–79
|
| 29 |
Zhu Y(2006). Application of gray theory in total emission control programming of atmospheric pollutant. Dissertation for the Master Degree. Dalian: Dalian University of Technolog
|
|
Viewed |
|
|
|
Full text
|
|
|
|
|
Abstract
|
|
|
|
|
Cited |
|
|
|
|
| |
Shared |
|
|
|
|
| |
Discussed |
|
|
|
|