|
|
|
Impacts of emissions and meteorological changes on China’s ozone pollution in the warm seasons of 2013 and 2017 |
Dian Ding1, Jia Xing1,2( ), Shuxiao Wang1,2(), Xing Chang1, Jiming Hao1,2 ), Shuxiao Wang1,2(), Xing Chang1, Jiming Hao1,2 |
1. State Key Joint Laboratory of Environmental Simulation and Pollution Control, School of Environment, Tsinghua University, Beijing 100084, China
2. State Environmental Protection Key Laboratory of Sources and Control of Air Pollution Complex, Beijing 100084, China |
|
|
|
|
Abstract O3 increment is mainly caused by changes in meteorology rather than emissions. Emission reduction is effective to reduce O3 nationwide, especially in summer. Strengthened NOx controls are necessary to meet the ambient O3 standard.
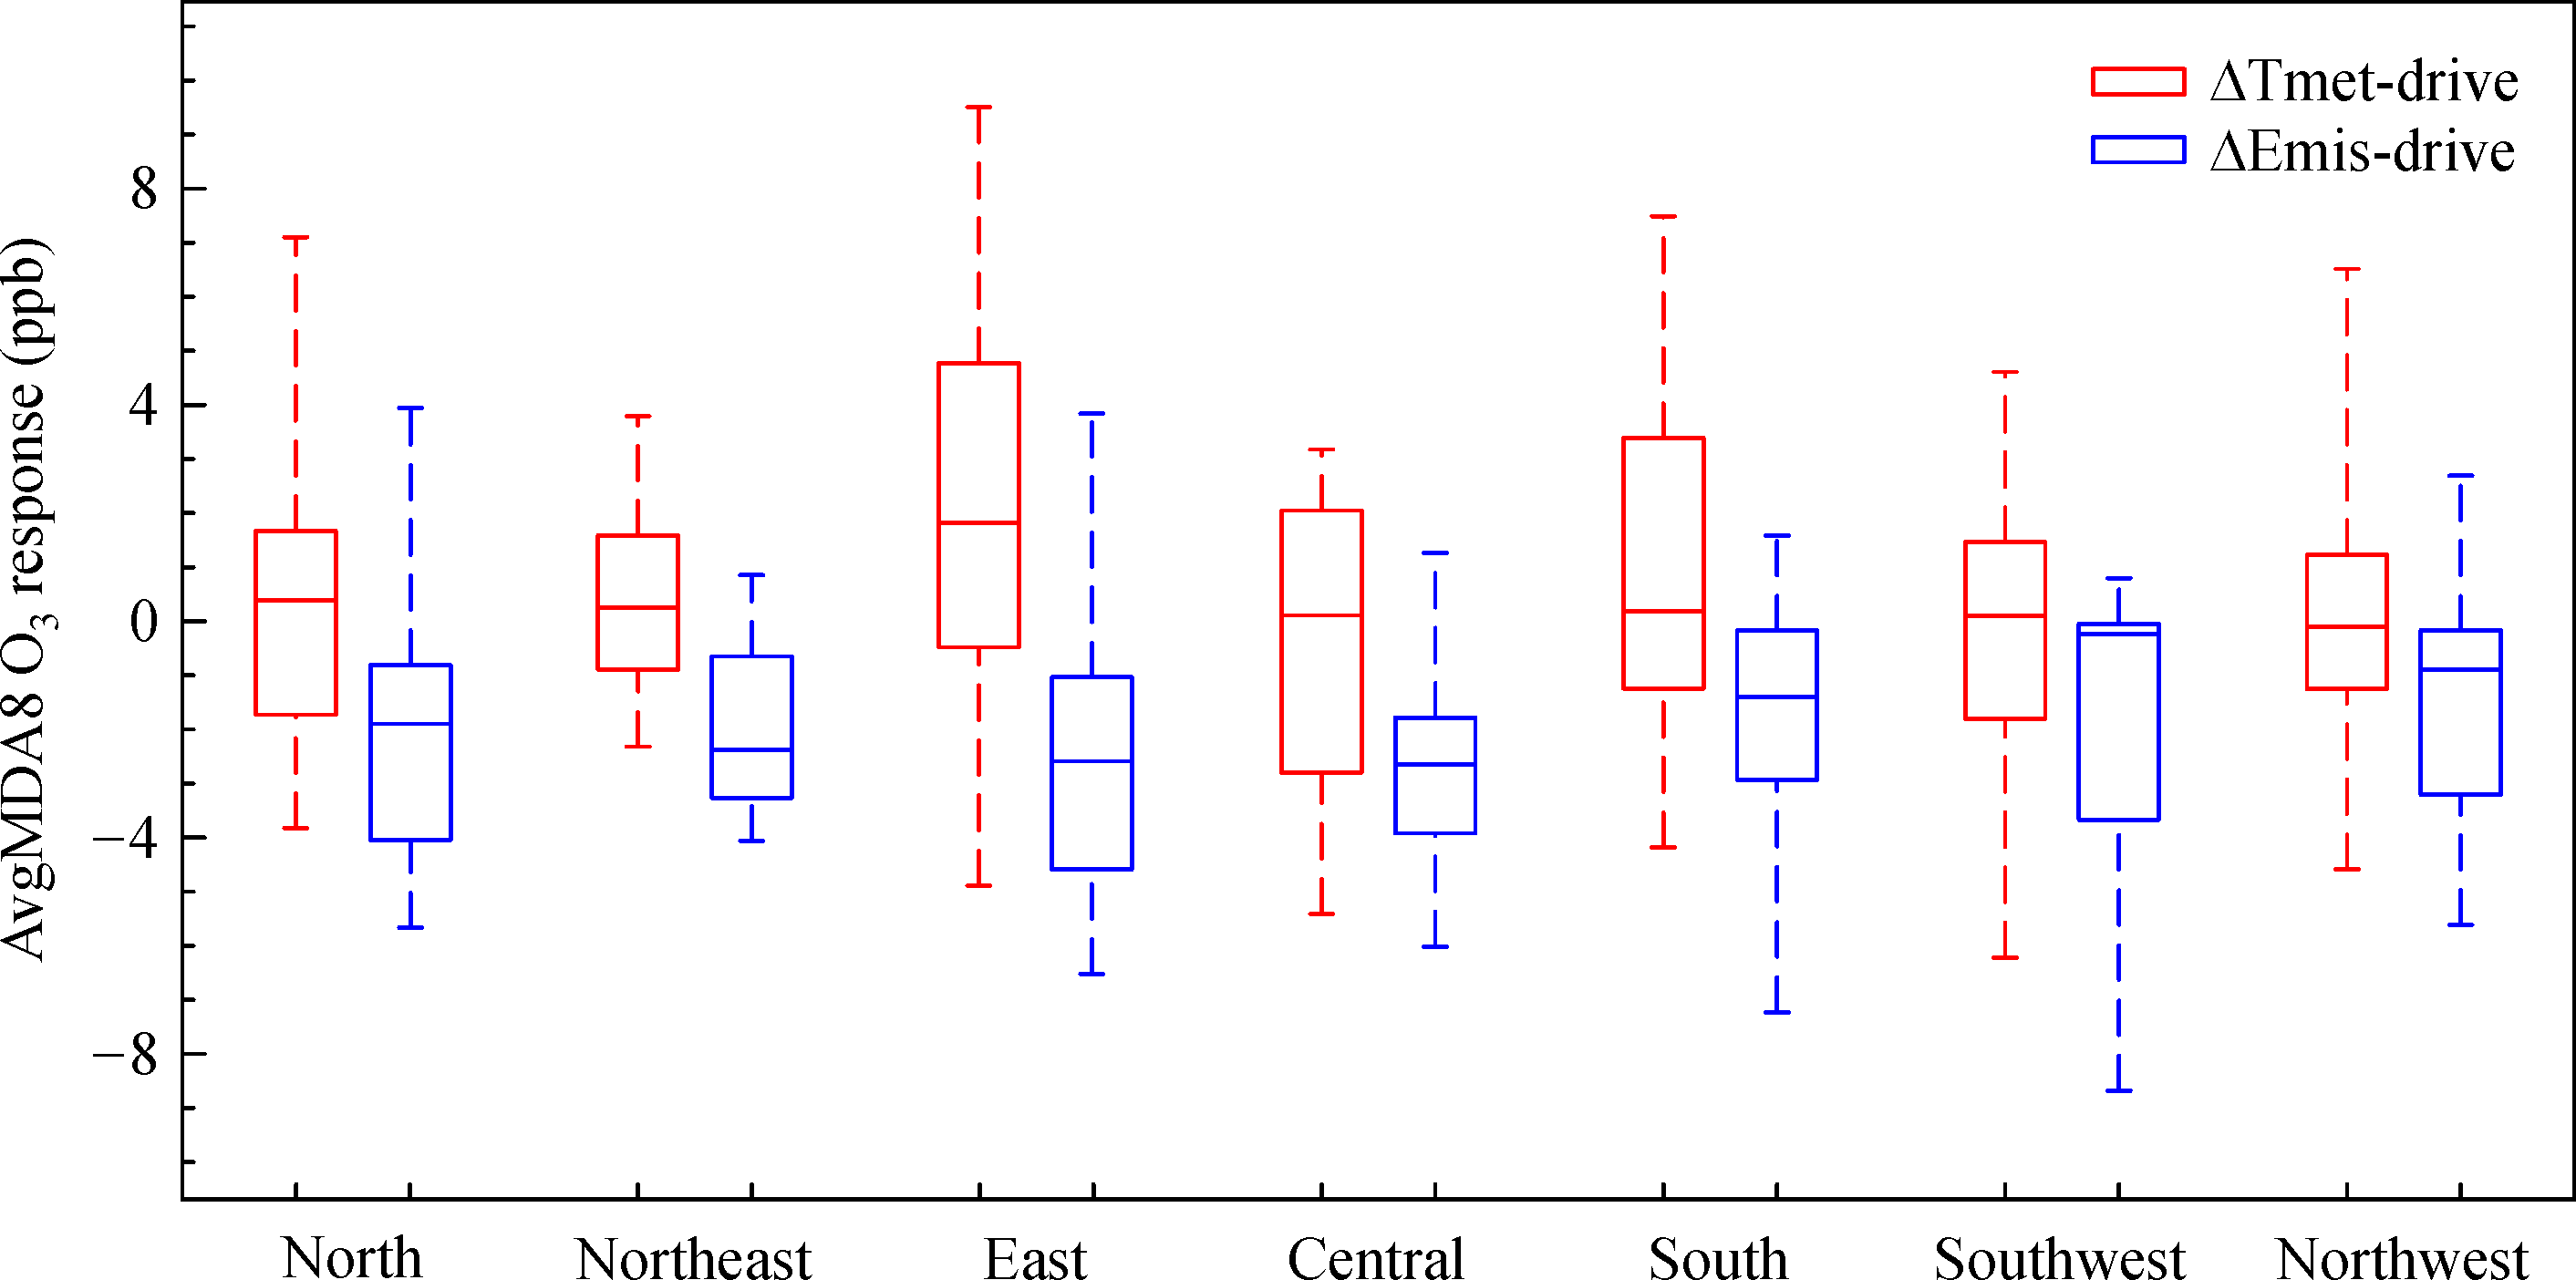
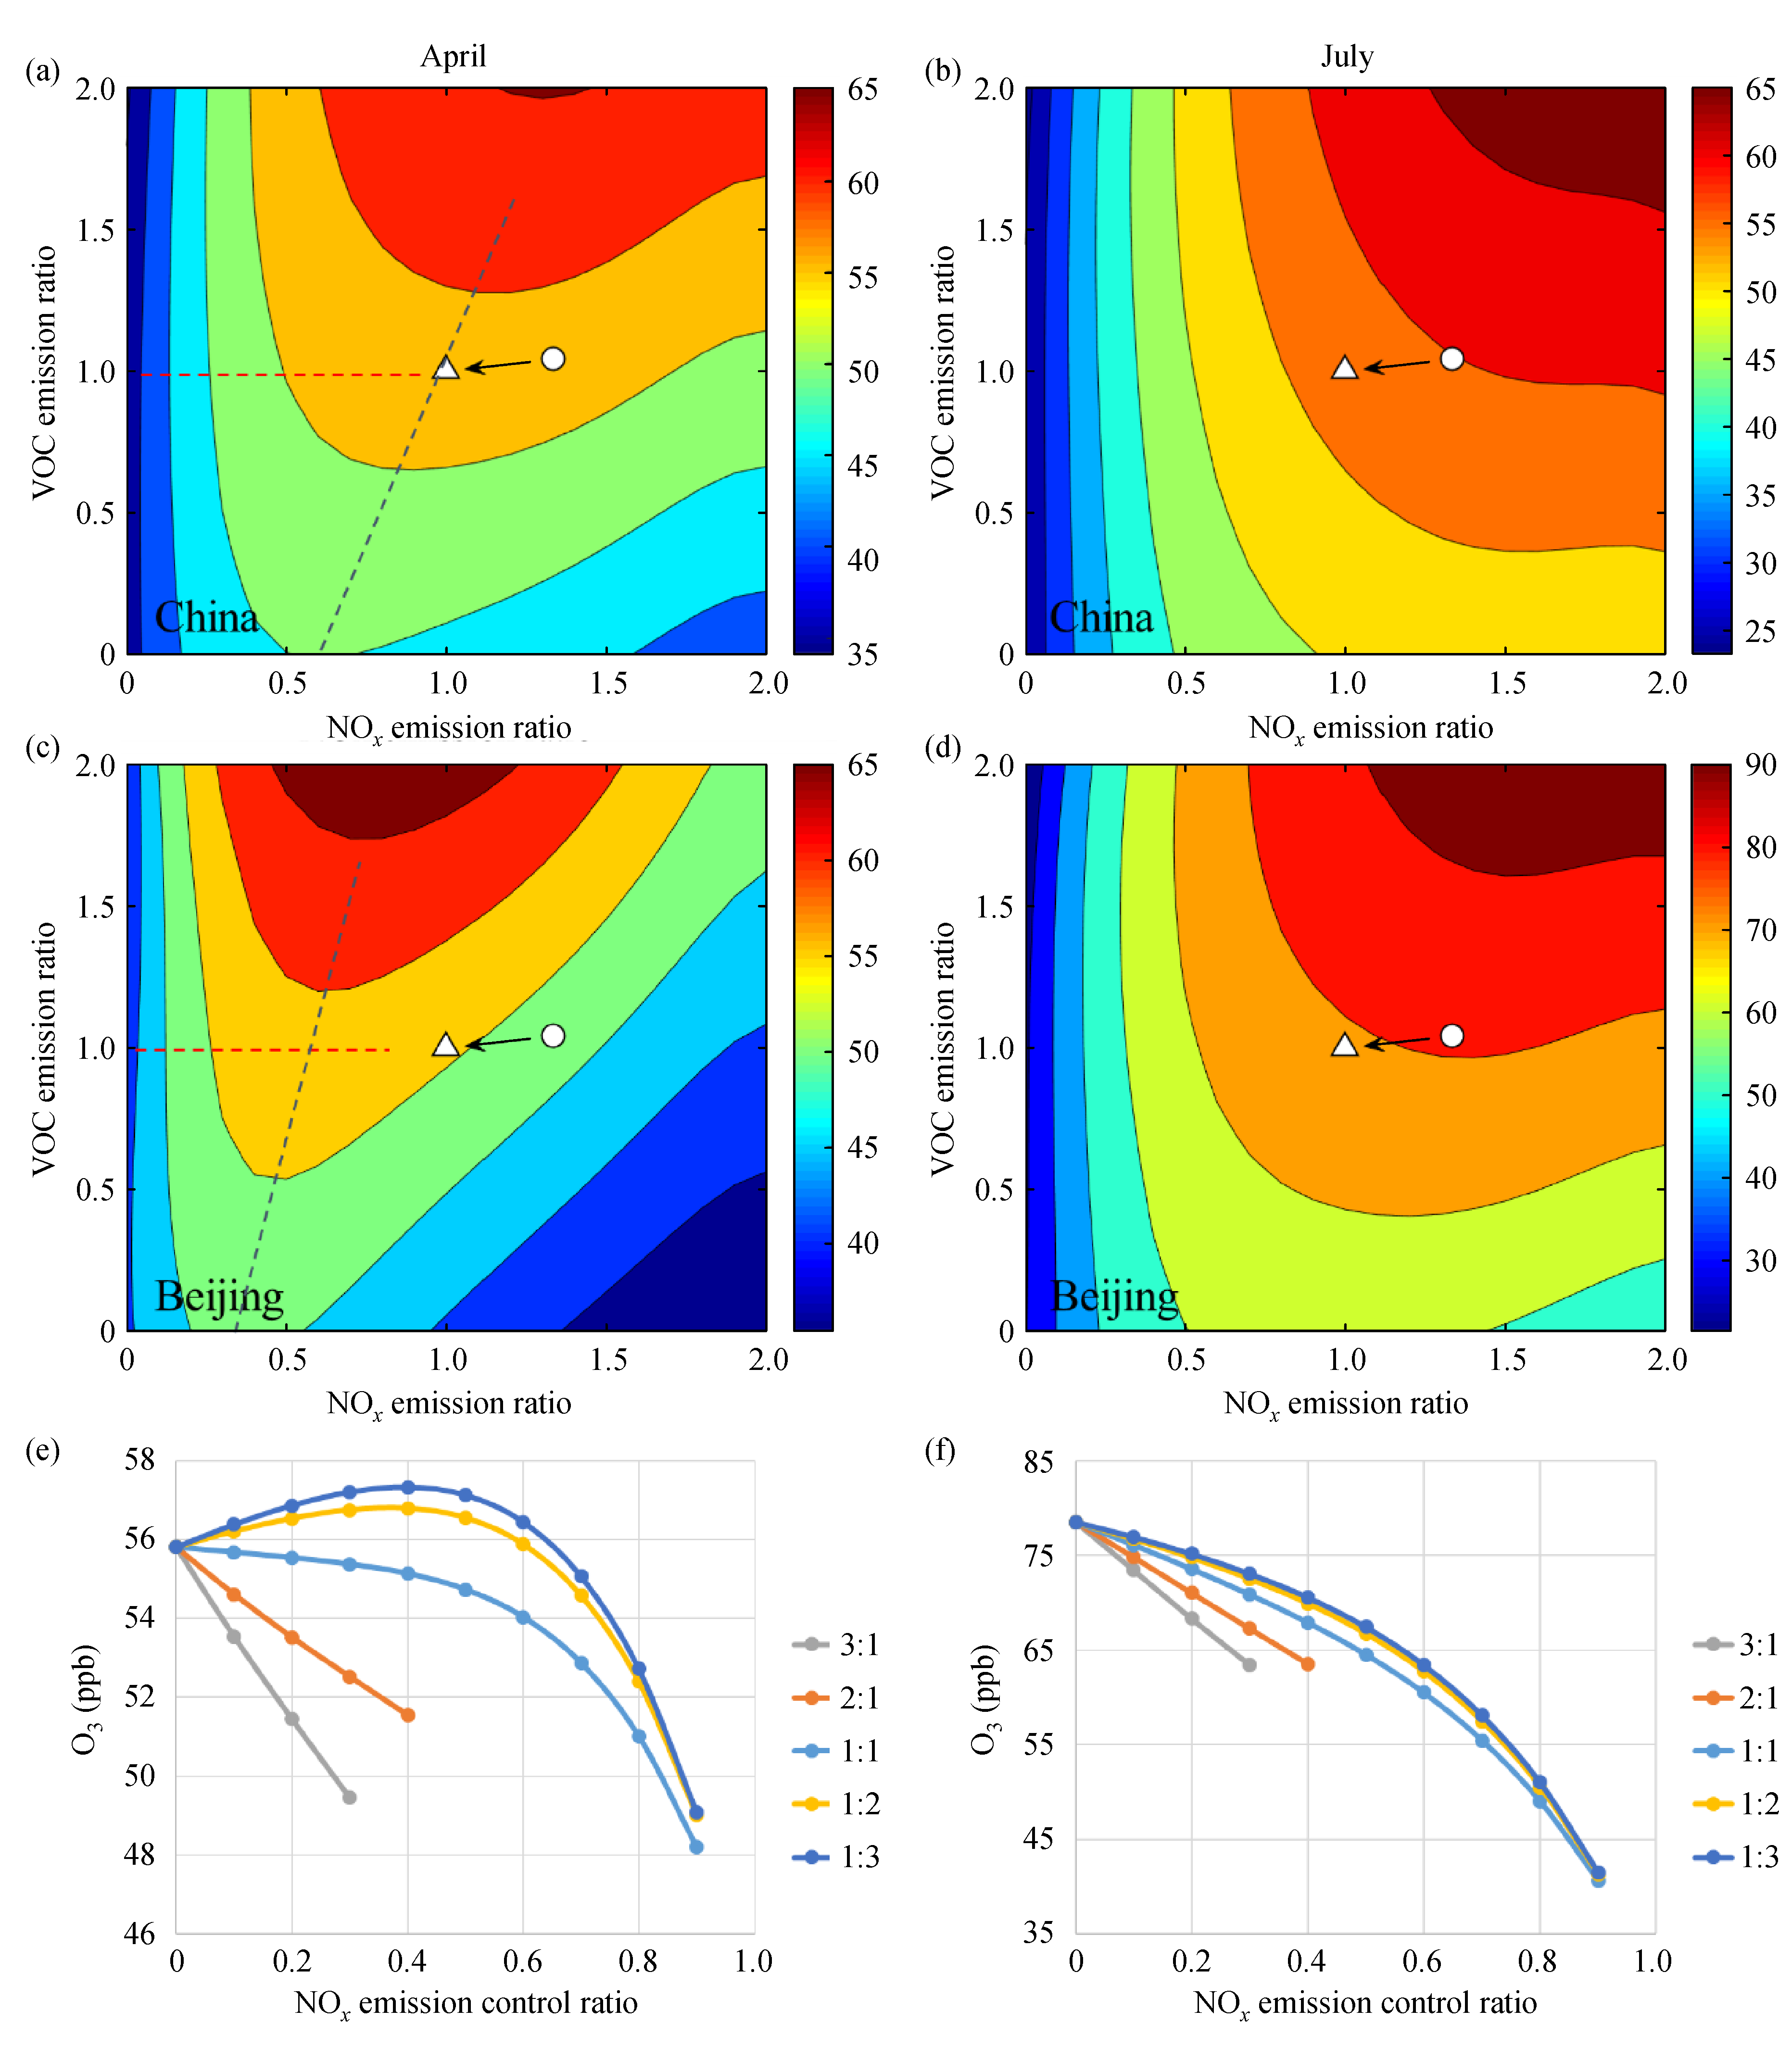
![]() We have quantified the impacts of anthropogenic emissions reductions caused by the Air Pollution Control Action Plan and changes in meteorological fields between 2013 and 2017 on the warm-season O3 concentration in China using a regional 3D chemical transport model. We found that the impact on daily maximum eight-hour (MDA8) O3 concentration by the meteorological variation that mostly increased O3 was greater than that from emission reduction, which decreased O3. Specifically, the control measures implemented since 2013 in China have reduced SO2, NOx, PM2.5, and VOC emissions by 33%, 25%, 30%, and 4% in 2017, while NH3 emissions have increased by 7%. The changes in anthropogenic emissions lowered MDA8 O3 by 0.4–3.7 ppb (0.8%–7.6%, varying by region and month), although MDA8 O3 was increased slightly in some urban areas (i.e. North China) at the beginning/end of warm seasons. Relative to 2013, the average 2 m temperature in 2017 shows increments in North, North-east, East, and South China (0.34℃–0.83℃) and decreases in Central China (0.24℃). The average solar radiation shows increments in North, North-east, and South China (7.0–9.7 w/m2) and decreases in Central, South-west, and North-west China (4.7–10.3 w/m2). The meteorological differences significantly change MDA8 O3 by -3.5–8.5 ppb (-8.2%–18.8%) with large temporal variations. The average MDA8 O3 was slightly increased in North, North-east, East, and South China. The response surface model suggests that the O3 formation regime transfers from NOx-saturated in April to NOx-limited in July on average in China.
|
| Keywords
O3 pollution
Meteorological influences
Emission reduction
NOx
VOC
|
|
Corresponding Author(s):
Jia Xing,Shuxiao Wang
|
|
Issue Date: 14 October 2019
|
|
| 1 |
A Anger, O Dessens, F Xi, T Barker, R Wu (2016). China’s air pollution reduction efforts may result in an increase in surface ozone levels in highly polluted areas. Ambio, 45(2): 254–265
https://doi.org/10.1007/s13280-015-0700-6
|
| 2 |
S Cai, Y Wang, B Zhao, S Wang, X Chang, J Hao (2017). The impact of the “Air Pollution Prevention and Control Action Plan” on PM2.5 concentrations in Jing-Jin-Ji region during 2012–2020. Science of the Total Environment, 580: 197–209
https://doi.org/10.1016/j.scitotenv.2016.11.188
|
| 3 |
China Ministry of Ecological Environment (2013). Beijing: China Ecological Environment Status Bulletin (in Chinese)
|
| 4 |
China Ministry of Ecological Environment (2017). Beijing: China Ecological Environment Status Bulletin (in Chinese)
|
| 5 |
D S Cohan, J W Boylan, A Marmur, M N Khan (2007). An integrated framework for multipollutant air quality management and its application in georgia. Environmental Management, 40(4): 545–554
https://doi.org/10.1007/s00267-006-0228-4
|
| 6 |
A J Ding, C B Fu, X Q Yang, J N Sun, L F Zheng, Y N Xie, E Herrmann, W Nie, T Petaja, V M Kerminen, M Kulmala (2013). Ozone and fine particle in the western Yangtze River Delta: An overview of 1 yr data at the SORPES station. Atmospheric Chemistry and Physics, 13(11): 5813–5830
https://doi.org/10.5194/acp-13-5813-2013
|
| 7 |
D Ding, J Xing, S X Wang, K Y Liu, J M Hao (2019). Estimated contributions of emissions controls, meteorological factors, population growth, and changes in baseline mortality to reductions in ambient PM2.5 and PM2.5-related mortality in China, 2013–2017. Environmental Health Perspectives, 127: 067009 doi:10.1289/EHP4157
|
| 8 |
J W He, Y X Wang, J M Hao, L L Shen, L Wang (2012). Variations of surface O3 in August at a rural site near Shanghai: Influences from the West Pacific subtropical high and anthropogenic emissions. Environmental Science and Pollution Research International, 19(9): 4016–4029
https://doi.org/10.1007/s11356-012-0970-5
|
| 9 |
J I Jeong, R J Park (2013). Effects of the meteorological variability on regional air quality in East Asia. Atmospheric Environment, 69: 46–55
https://doi.org/10.1016/j.atmosenv.2012.11.061
|
| 10 |
M Jerrett, R T Burnett, C A Pope III, K Ito, G Thurston, D Krewski, Y L Shi, E Calle, M Thun (2009). Long-Term ozone exposure and mortality. New England Journal of Medicine, 360(11): 1085–1095
https://doi.org/10.1056/NEJMoa0803894
|
| 11 |
S Lou, H Liao, Y Yang, Q Mu (2015). Simulation of the interannual variations of tropospheric ozone over China: Roles of variations in meteorological parameters and anthropogenic emissions. Atmospheric Environment, 122: 839–851
https://doi.org/10.1016/j.atmosenv.2015.08.081
|
| 12 |
H Lu, X Lyu, H Cheng, Z Ling, H Guo (2019). Overview on the spatial-temporal characteristics of the ozone formation regime in China. Environmental science. Processes & impacts, 21: 916–929
|
| 13 |
J M Mcgrath, A M Betzelberger, S W Wang, E Shook, X G Zhu, S P Long, E A Ainsworth (2015). An analysis of ozone damage to historical maize and soybean yields in the United States. Proceedings of the National Academy of Sciences of the United States of America, 112(46): 14390–14395
|
| 14 |
P J Reddy, G G Pfister (2016). Meteorological factors contributing to the interannual variability of midsummer surface ozone in Colorado, Utah, and other western US states. Journal of Geophysical Research, D, Atmospheres, 121(5): 2434–2456
https://doi.org/10.1002/2015JD023840
|
| 15 |
K M Seltzer, D T Shindell, C S Malley (2018). Measurement-based assessment of health burdens from long-term ozone exposure in the United States, Europe, and China. Environmental Research Letters, 13(10): 104018
https://doi.org/10.1088/1748-9326/aae29d
|
| 16 |
M Shao, S Lu, Y Liu, X Xie, C Chang, S Huang, Z Chen (2009a). Volatile organic compounds measured in summer in Beijing and their role in ground-level ozone formation. Journal of Geophysical Research, D, Atmospheres, 114(D2): D00G06
https://doi.org/10.1029/2008JD010863
|
| 17 |
M Shao, Y Zhang, L Zeng, X Tang, J Zhang, L Zhong, B Wang (2009b). Ground-level ozone in the Pearl River Delta and the roles of VOC and NOx in its production. Journal of Environmental Management, 90(1): 512–518
https://doi.org/10.1016/j.jenvman.2007.12.008
|
| 18 |
L Sun, L Xue, Y Wang, L Li, J Lin, R Ni, Y Yan, L Chen, J Li, Q Zhang, W Wang (2018). Impacts of meteorology and emissions on surface ozone increases over Central Eastern China between 2003 and 2015. Atmospheric Chemistry and Physics Discussion, 19(3): 1–28
https://doi.org/10.5194/acp-2018-723
|
| 19 |
Z Tan, K Lu, H Dong, M Hu, X Li, Y Liu, S Lu, M Shao, R Su, H Wang, Y Wu, A Wahner, Y Zhang (2018). Explicit diagnosis of the local ozone production rate and the ozone-NOx-VOC sensitivities. Science Bulletin, 63(16): 1067–1076
https://doi.org/10.1016/j.scib.2018.07.001
|
| 20 |
Z Tan, K Lu, M Jiang, R Su, H Wang, S Lou, Q Fu, C Zhai, Q Tan, D Yue, D Chen, Z Wang, S Xie, L Zeng, Y Zhang (2019). Daytime atmospheric oxidation capacity in four Chinese megacities during the photochemically polluted season: A case study based on box model simulation. Atmospheric Chemistry and Physics, 19(6): 3493–3513
https://doi.org/10.5194/acp-19-3493-2019
|
| 21 |
S X Wang, B Zhao, S Y Cai, Z Klimont, C P Nielsen, T Morikawa, J H Woo, Y Kim, X Fu, J Y Xu, J M Hao, K B He (2014). Emission trends and mitigation options for air pollutants in East Asia. Atmospheric Chemistry and Physics, 14(13): 6571–6603
https://doi.org/10.5194/acp-14-6571-2014
|
| 22 |
T Wang, L Xue, P Brimblecombe, Y F Lam, L Li, L Zhang (2017). Ozone pollution in China: A review of concentrations, meteorological influences, chemical precursors, and effects. Science of the Total Environment, 575: 1582–1596
https://doi.org/10.1016/j.scitotenv.2016.10.081
|
| 23 |
J Xing, D Ding, S Wang, Z Dong, J T Kelly, C Jang, Y Zhu, J Hao (2019). Development and application of observable response indicators for design of an effective ozone and fine particle pollution control strategy in China. Atmospheric Chemistry and Physics Discussion, 2019: 1–44
https://doi.org/10.5194/acp-2019-183
|
| 24 |
J Xing, D Ding, S Wang, B Zhao, C Jang, W Wu, F Zhang, Y Zhu, J Hao (2018). Quantification of the enhanced effectiveness of NOx control from simultaneous reductions of VOC and NH3 for reducing air pollution in the Beijing-Tianjin-Hebei region, China. Atmospheric Chemistry and Physics, 18(11): 7799–7814
https://doi.org/10.5194/acp-18-7799-2018
|
| 25 |
J Xing, S X Wang, C Jang, Y Zhu, J M Hao (2011). Nonlinear response of ozone to precursor emission changes in China: A modeling study using response surface methodology. Atmospheric Chemistry and Physics, 11(10): 5027–5044
https://doi.org/10.5194/acp-11-5027-2011
|
| 26 |
C Zhao, Y Wang, Q Yang, R Fu, D Cunnold, Y Choi (2010). Impact of East Asian summer monsoon on the air quality over China: View from space. Journal of Geophysical Research, D, Atmospheres, 115(D9): D09301
https://doi.org/10.1029/2009JD012745
|
| 27 |
B Zheng, D Tong, M Li, F Liu, C Hong, G Geng, H Li, X Li, L Peng, J Qi, L Yan, Y Zhang, H Zhao, Y Zheng, K He, Q Zhang (2018). Trends in China’s anthropogenic emissions since 2010 as the consequence of clean air actions. Atmospheric Chemistry and Physics, 18(19): 14095–14111
https://doi.org/10.5194/acp-18-14095-2018
|
|
Viewed |
|
|
|
Full text
|
|
|
|
|
Abstract
|
|
|
|
|
Cited |
|
|
|
|
| |
Shared |
|
|
|
|
| |
Discussed |
|
|
|
|