|
|
|
Seasonal variations of transport pathways and potential sources of PM2.5 in Chengdu, China (2012–2013) |
Yuan Chen1, Shaodong Xie2( ), Bin Luo3 ), Bin Luo3 |
1. School of Safety and Environmental Engineering, Capital University of Economics and Business, Beijing 100070, China
2. College of Environmental Sciences and Engineering, Peking University, Beijing 100871, China
3. Sichuan Provincial Environmental Monitoring Center, Chengdu 610041, China |
|
|
|
|
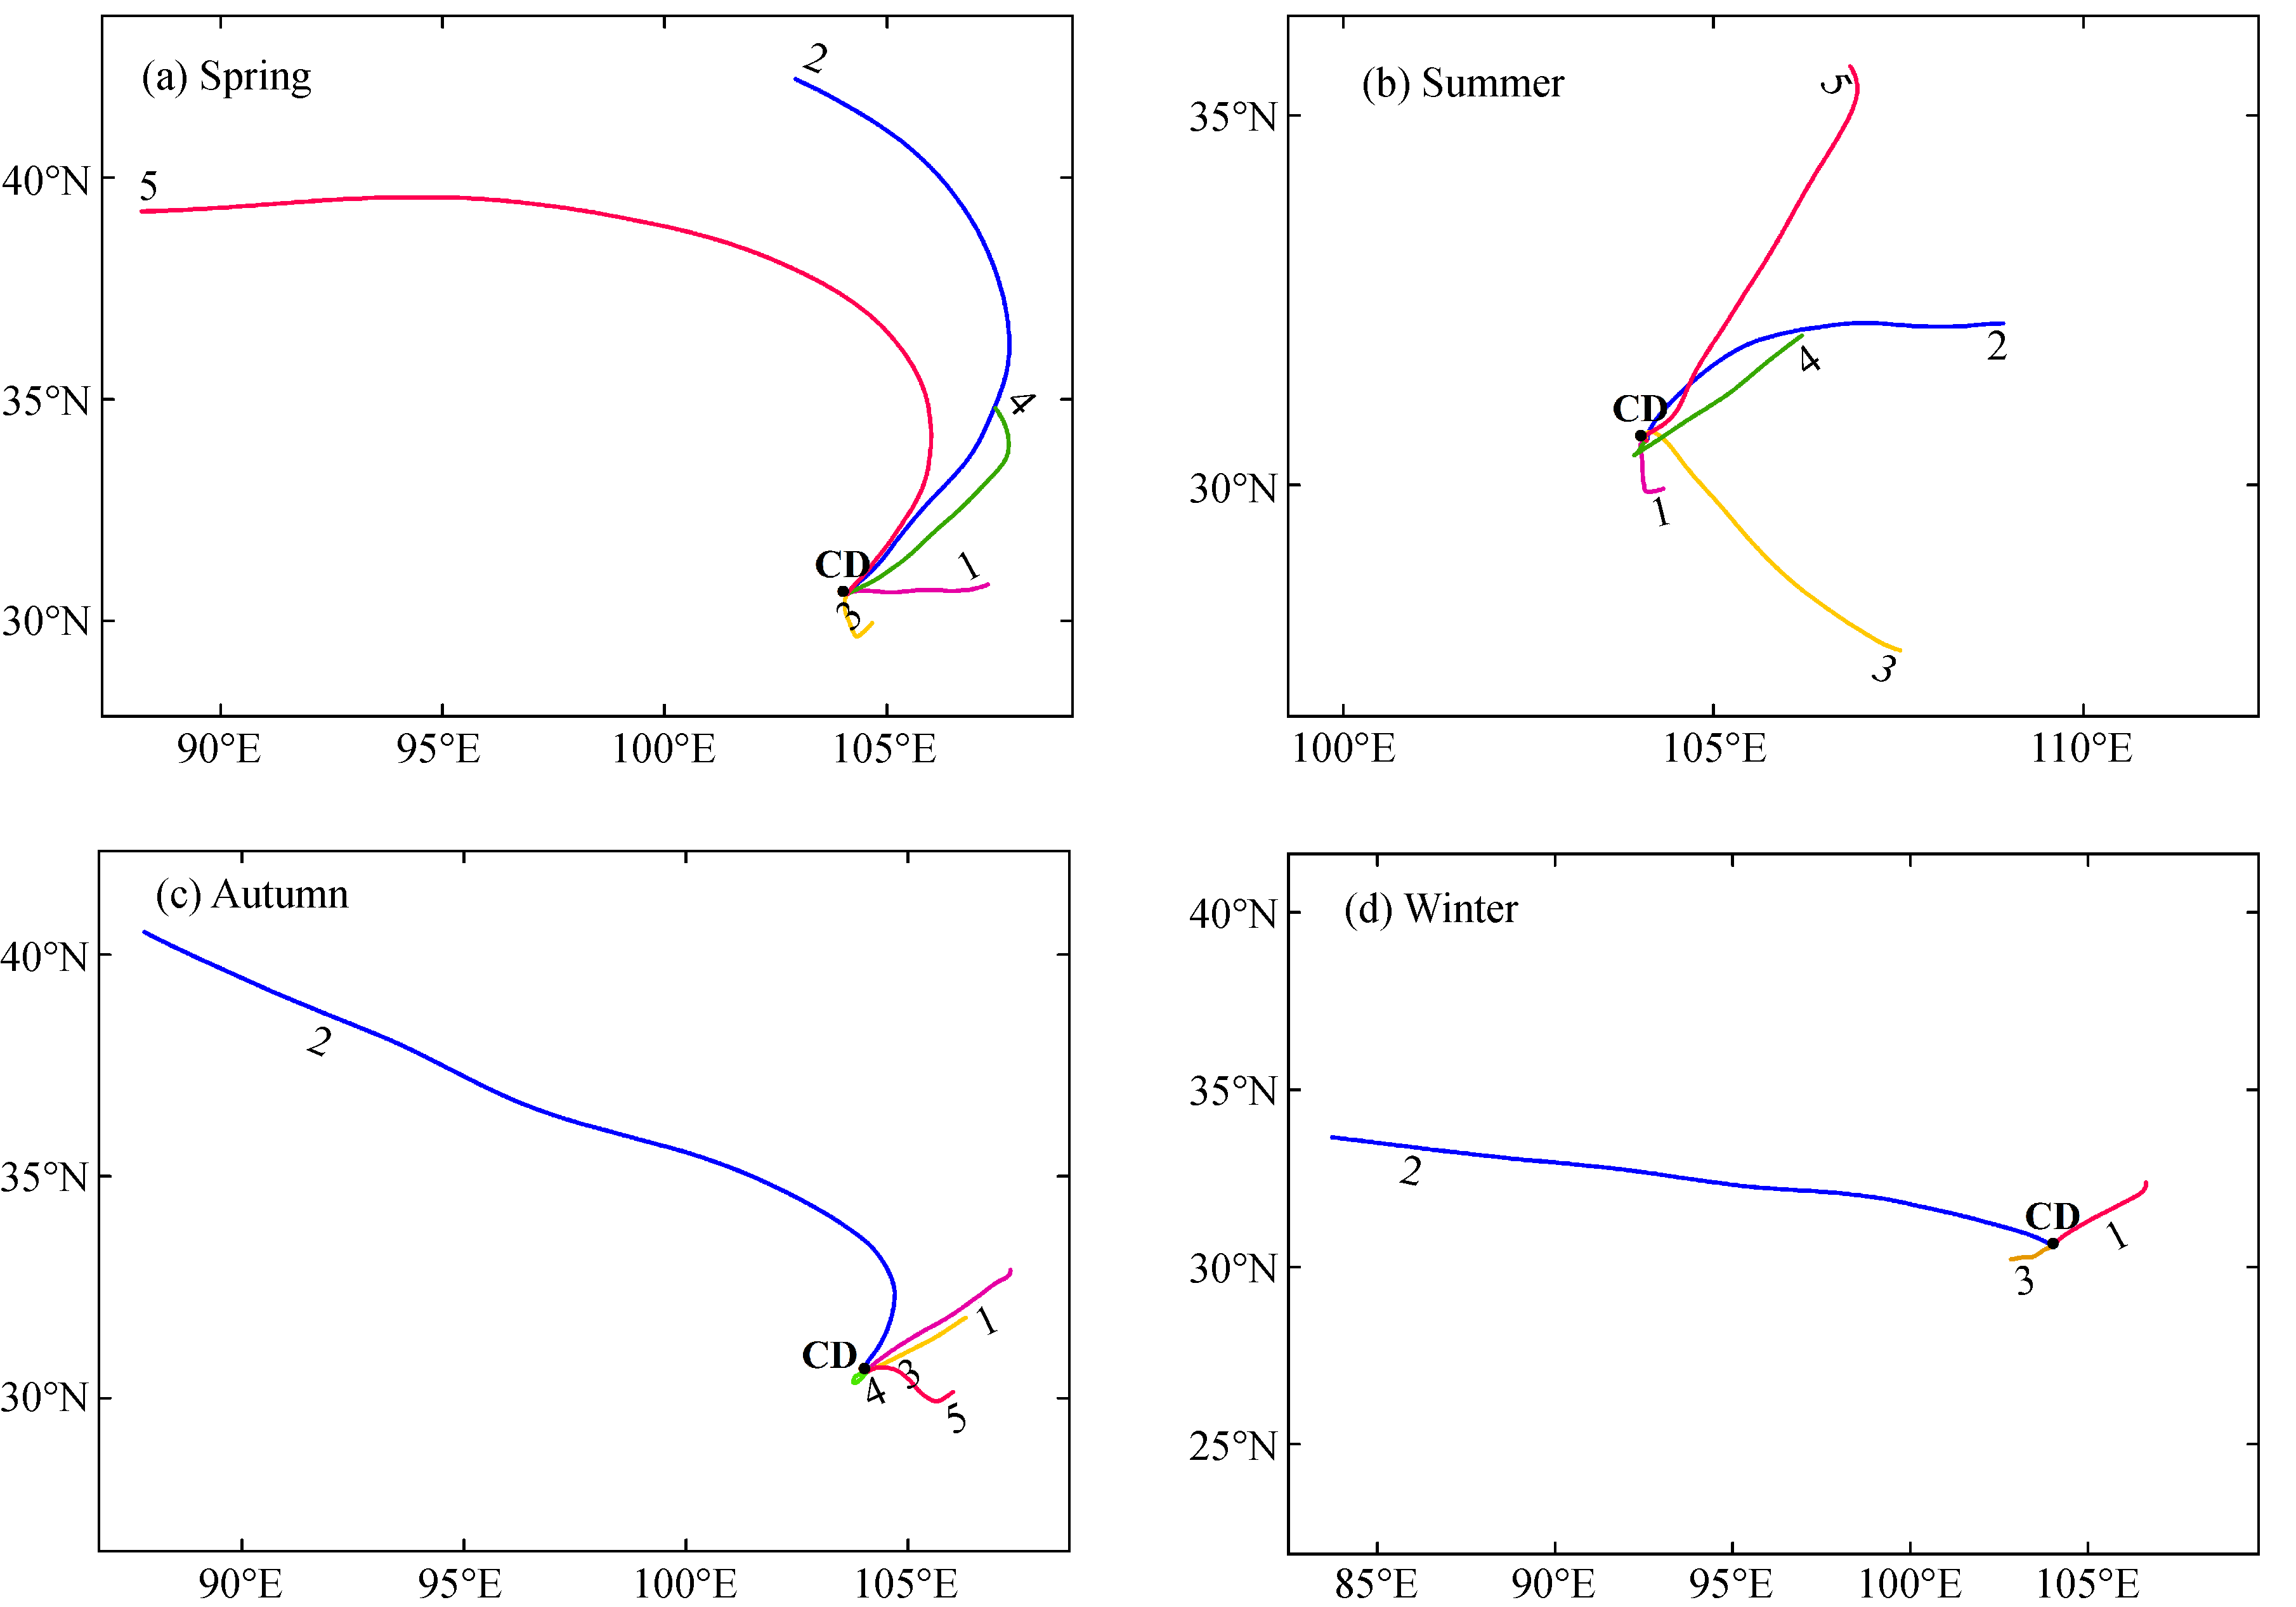
Abstract PM2.5 in Chengdu showed clear seasonal and diurnal variation. 5, 5, 5 and 3 mean clusters are generated in spring, summer, autumn, and winter. Short-distance air masses are important pathways in Chengdu. Emissions within the Sichuan Basin contribute significantly to PM2.5 pollution. Long-range transport from Southern Xinjiang is a dust invasion path to Chengdu.
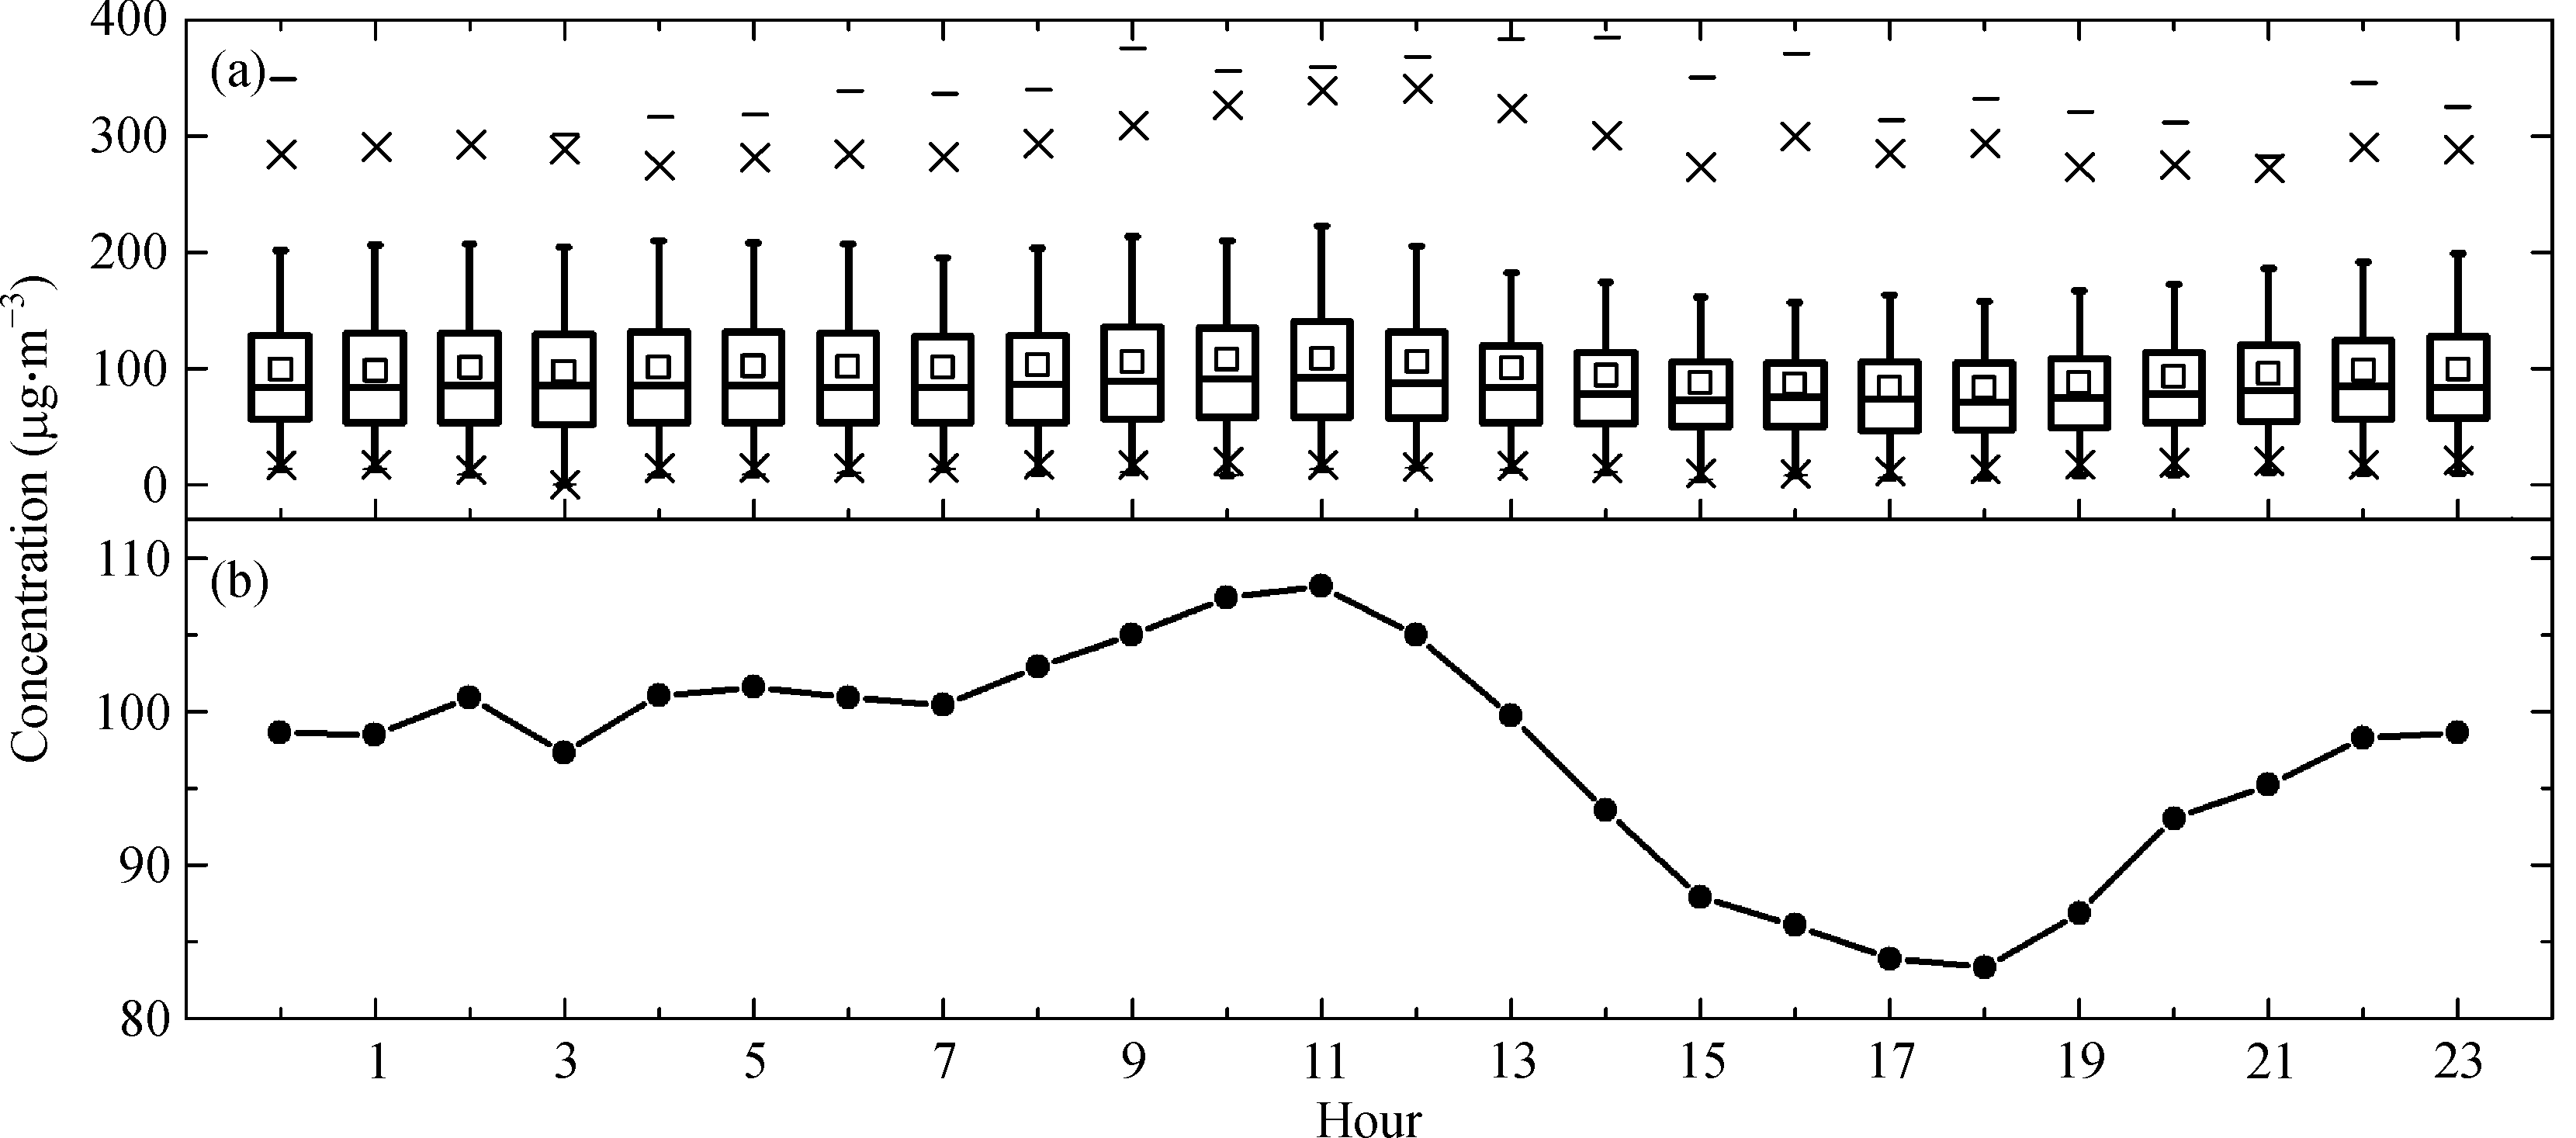
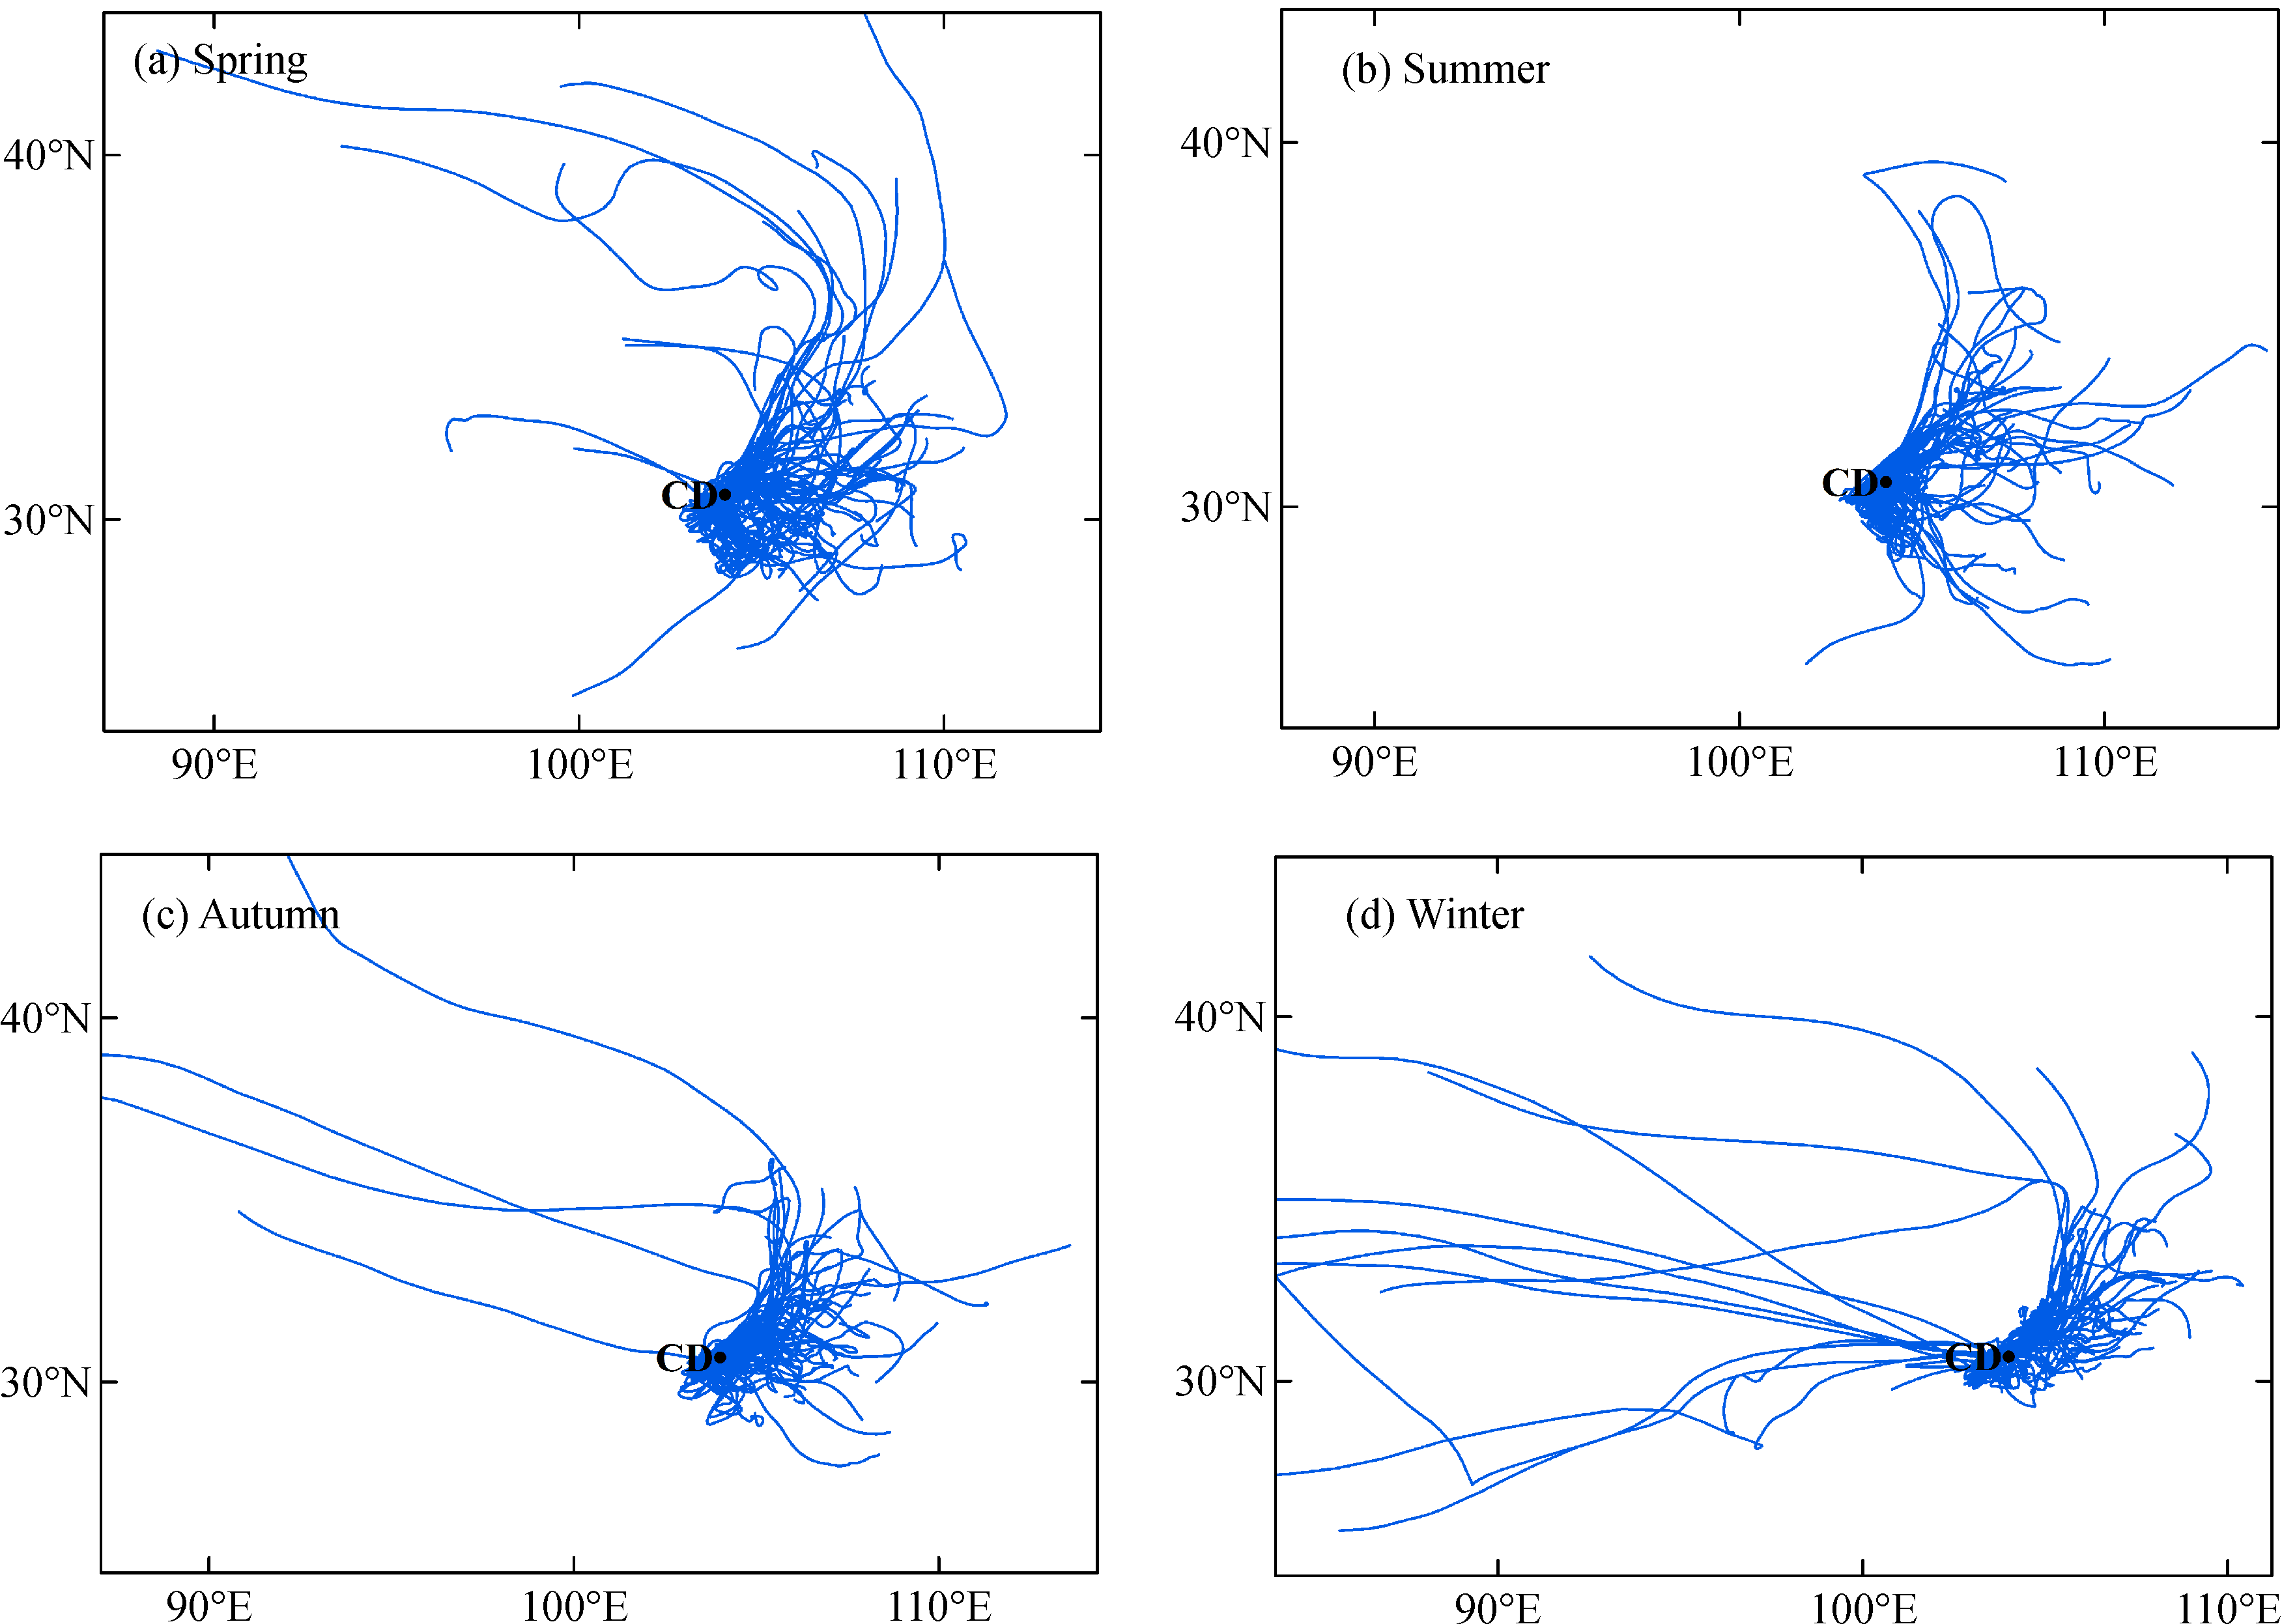
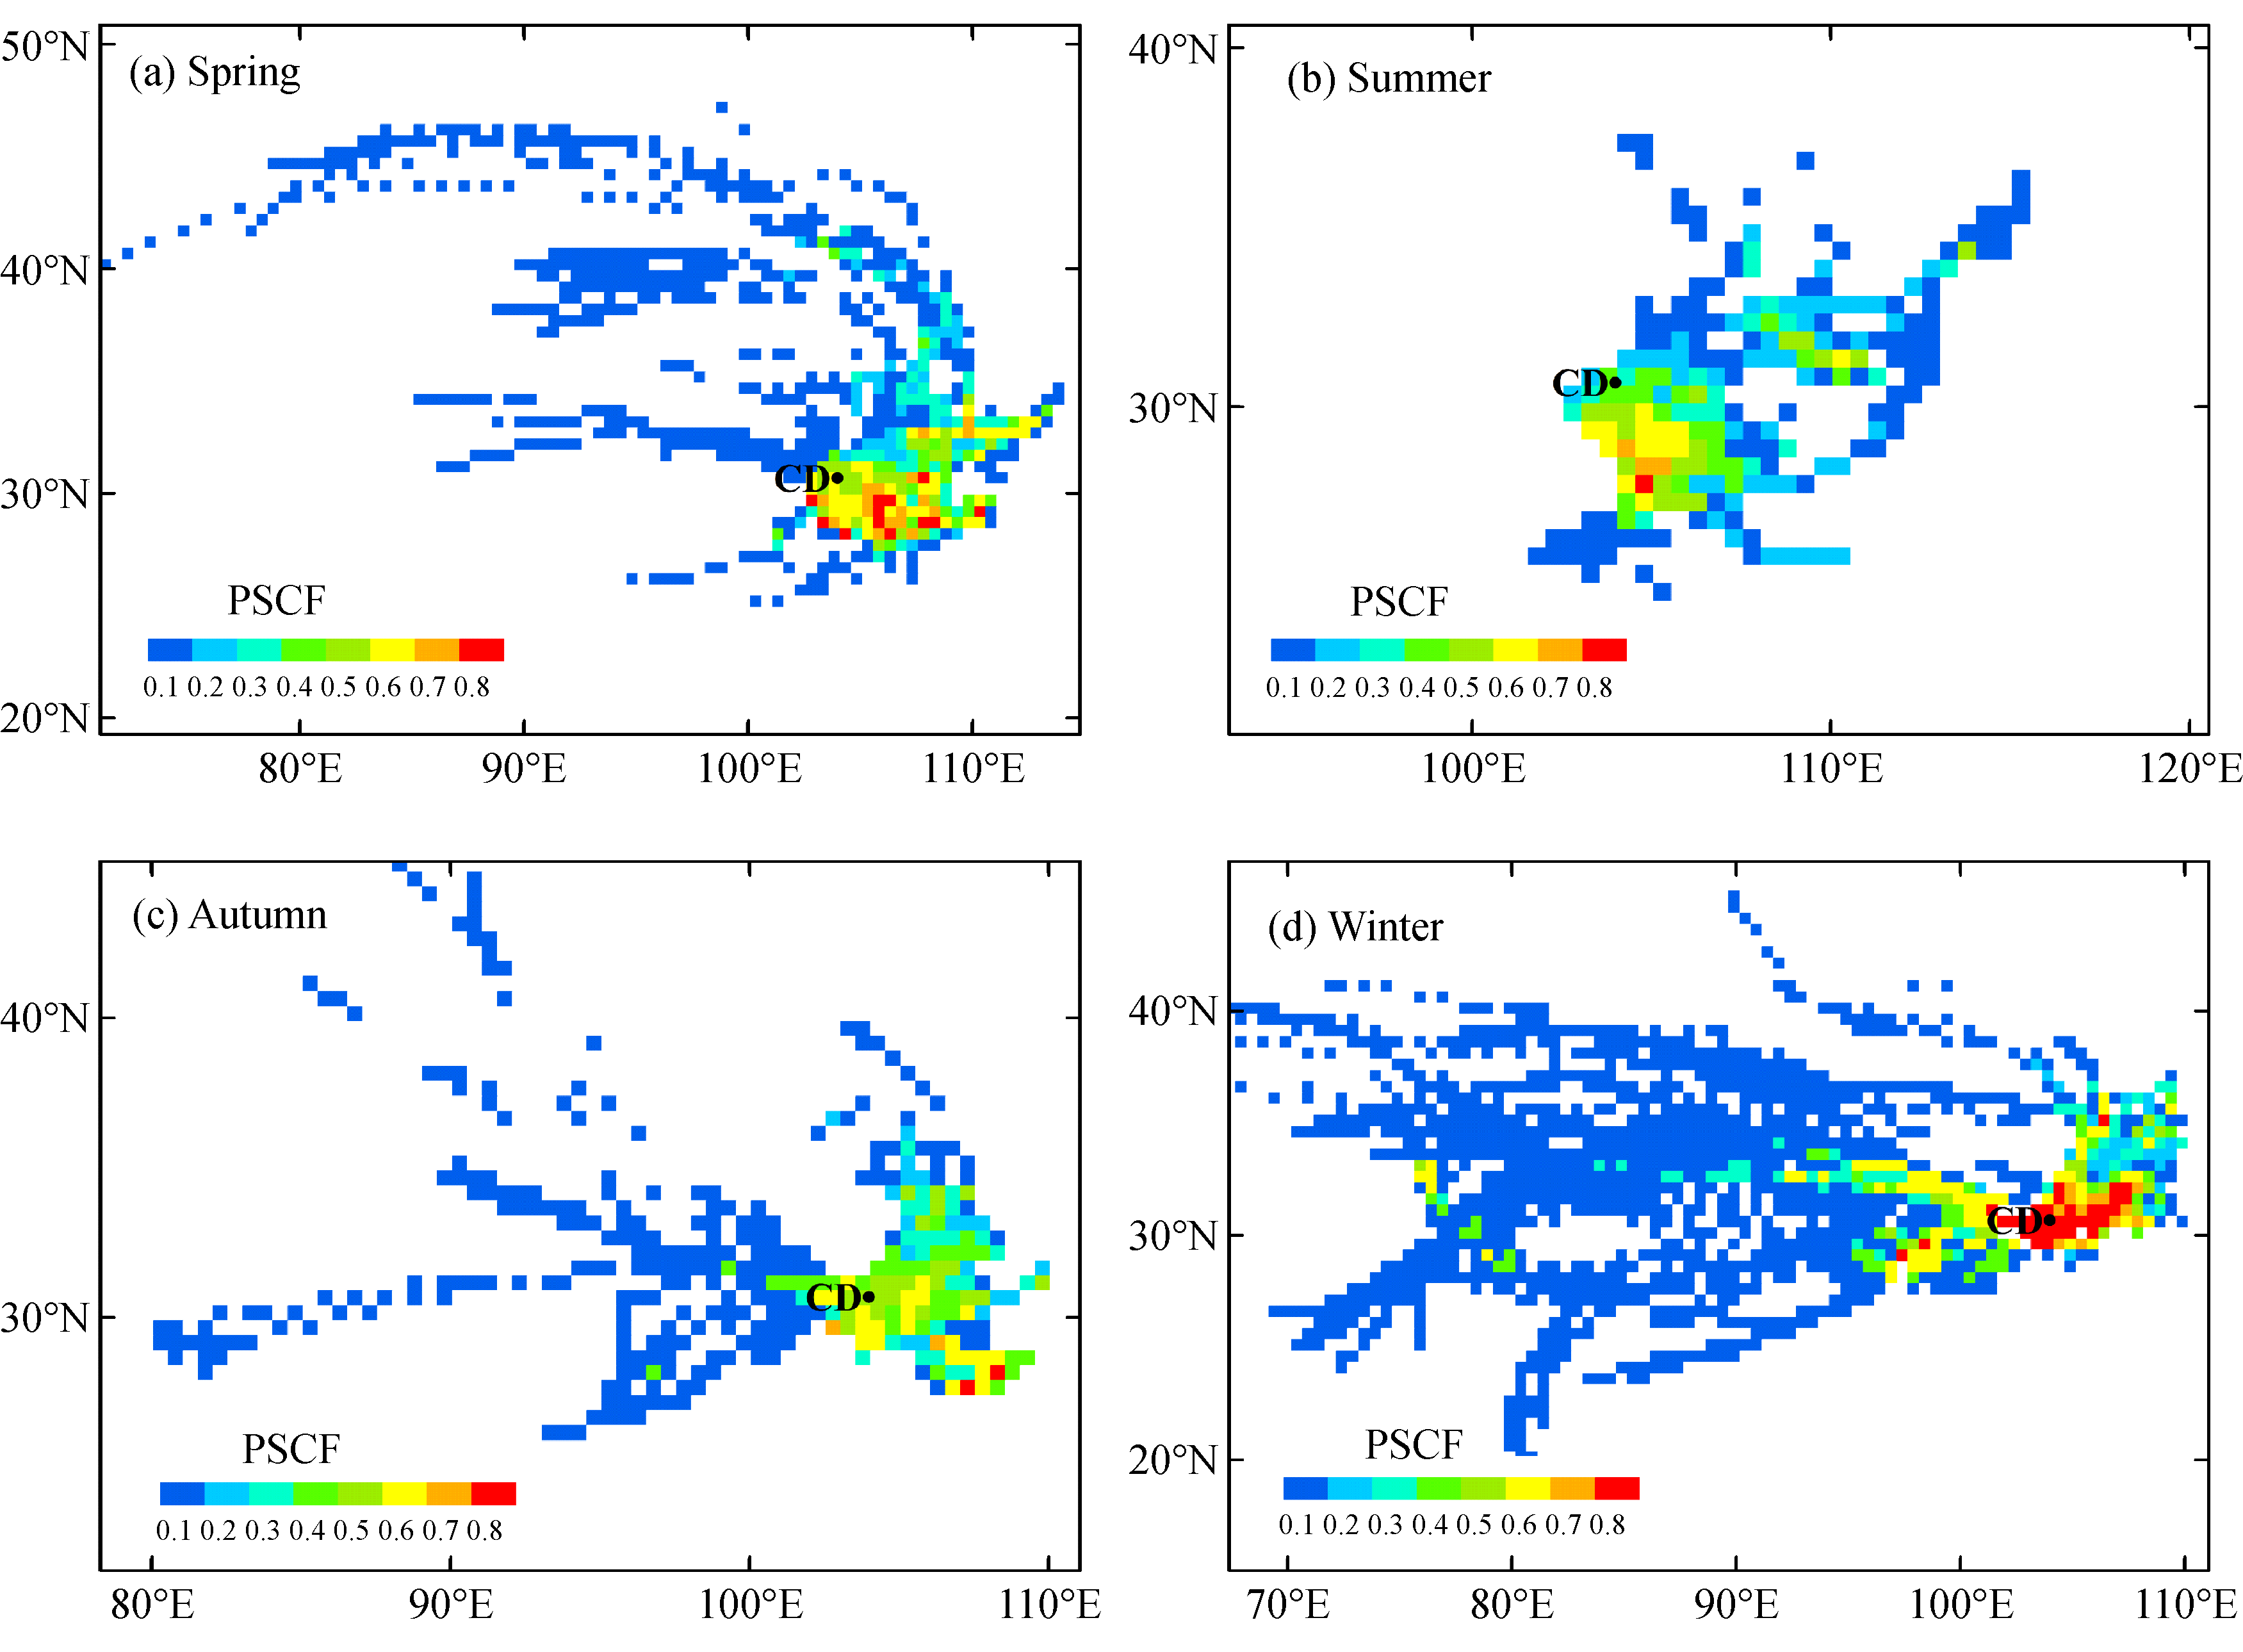
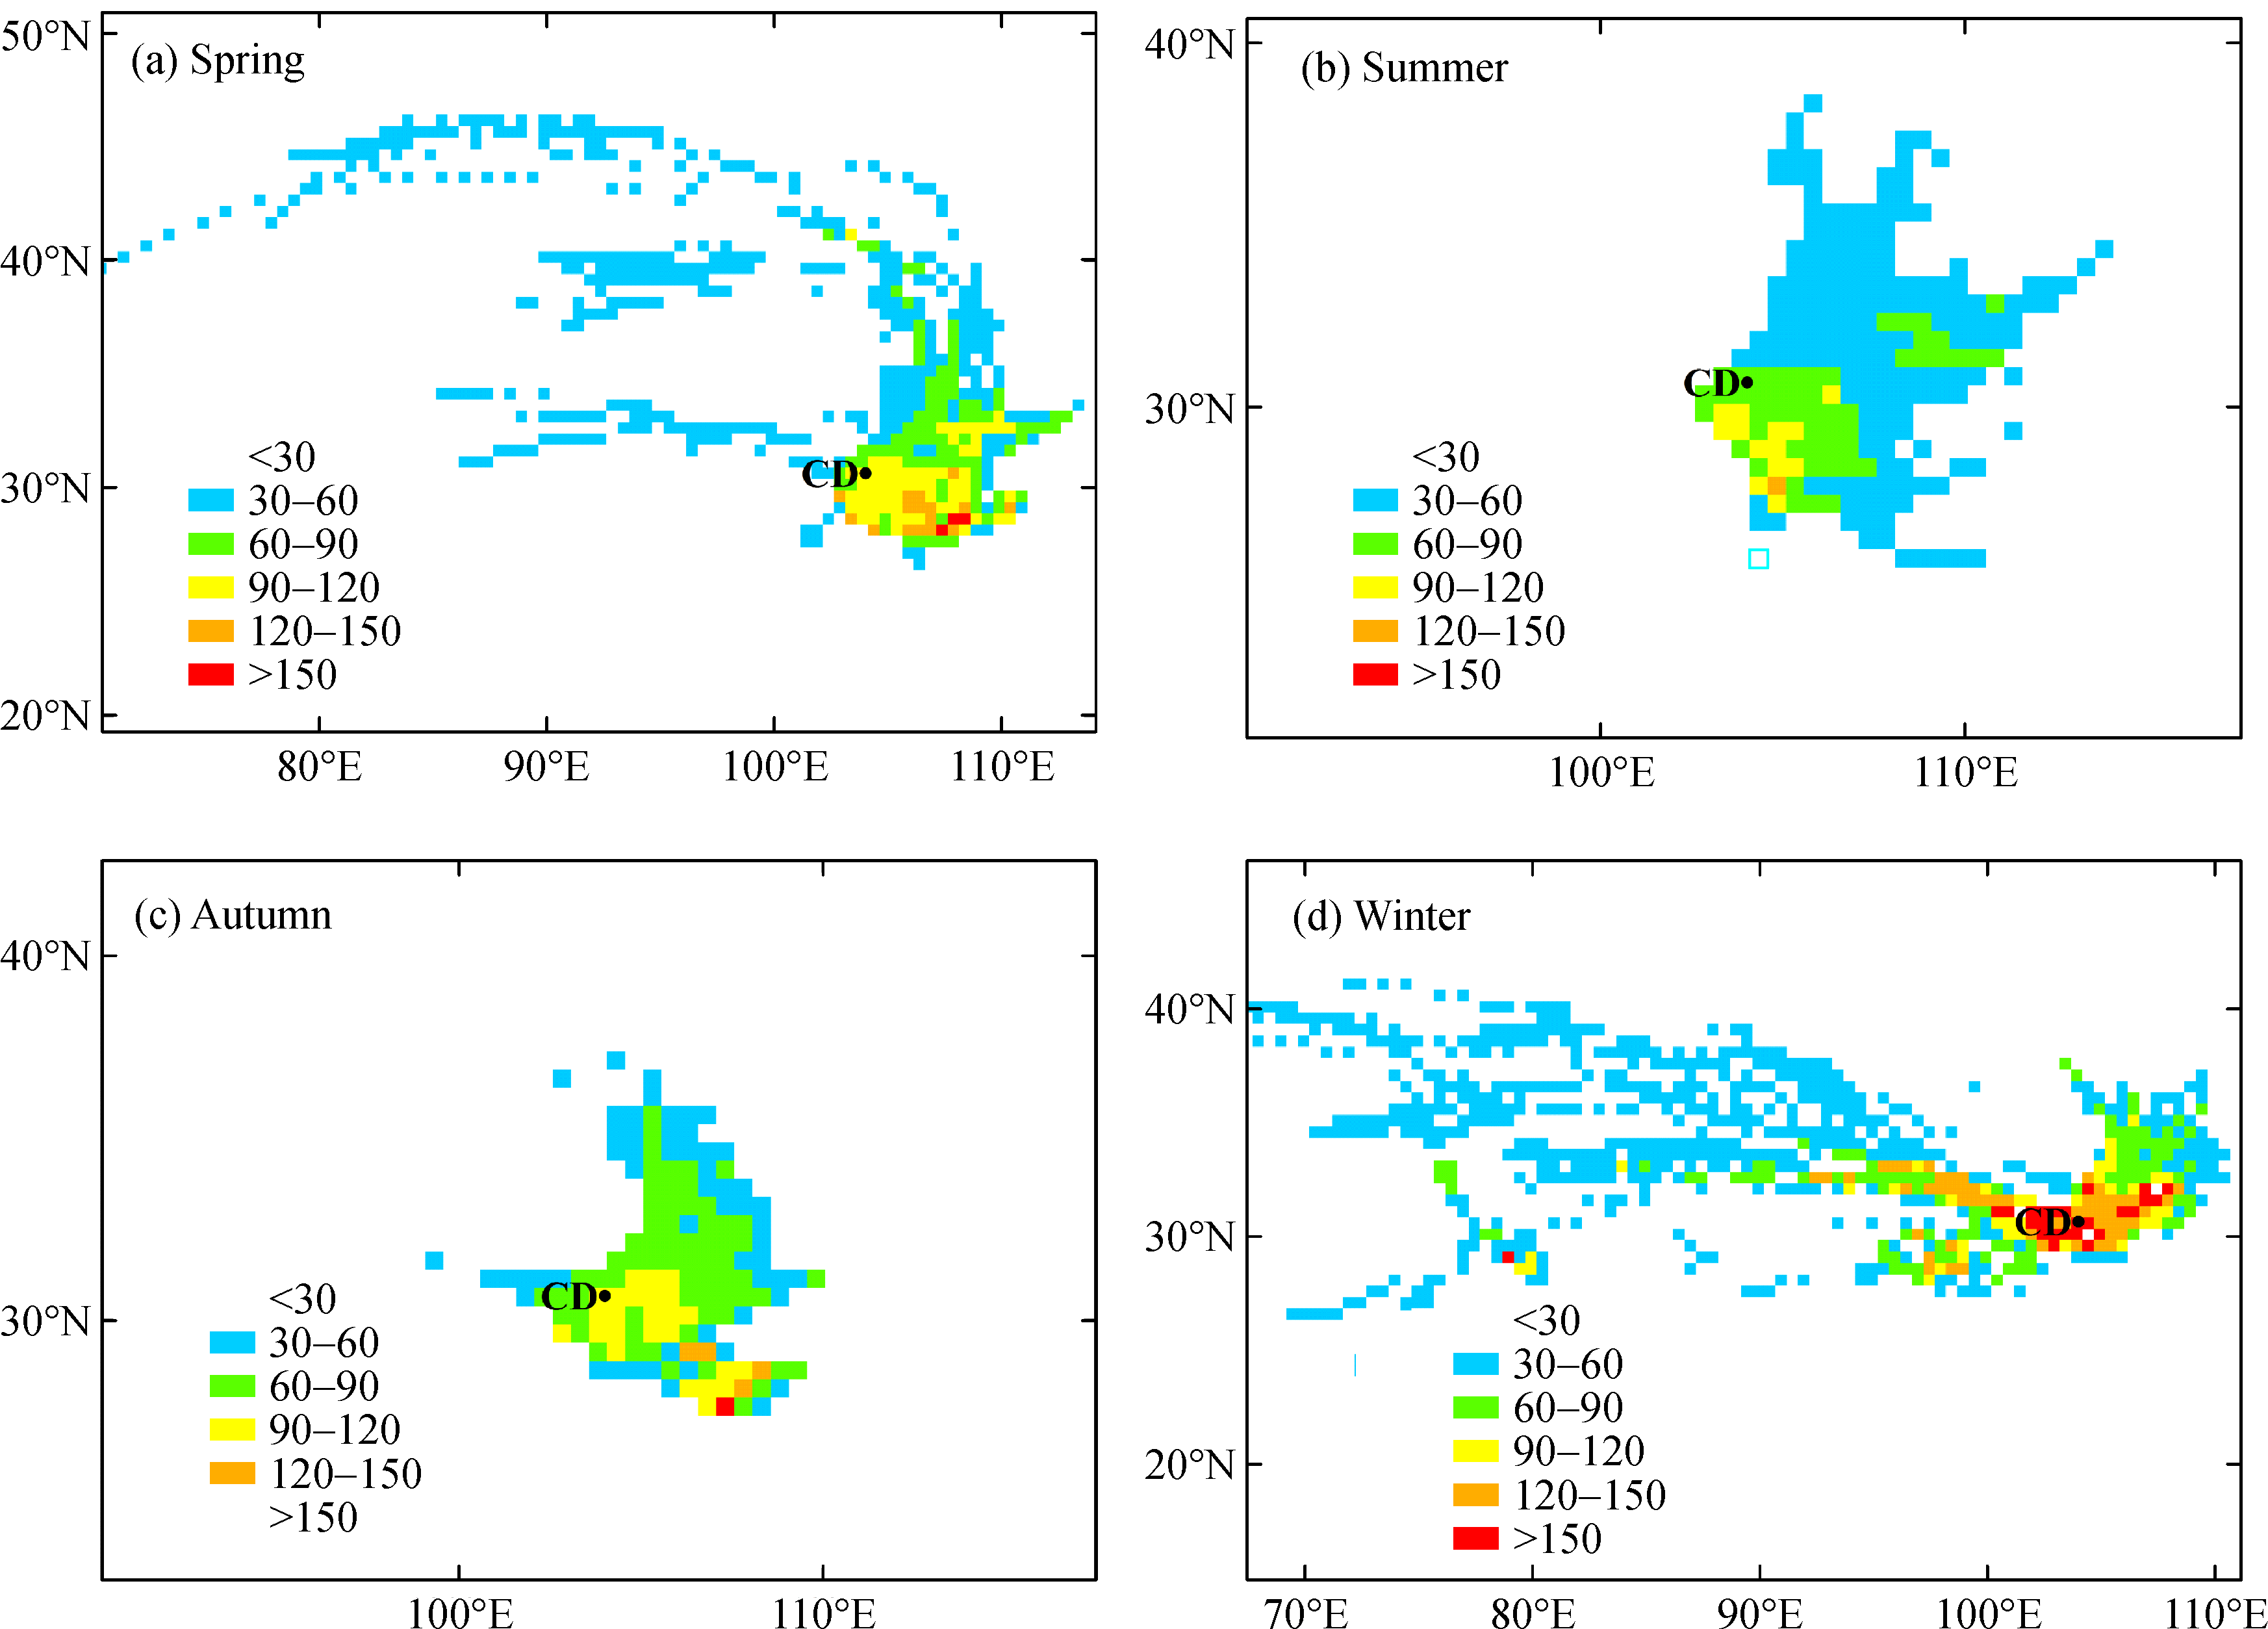
Seasonal pattern of transport pathways and potential sources of PM2.5 in Chengdu during 2012–2013 were investigated based on hourly PM2.5 data, backward trajectories, clustering analysis, potential source contribution function (PSCF), and concentration-weighted trajectory (CWT) method. The annual hourly mean PM2.5 concentration in Chengdu was 97.4 mg·m–3. 5, 5, 5 and 3 mean clusters were generated in four seasons, respectively. Short-distance air masses, which travelled within the Sichuan Basin with no specific source direction and relatively high PM2.5 loadings (>80 mg·m–3) appeared as important pathways in all seasons. These short pathways indicated that emissions from both local and surrounding regions of Chengdu contributed significantly to PM2.5 pollution. The cities in southern Chengdu were major potential sources with PSCF>0.6 and CWT>90 mg·m–3. The northeastern pathway prevailed throughout the year with higher frequency in autumn and winter and lower frequency in spring and summer. In spring, long-range transport from southern Xinjiang was a representative dust invasion path to Chengdu, and the CWT values along the path were 30-60 mg·m–3. Long-range transport was also observed in autumn from southeastern Xinjiang along a northwesterly pathway, and in winter from the Tibetan Plateau along a westerly pathway. In summer, the potential source regions of Chengdu were smaller than those in other seasons, and no long-range transport pathway was observed. Results of PSCF and CWT indicated that regions in Qinghai and Tibet contributed to PM2.5 pollution in Chengdu as well, and their CWT values increased to above 30 mg·m-3 in winter.
|
| Keywords
Transport pathway
Backward trajectory
Clustering analysis
Potential source
Chengdu
|
|
Corresponding Author(s):
Shaodong Xie
|
|
Issue Date: 26 December 2017
|
|
| 1 |
C K Chan, X Yao. Air pollution in mega cities in China. Atmospheric Environment, 2008, 42(1): 1–42
https://doi.org/10.1016/j.atmosenv.2007.09.003
|
| 2 |
Ministry of Environmental Protection. Environmental quality report of China, 2015.
|
| 3 |
J J Cao, Z X Shen, J C Chow, J G Watson, S C Lee, X X Tie, K F Ho, G H Wang, Y M Han. Winter and summer PM2.5 chemical compositions in fourteen Chinese cities. Journal of the Air & Waste Management Association, 2012, 62(10): 1214–1226
https://doi.org/10.1080/10962247.2012.701193
|
| 4 |
F Yang, J Tan, Q Zhao, Z Du, K He, Y Ma, F Duan, G Chen, Q Zhao. Characteristics of PM2.5 speciation in representative megacities and across China. Atmospheric Chemistry and Physics, 2011, 11(11): 5207–5219
https://doi.org/10.5194/acp-11-5207-2011
|
| 5 |
X Y Zhang, Y Q Wang, T Niu, X C Zhang, S L Gong, Y M Zhang, J Y Sun. Atmospheric aerosol compositions in China: Spatial/temporal variability, chemical signature, regional haze distribution and comparisons with global aerosols. Atmospheric Chemistry and Physics, 2012, 12(2): 779–799
https://doi.org/10.5194/acp-12-779-2012
|
| 6 |
R Zhang, J Jing, J Tao, S C Hsu, G Wang, J Cao, C S L Lee, L Zhu, Z Chen, Y Zhao, Z Shen. Chemical characterization and source apportionment of PM2.5 in Beijing: Seasonal perspective. Atmospheric Chemistry and Physics, 2013, 13(14): 7053–7074
https://doi.org/10.5194/acp-13-7053-2013
|
| 7 |
G S Hagler, M H Bergin, L G Salmon, J Z Yu, E C H Wan, M Zheng, L M Zeng, C S Kiang, Y H Zhang, A K H Lau, J J Schauer. Source areas and chemical composition of fine particulate matter in the Pearl River Delta region of China. Atmospheric Environment, 2006, 40(20): 3802–3815
https://doi.org/10.1016/j.atmosenv.2006.02.032
|
| 8 |
M Li, X Huang, L Zhu, J Li, Y Song, X Cai, S Xie. Analysis of the transport pathways and potential sources of PM10 in Shanghai based on three methods. Science of the Total Environment, 2012, 414(1): 525–534
https://doi.org/10.1016/j.scitotenv.2011.10.054
|
| 9 |
L Zhu, X Huang, H Shi, X Cai, Y Song. Transport pathways and potential sources of PM10 in Beijing. Atmospheric Environment, 2011, 45(3): 594–604
https://doi.org/10.1016/j.atmosenv.2010.10.040
|
| 10 |
Y Q Wang, X Y Zhang, R Arimoto, J J Cao, Z X Shen. The transport pathways and sources of PM10 pollution in Beijing during spring 2001, 2002 and 2003. Geophysical Research Letters, 2004, 31(14): 232–242
https://doi.org/10.1029/2004GL019732
|
| 11 |
M Luo, C Chen. Potential sources and transport pathways of PM2.5 in Shanghai, China. In: Proceedings of IEEE International Conference on Spatial Data Mining and Geographical Knowledge Services 2015, Fuzhou, Fujian, China, 2015, 104–107 doi: 10.1109/ICSDM.2015.7298034
|
| 12 |
L L Ashbaugh, W C Malm, W Z Sadeh. A residence time probability analysis of sulfur concentrations at Grand Canyon National Park. Atmospheric Environment, 1985, 19(8): 1263–1270
https://doi.org/10.1016/0004-6981(85)90256-2
|
| 13 |
P Seibert, H Kromp-Kolb, U Baltensperger, D T Jost, M Schwikowski, A Kasper, H Puxbaum. Trajectory analysis of aerosol measurements at high alpine sties. Transport and Transformation of Pollutants in the Troposphere. Den Haag: Academic Publishing, 1994
|
| 14 |
X Kong, W He, N Qin, Q He, B Yang, H Ouyang, Q Wang, F Xu. Comparison of transport pathways and potential sources of PM10 in two cities around a large Chinese lake using the modified trajectory analysis. Atmospheric Research, 2013, 122(3): 284–297
https://doi.org/10.1016/j.atmosres.2012.10.012
|
| 15 |
M Zhao, Z Huang, T Qiao, Y Zhang, G Xiu, J. YuChemical characterization, the transport pathways and potential sources of PM2.5 in Shanghai: Seasonal variations. Atmospheric Research, 2015, 158–159: 66–78 doi: 10.1016/j.atmosres.2015.02.003
|
| 16 |
Y Chen, S Xie, B Luo, C Zhai. Characteristics and origins of carbonaceous aerosol in the Sichuan Basin, China. Atmospheric Environment, 2014, 94(94): 215–223
https://doi.org/10.1016/j.atmosenv.2014.05.037
|
| 17 |
J Tao, L M Zhang, G Engling, R J Zhang, Y H Yang, J J Cao, C S Zhu, Q Y Wang, L Luo. Chemical composition of PM2.5 in an urban environment in Chengdu, China: Importance of springtime dust storms and biomass burning. Atmospheric Research, 2013, 122(3): 270–283
https://doi.org/10.1016/j.atmosres.2012.11.004
|
| 18 |
J Tao, J Gao, L Zhang, R Zhang, H Che, Z Zhang, Z Lin, J Jing, J Cao, S C Hsu. PM2.5 pollution in a megacity of southwest China: Source apportionment and implication. Atmospheric Chemistry and Physics, 2014, 14(16): 8679–8699
https://doi.org/10.5194/acp-14-8679-2014
|
| 19 |
Y Chen, S D Xie. Characteristics and formation mechanism of a heavy air pollution episode caused by biomass burning in Chengdu, Southwest China. Science of the Total Environment, 2014, 473–474(3): 507–517
https://doi.org/10.1016/j.scitotenv.2013.12.069
|
| 20 |
Y Chen, B Luo, S D Xie. Characteristics of the long-range transport dust events in Chengdu, Southwest China. Atmospheric Environment, 2015, 122: 713–722
https://doi.org/10.1016/j.atmosenv.2015.10.045
|
| 21 |
R R Draxler, G D Hess. An overview of the HYSPLIT_4 modelling system for trajectories. Australian Meteorological Magazine, 1998, 47(4): 295–308
|
| 22 |
Y Q Wang, X Y Zhang, R R Draxler. TrajStat: GIS-based software that uses various trajectory statistical analysis methods to identify potential sources from long-term air pollution measurement data. Environmental Modelling & Software, 2009, 24(8): 938–939
https://doi.org/10.1016/j.envsoft.2009.01.004
|
| 23 |
R Draxler, B Stunder, G Rolph, A Stein, A Taylor. HYSPLIT User’s Guide Version 4.9. United States: NOAA’s Air Resources Laboratory, 2009
|
| 24 |
J H Ward Jr. Hierarchical grouping to optimize an objective function. Journal of the American Statistical Association, 1963, 58(301): 236–244
https://doi.org/10.1080/01621459.1963.10500845
|
| 25 |
A Sirois, J W Bottenheim. Use of backward trajectories to interpret the 5‐year record of PAN and O3 ambient air concentrations at Kejimkujik National Park, Nova Scotia. Journal of Geophysical Research, D, Atmospheres, 1995, 100(D2): 2867–2882
https://doi.org/10.1029/94JD02951
|
| 26 |
A V Polissar, P K Hopke, P Paatero, Y J Kaufmann, D K Hall, B A Bodhaine, E G Dutton, J M Harris. The aerosol at Barrow, Alaska: Long-term trends and source locations. Atmospheric Environment, 1999, 33(16): 2441–2458
https://doi.org/10.1016/S1352-2310(98)00423-3
|
| 27 |
Q Y Wang, J J Cao, Z X Shen, J Tao, S Xiao, L Luo, Q Y He, X Y Tang. Chemical characteristics of PM2.5 during dust storms and air pollution events in Chengdu, China. Particuology, 2013, 11(1): 70–77
https://doi.org/10.1016/j.partic.2012.08.001
|
| 28 |
B J Ke. Research of an air pollutant emission inventory for Sichuan. Thesis for the Master Degree. Chengdu: Southwest Jiaotong University, 2011
|
|
Viewed |
|
|
|
Full text
|
|
|
|
|
Abstract
|
|
|
|
|
Cited |
|
|
|
|
| |
Shared |
|
|
|
|
| |
Discussed |
|
|
|
|