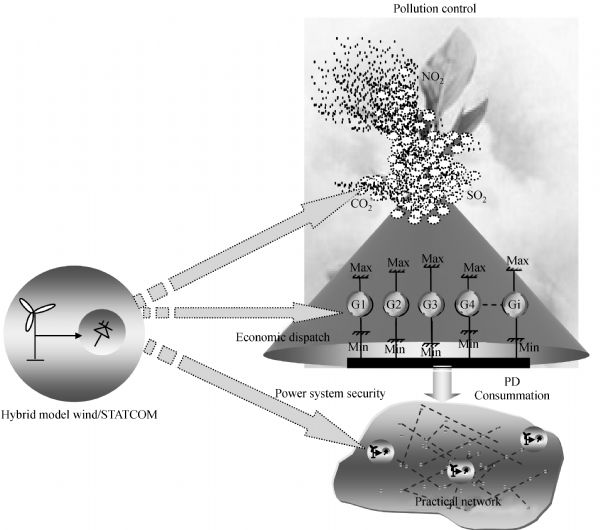
In this paper, a simple strategy based differential evolution was proposed for solving the problem of multi-objective environmental optimal power flow considering a hybrid model (Wind-Shunt-FACTS). The DE algorithm optimized simultaneously a combined vector control based active power of wind sources and reactive power of multi STATCOM exchanged with the electrical power system to minimize fuel cost and emissions. The proposed strategy was examined and applied to the standard IEEE 30-bus with smooth cost function to solve the problem of security environmental economic dispatch considering multi distributed hybrid model based wind and STATCOM controllers. In addition, the proposed approach was validated on a large practical electrical power system 40 generating units considering valve point effect. Simulation results demonstrate that choosing the installation of multi type of FACTS devices in coordination with many distributed wind sources is a vital research area.
. Solving multi-objective optimal power flow problem considering wind-STATCOM using differential evolution[J]. Frontiers in Energy, 0, (): 75-89.
Belkacem MAHDAD, K. SRAIRI. Solving multi-objective optimal power flow problem considering wind-STATCOM using differential evolution. Front Energ, 0, (): 75-89.
Combined minimum fuel cost & minimumβ emission
Minimum emissionβ
Pg1/MW
40
200
177.3000
133.1000
63.9600
Pg2/MW
20
80
48.7500
57.1200
67.7600
Pg5/MW
15
50
21.3600
24.0600
50.0000
Pg8/MW
10
35
21.0200
35.0000
35.0000
Pg11/MW
10
30
11.8500
20.0100
30.0000
Pg13/MW
12
40
12.0000
20.4300
40.0000
Generation cost/($·h-1)
799.9208
815.6620
944.9071
Emission/(t·h-1)
0.3668
0.2719
0.2049
Total cost/($·h-1)
1001.9
965.3865
1057.7
Power loss/MW
8.876
6.321
3.319
Tab.1
Fig.7
Minimum fuel cost
Combined minimum fuel cost & minimumβ emission
Minimum Emission
FGA [31]
DE
FGA [31]
DE
FGA [31]
DE
Generation cost/($·h-1)
802.8856
799.9208
822.7461
815.6620
905.2959
944.9071
Emission/(t·h-1)
0.3645
0.3668
0.2662
0.2719
0.2265
0.2049
Total cost/($·h-1)
1003.60
1001.9
969.3318
965.3865
1030.90
1057.7
Tab.2
Fig.8
Fig.9
Variables
Pg?min?
Pg?max?
Minimumβ fuel cost
Combined minimum fuel cost & minimumβ emission
Minimum emissionβ
Pg1/MW
40
200
150.6200
121.040
44.15
Pg2/MW
20
80
46.5300
52.950
50.65
Pg5/MW
15
50
20.6400
22.360
50.00
Pg8/MW
10
35
15.8100
25.170
35.00
Pg11/MW
10
30
10.0500
15.660
30.00
Pg13/MW
12
40
12.0000
16.320
40.00
Generation cost/($·h-1)
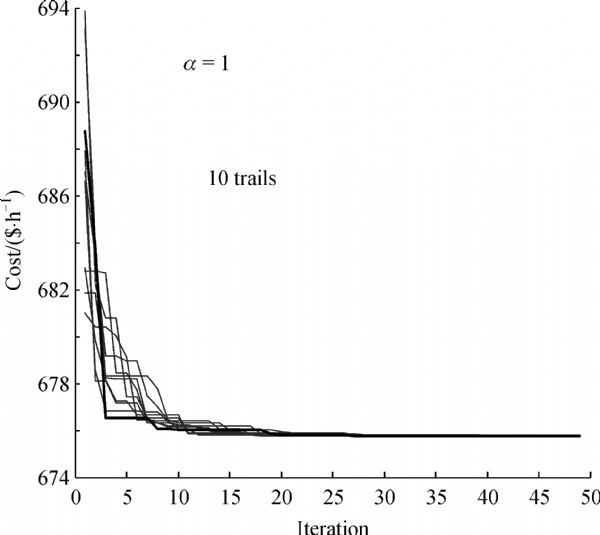
678.6375
688.1710
831.8585
Emission/(t·h-1)
0.3097
0.2599
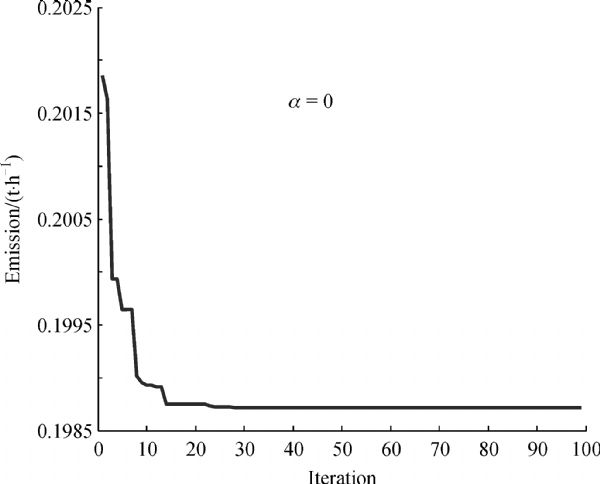
0.1983
Total cost/($·h-1)
849.1769
831.2875
941.0544
Power loss/MW
7.973
6.104
2.396
Tab.3
Fig.10
Fig.11
Fig.12
Fig.13
Fig.14
Candidate buses
STATCOM Location
10
12
15
17
20
21
23
24
29
Q/MVAR
40.35
-16.77
-9.81
-19.34
-1.96
-19.98
1.25
4.87
-4.18
Pw/MW
3.92
3.92
4.01
4.06
4.18
4.20
3.97
3.87
3.87
∑i=1NWPwi/MW
36 MW(12.7%), PD=283.4 MW
Tab.4
Fig.15
Unit No.
Pgi/MW
Unit No.
Pgi/MW
[QPSO][33]
[DEBBO][32]
Our approach
[QPSO][33]
[DEBBO][32]
Our approach
1
111.20
110.7998
110.8057
21
523.28
523.2794
523.2793
2
111.70
110.7998
110.8000
22
523.28
523.2794
523.2802
3
97.40
97.3999
97.4005
23
523.29
523.2794
523.2818
4
179.73
179.7331
179.7372
24
523.28
523.2794
523.2797
5
90.14
87.9576
87.8025
25
523.29
523.2794
523.2782
6
140.00
140.000
140.0000
26
523.28
523.2794
523.2821
7
259.60
259.5997
259.5997
27
10.01
10.00
10.0000
8
284.80
284.5997
284.5999
28
10.01
10.00
10.0000
9
284.84
284.5997
284.6009
29
10.00
10.00
10.0000
10
130.00
130.000
130.0000
30
88.47
97.000
87.7968
11
168.80
168.7998
94.0000
31
190.00
190.000
190.0000
12
168.80
94.000
94.0000
32
190.00
190.000
190.0000
13
214.76
214.7598
214.7612
33
190.00
190.000
190.0000
14
304.53
394.2794
394.2783
34
164.91
164.7998
164.8019
15
394.28
394.2794
394.2773
35
165.36
200.00
194.3764
16
394.28
304.5196
394.2786
36
167.19
200.00
200.0000
17
489.28
489.2794
489.2802
37
110.00
110.0000
110.0000
18
489.28
489.2794
489.2799
38
107.01
110.0000
110.0000
19
511.28
511.2794
511.2819
39
110.00
110.0000
110.0000
20
511.28
511.2794
511.2789
40
511.36
511.2794
511.2809
TP/MW
10500
10500
10500
TC/($·h-1)
121448.21
121420.89
121412.8684
Notes: TP—Total power generation; TC—Total cost
Tab.5
Methods: Refs. [17,24,32,33,34]
Minimum cost/($·h-1)
Worst cost/($·h-1)
Average time/s
CEP
123488.29
/
/
FEP
122679.71
/
/
MFEP
122647.57
/
/
IFEP
122624.35
/
/
EGA
122022.96
/
12.892
FIA
121823.80
/
12.854
SPSO
121787.39
/
5.055
DEBBO
121420.89
/
/
QSPO
121448.21
/
5.374
Proposed approach
121412.8684
121421.0699
10.380
Tab.6
Fig.16
Unit No.
Pgi/MW
Run 1
Run 2
Run 3
Run 4
Run 5
Run 6
Run 7
1
110.7963
110.7940
110.8000
110.7984
110.8052
110.7820
110.9377
2
110.8049
110.8006
110.8055
110.8436
110.8032
110.8431
110.8368
3
97.4009
97.3998
97.4009
97.4135
97.4233
97.3983
97.4378
4
179.7327
179.7304
179.7309
179.7382
179.7168
179.7446
179.7518
5
87.8057
87.8053
87.8012
87.7990
87.8011
87.8180
87.8414
6
140.0000
140.0000
140.0000
140.0000
140.0000
140.0000
140.0000
7
259.5958
259.6012
259.5989
259.5933
259.6069
259.5970
259.6015
8
284.6068
284.6006
284.5996
284.6081
284.6016
284.5995
284.7250
9
284.6058
284.6012
284.5988
284.5857
284.5938
284.5995
284.5836
10
130.0000
130.0000
130.0000
130.0000
130.0000
130.0000
130.0000
11
94.0000
94.0000
94.0000
94.0000
94.0000
94.0000
94.0000
12
94.0000
94.0000
94.0000
94.0000
94.0000
94.0000
94.0000
13
214.7560
214.7566
214.7569
214.7662
214.7753
214.7593
214.8026
14
394.2778
394.2791
394.2782
394.2876
394.2645
394.2559
394.2727
15
394.2791
394.2790
394.2775
?394.2808
394.2633
394.2793
394.2711
16
394.2782
394.2663
394.2793
394.2850
394.2705
394.2917
394.2526
17
489.2766
489.2794
489.2892
489.2808
489.2723
489.2787
489.2756
18
489.2819
489.2780
489.2802
489.2773
489.2811
489.2810
489.2585
19
511.2807
511.2777
511.2822
511.2867
511.2796
511.2670
511.2920
20
511.2798
511.2841
511.2793
511.2783
511.2654
511.2745
511.2932
21
523.2807
523.2780
523.2803
523.2830
523.2772
523.2836
523.3908
22
523.2793
523.2870
523.2820
523.2858
523.2911
523.2968
523.3102
23
523.2785
523.2777
523.2843
523.2856
523.2787
523.2832
523.2867
24
523.2765
523.2793
523.2779
523.2801
523.2889
523.2867
523.3025
25
523.2861
523.2818
523.2785
523.2904
523.2880
523.3038
523.3029
26
523.2831
523.2798
523.2795
523.2814
523.2835
523.2674
523.2898
27
10.0000
10.0000
10.0000
10.0000
10.0000
10.0000
10.0000
28
10.0000
10.0000
10.0000
10.0000
10.0000
10.0000
10.0000
29
10.0000
10.0000
10.0000
10.0000
10.0000
10.0000
10.0000
30
87.8001
87.8006
87.8021
87.8064
87.8021
87.8092
88.1814
31
190.0000
190.0000
190.0000
190.0000
190.0000
190.0000
190.0000
32
190.0000
190.0000
190.0000
190.0000
190.0000
190.0000
190.0000
33
190.0000
190.0000
190.0000
190.0000
190.0000
190.0000
190.0000
34
164.7989
164.7998
164.7978
164.7979
164.7962
164.8770
164.7991
35
194.3753
194.4032
200.0000
194.2815
200.0000
200.0000
193.3452
36
200.0000
200.0000
194.3798
200.0000
194.3876
194.2448
200.0000
37
110.0000
110.0000
110.0000
110.0000
110.0000
110.0000
110.0000
38
110.0000
110.0000
110.0000
110.0000
110.0000
110.0000
110.0000
39
110.0000
110.0000
110.0000
110.0000
110.0000
110.0000
110.0000
40
511.2827
511.2796
511.2794
511.2854
511.2831
511.2781
511.3574
Cost/($·h-1)
121413.09953
121413.0315
121412.940
121414.0199
121414.217
121414.9470
121421.0699
Tab.7
1
Niknam T, Narimani M R, Azizipanah-Abarghooee R. A new hybrid algorithm for optimal power flow considering prohibited zones and valve point effect. Energy Conversion and Management , 2012, 58: 197–206 doi: 10.1016/j.enconman.2012.01.017
2
El-Keib A A, Ma H, Hart J L. Economic dispatch in view of clean air act of 1990. IEEE Transactions on Power Systems , 1994, 9(2): 972–978 doi: 10.1109/59.317648
3
Dhillon J S, Parti S C, Kothari D P. Stochastic economic emission load dispatch. Electric Power Systems Research , 1993, 26(3): 179–186 doi: 10.1016/0378-7796(93)90011-3
4
Talaq J H, El-Hawary F, El-Hawary M E. A summary of environmental and economic dispatch algorithms. IEEE Transactions on Power Systems , 1994, 9(3): 1508–1516 doi: 10.1109/59.336110
5
Hingorani N G, Gyugyi L. Understanding FACTS: Concepts and Technology of a Flexible Transmission Systems. Wiley-IEEE Press , 1999
6
Mahdad B. Contribution to the improvement of power quality using multi hybrid model based wind-shunt FACTS. In: Proceedings of 10th EEEIC International Conference on Environment and Electrical Engineering, Rome, Italy , 2011, 1–5
7
Aghaei J, Gitizadeh M, Kaji M. Placement and operation strategy of FACTS devices using optimal continuous power flow. Scientia Iranica . Available online 20July2012
8
Bent S. Renewable Energy: Its Physics, Use, Environmental Impacts, Economy and Planning Aspects. 3rd ed. Academic Press/Elsevier , 2004
9
Capuder T, Pand?i? H, Kuzle I, ?krlec D. Specifics of integration of wind power plants into the Croatian transmission network. Applied Energy , 2013, 101: 142–150
10
Pezzinia P, Gomis-Bellmunt O, Sudrià-Andreua A. Optimization techniques to improve energy efficiency in power systems. Renewable & Sustainable Energy Reviews , 2011, 15(4): 2029–2041
11
Frank S, Steponavice I, Rebennack S. Optimal power flow: A bibliographic survey I, formulations and deterministic methods. Energy Systems , 2012, 3(3): 221–258 doi: 10.1007/s12667-012-0056-y
12
Frank S, Steponavice I, Rebennack S. Optimal power flow: A bibliographic survey II, non-deterministic and hybrid methods. Energy Systems , 2012, 3(3): 259–289 doi: 10.1007/s12667-012-0057-x
13
Capitanescua F, Martinez Ramos J L, Panciatici P, Kirschen D, Marano Marcolini A, Platbrood L, Wehenkel L. State-of-the-art, challenges, and future trends in security constrained optimal power flow. Electric Power Systems Research , 2011, 81(8): 1731–1741 doi: 10.1016/j.epsr.2011.04.003
14
Abido M A. Multiobjective evolutionary algorithms for electric power dispatch problem. IEEE Transactions on Power Systems , 2006, 10(3): 315–329
15
Abido M A. A niched pareto genetic algorithm for multiobjective environmental/economic dispatch. Electrical Power Energy Systems Research , 2003, 25(2): 79–105
16
Abido M A. A novel multiobjective evolutionary algorithm for environmental/economic power dispatch. Electrical Power Energy Systems Research , 2003, 65(1): 71–81 doi: 10.1016/S0378-7796(02)00221-3
17
Simon D, Ergezer M, Du D. Population distributions in biogeography- based optimization with elitism. 2008, http:// academic.csuohio.edu/simond/bbo/markov
18
Roy P K, Ghoshal S P, Thakur S S. Biogeography based optimization for multi-constraint optimal power flow with emission and non-smooth cost function. International Journal of Expert Systems with Apllications , 2010, 37(12): 8221–8228 doi: 10.1016/j.eswa.2010.05.064
19
Amjady N, Sharifzadeh H. Security constrained optimal power flow considering detailed generator model by a new robust differential evolution algorithm. Electric Power Systems Research , 2011, 81(2): 740–749 doi: 10.1016/j.epsr.2010.11.005
20
Coelho L S, Souza R C T, Mariani V C. Improved differential evoluation approach based on cultural algorithm and diversity measure applied to solve economic load dispatch problems. Journal of Mathematics and Computers in Simulation, Elsevier , 2009, 79(10): 3136–3147 doi: 10.1016/j.matcom.2009.03.005
21
Panigrahi B K, Ravikumar Pandi V, Das S. Adaptive particle swarm optimization approach for static and dynamic economic load dispatch. Energy Conversion and Management , 2008, 49(6): 1407–1415 doi: 10.1016/j.enconman.2007.12.023
22
Wang Z J, Zhou J Z, Qin H, Lu Y L. Improved chaotic particle swarm optimization algorithm for dynamic economic dispatch problem with valve-point effects. Energy Conversion and Management , 2010, 51(12): 2893–2900 doi: 10.1016/j.enconman.2010.06.029
23
Duman S, Guvenc U, Sonmez Y, Yorukeren N. Optimal power flow using gravitational search algorithm. Energy Conversion and Management , 2012, 59(1): 86–95 doi: 10.1016/j.enconman.2012.02.024
24
Yang H T, Peng P C. Improved Taguchi method based contract capacity optimization for industrial consumer with self-owned generating units. Energy Conversion and Management , 2012, 53(1): 282–290 doi: 10.1016/j.enconman.2011.09.008
25
Cai J J, Li Q, Li L X, Peng H P, Yang Y X. A hybrid CPSO–SQP method for economic dispatch considering the valve-point effects. Energy Conversion and Management , 2012, 53(1): 175–181 doi: 10.1016/j.enconman.2011.08.023
26
Kuo C C. Generation dispatch under large penetration of wind energy considering emission and economy. Energy Conversion and Management , 2010, 51(1): 89–97 doi: 10.1016/j.enconman.2009.08.025
27
Gonzalez F D, Rojas M M, Sumper A, Gomis-Bellmunt O, Trilla L. Strategies for reactive power control in wind farms with STATCOM. 2010, http://upcommons.upc.edu/e-prints/bitstream/2117/7386/1/Paper%20STATCOM.pdf
28
Storn R, Price K. Differential evolution—A Simple and Efficient Adaptive Scheme for Global Optimization Over Continuous Spaces. Technical Report TR-95–012. International Computer Science Institute, Berkeley, USA , 1995
29
Acha E, Fuerte-Esquivel C R, Ambiz-Perez H, Angeles-Camacho C. FACTS Modelling and Simulation in Power Networks. John Wiley & Sons , 2004
30
Gupta A. Economic emission load dispatch using interval differential evolution algorithm. In: Proceedings of 4th International Workshop on reliable Engineering Computing (REC 2010), Singapore , 2000
31
Mahdad B, Bouktir T, Srairi K. Genetic algorithm and fuzzy rules applied to enhance the optimal power flow with consideration of FACTS. International Journal of Computational Intelligence Research , 2008, 4(3): 229–238 doi: 10.5019/j.ijcir.2008.141
32
Bhattacharya A, Chattopadhyay P K. Hybrid differential evolution with Biogeaography-based optimization for solution of economic load dispatch. IEEE Transactions on Power Systems , 2010, 25(4): 1955–1964 doi: 10.1109/TPWRS.2010.2043270
33
Meng K, Wang H G, Dong Z Y, Wong K P. Quantum-inspired particle swarm optimization for valve-point economic load dispatch. IEEE Transactions on Power Systems , 2010, 25(1): 215–222 doi: 10.1109/TPWRS.2009.2030359
34
Al-Sumait J S, Sykulski J K, Al-Othman A K. Solution of different types of economic load dispatch problems using a pattern search method. Electric Power Components and Systems , 2008, 36(3): 250–265 doi: 10.1080/15325000701603892