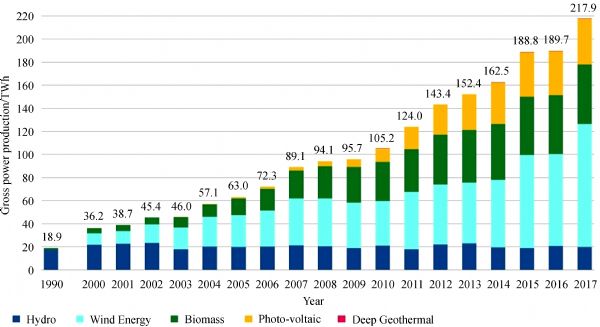
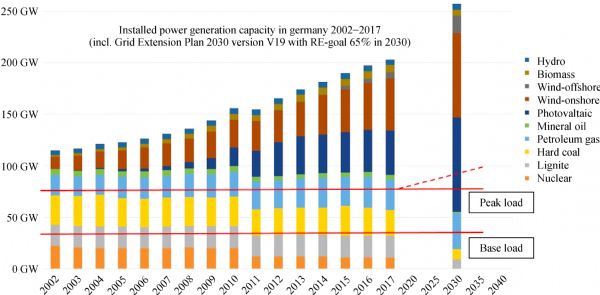
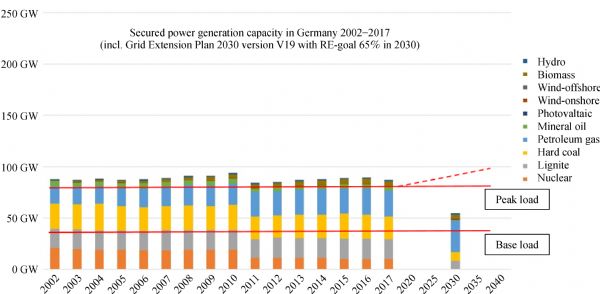
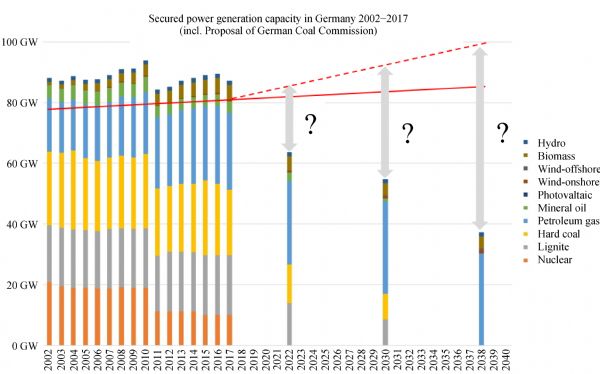
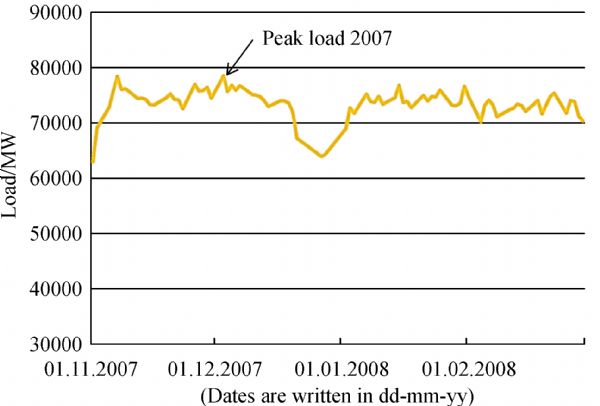
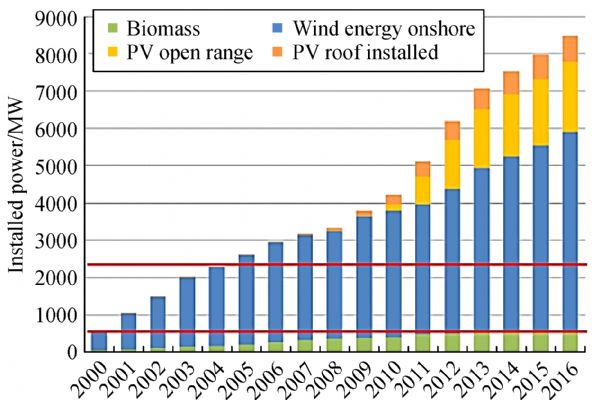
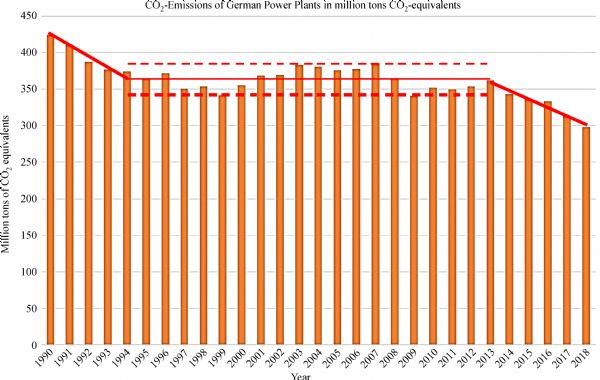
Together with a huge number of other countries, Germany signed the Paris Agreements in 2015 to prevent global temperature increase above 2°C. Within this agreement, all countries defined their own national contributions to CO2 reduction. Since that, it was visible that CO2 emissions in Germany decreased, but not so fast than proposed in this German nationally determined contribution to the Paris Agreement. Due to increasing traffic, CO2 emissions from this mobility sector increased and CO2 emission from German power generation is nearly constant for the past 20 years, even a renewable generation capacity of 112 GW was built up in 2017, which is much higher than the peak load of 84 GW in Germany. That is why the German National Government has implemented a commission (often called “The German Coal Commission”) to propose a time line: how Germany can move out of coal-fired power stations. This “Coal Commission” started its work in the late spring of 2018 and handed over its final report with 336 pages to the government on January 26th, 2019. Within this report the following proposals were made: ① Until 2022: Due to a former decision of the German Government, the actual remaining nuclear power generation capacity of about 10 GW has to be switched off in 2022. Besides, the “Coal Commission” proposed to switch off additionally in total 12.5 GW of both, hard coal and lignite-fired power plants, so that Germany should reduce its conventional generation capacity by 22.5 GW in 2022. ② Until 2030: Another 13 GW of German hard coal or lignite-fired power plants should be switched off. ③ Until 2038: The final 17 GW of German hard coal or lignite-fired power plants should be switched off until 2038 latest. Unfortunately the “Coal Commission” has not investigated the relevant technical parameter to ensure a secured electric power supply, based on German’s own national resources. Because German Energy Revolution mainly is based on wind energy and photovoltaic, this paper will describe the negligible contribution of these sources to the secured generation capacity, which will be needed for a reliable power supply. In addition, it will discuss several technical options to integrate wind energy and photovoltaic into a secured power supply system with an overall reduced CO2 emission.
. [J]. Frontiers in Energy, 2019, 13(3): 551-570.
Harald SCHWARZ. Will Germany move into a situation with unsecured power supply?. Front. Energy, 2019, 13(3): 551-570.
Secured power generation capacity of conventional power station [7]
Secured power generation capacity of renewable power generation [8]
Types
Percentage/%
Types
Percentage/%
Nuclear power stations
93
Running water power stations
25
Lignite power stations
92
Biomass power stations
65
Hard coal power station
86
Wind generation off-shore
2
Natural gas (gas and steam units)
86
Wind generation on-shore
1
Natural oil
86
Photovoltaic
0
Fast starting gas turbines
42
Tab.5
Fig.4
Fig.5
Fig.6
Fig.7
Fig.8
CO2 emissions caused by combustion process /(kg·MWh–1)
CO2 emissions caused by exploitation and transport to Germany/(kg·MWh–1)
Total CO2 emission from the global point of view/(kg·MWh–1)
Lignite
930
35
965
Hard coal (German Mix)
735
235
970
Natural gas with pipeline transport from Norway
335
365
700
Natural Gas with pipeline transport from Russia
335
445
780
US-shale gas with LNG transport
335
745
1080
Natural gas with LNG transport from Algeria
335
475
810
Natural gas with LNG transport from Katar
335
485
820
Tab.6
Fig.9
Fig.10
Fig.11
Fig.12
Fig.13
Fig.14
Fig.15
Fig.16
Fig.17
Fig.18
Fig.19
Fig.20
Fig.21
Border between Germany and
Power demand in the related country, when Germany is on 100% of its annual power demand / %
Transport capacity of cross border going high voltage lines/ GW
Poland
96
1.6
Czech Republic
91
2.8
Austria
92
6.0
Switzerland
90
4.0
France
84
4.7
Belgium
93
-
Netherlands
100
1.7
Denmark
96
2.2
Sweden
83
0.6
Tab.7
Fig.22
Fig.23
Fig.24
Fig.25
Fig.26
1
Federal Ministry of Economic Affairs and Energy (BMWi). Gross electricity generation in Germany in 2017. 2019–01
2
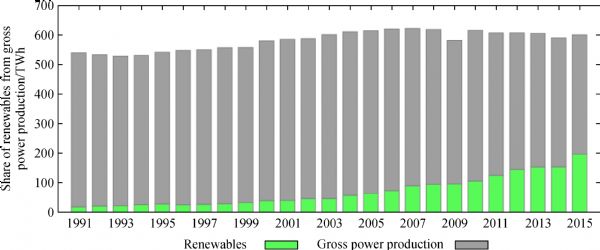
Federal Ministry of Economic Affairs and Energy (BMWi). Development of renewables-based electricity generation in Germany. 2019–01
3
Federal Statistical Office. Gross power production in Germany. 2019–01
4
Windmesse All in Wind. Strommix 2017. 2019–01
5
German National Grid Agency. National Grid Development Plan NEP 2030 Version 2019 of BNetzA. 2019
6
I S E Fraunhofer. Energy Charts. Net installed electricity generation capacity in Germany. 2019–01
7
DENA (German National Energy Agency). Brief analysis of power plant performance in Germany until 2020 (update). Berlin, 2010 (in German)
8
50Hertz. Energiewende Outlook 2035 together with it E-Bridge, FGH, RWTH Aachen, Prognos. 2016
9
I S E Fraunhofer. Energy charts. 2019–01, available at energy-charts.de website
10
Federal Ministry of Economic Affairs and Energy (BMWi). Final Report of the German Coal Commission: Commission Growth, Structural Change and Employment. Berlin, Germany, 2019 (in German)
11
I S E Fraunhofer. Energy charts. 2019–01
12
Marcus Binder. Board of Directors LEAG. In: Energy Conference Neu-Ulm , Germany, 2019
13
J Keiler, H Häuser. Operator data base. IWET database. 2019
14
Federal Network Agency (BNetzA). Governmental Reports. 2019–01
15
Federal Network Agency (BNetzA). SMART electricity market data. 2019–01
16
Agora Energiewende. Agorameter. 2019–01
17
T Linnemann, G S Vallana. Wind energy in Germany and Europe. VGB PowerTech, 2018, 10: 68–85 (in German)
18
ENTSO-E. Transparency platform. 2019–01
19
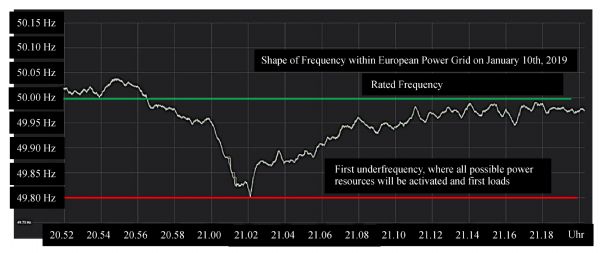
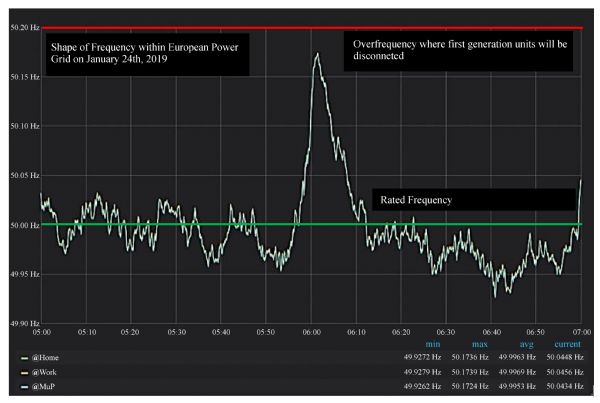
Netzfrequenz info. 2019–01
20
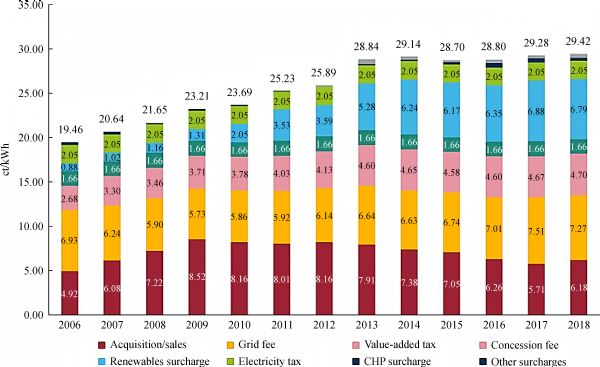
E Thalman, B Wehrmann. What German households pay for power? 2019–01
21
Federal Agency of Environment (Umweltbundesamt). Development of energy-related greenhouse gas emissions by source category. 2019–01
22
H Schwarz. Grid Integration of Renewable Energies. In: VBI-Guide Renewable Energy. Berlin: German Association of Consulting Engineers, 2019