|
|
|
Performance and emission characteristics of a diesel engine operating on different water in diesel emulsion fuels: optimization using response surface methodology (RSM) |
Seyed Saeed HOSEINI, Mohammad Amin SOBATI( ) ) |
| School of Chemical Engineering, Iran University of Science and Technology (IUST), Tehran 16765163, Iran |
|
|
|
|
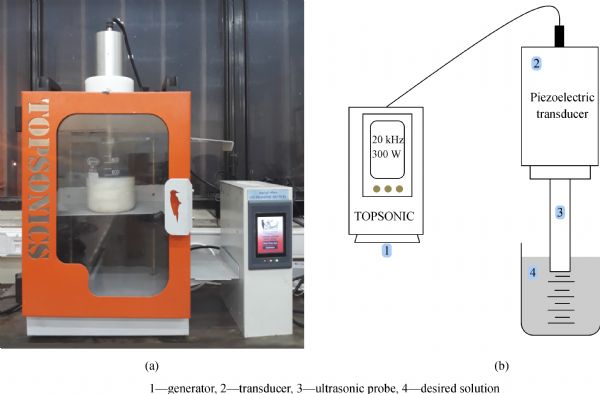
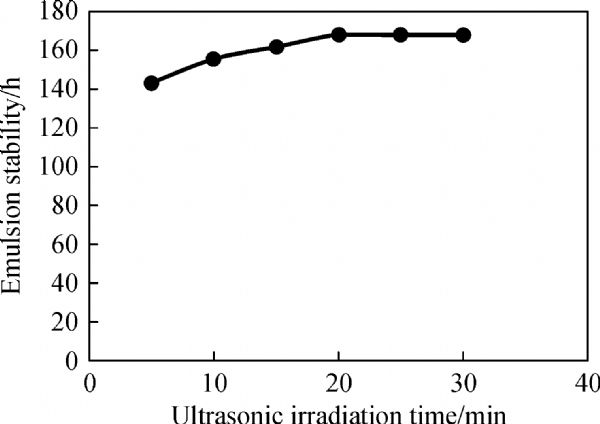
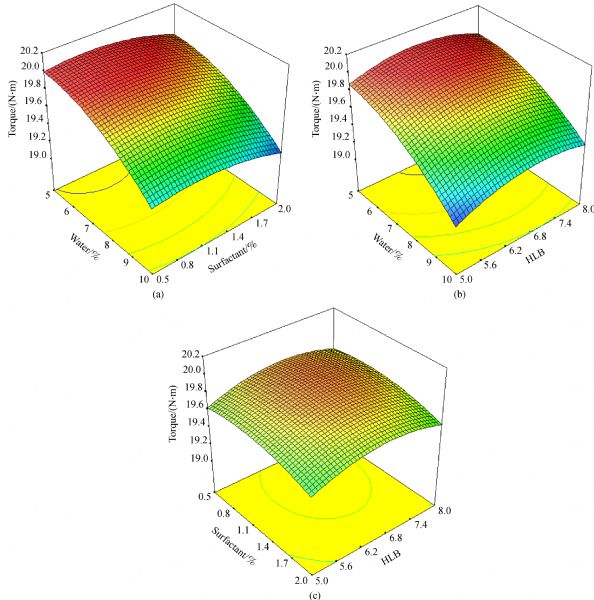
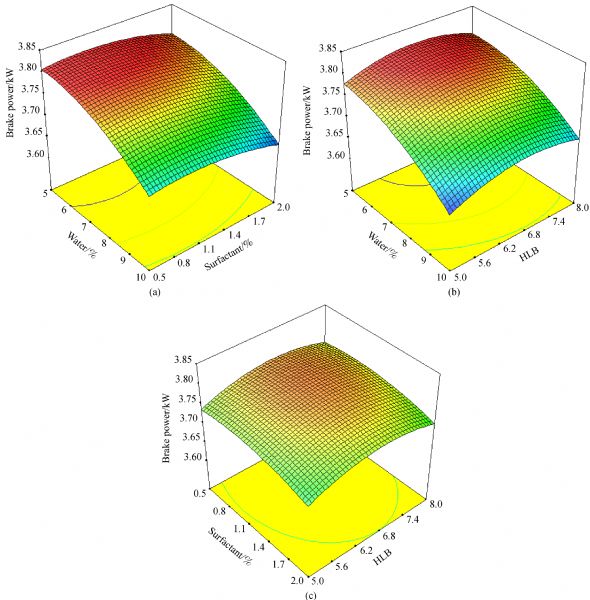
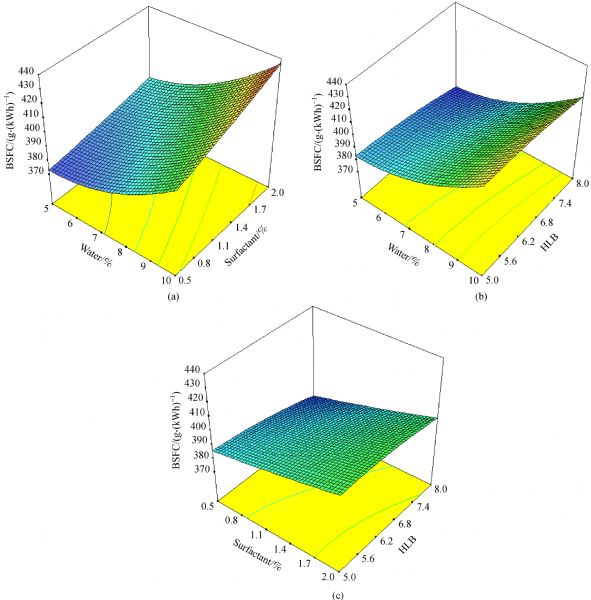
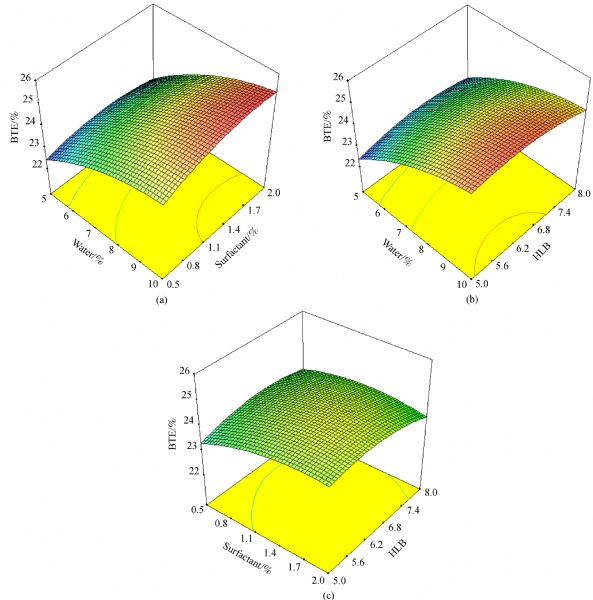
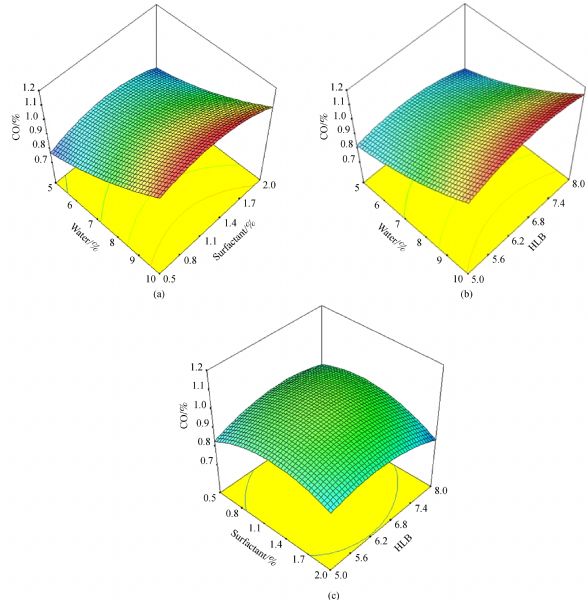
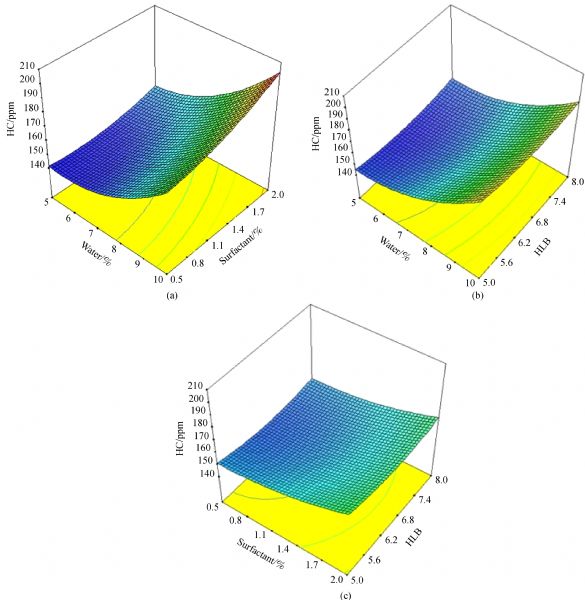
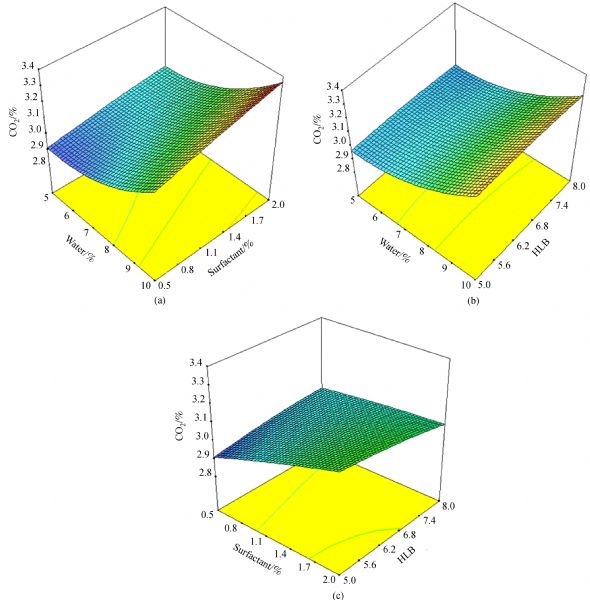
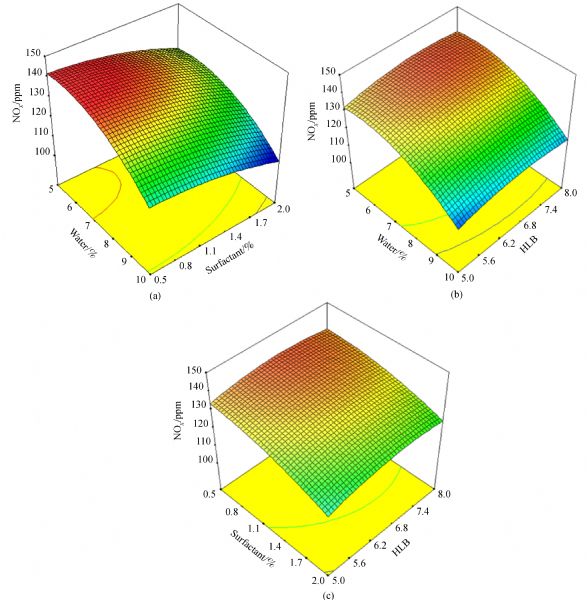
Abstract The nitrogen oxide (NOx) release of diesel engines can be reduced using water in diesel emulsion fuel without any engine modification. In the present paper, different formulations of water in diesel emulsion fuels were prepared by ultrasonic irradiation. The water droplet size in the emulsion, polydisperisty index, and the stability of prepared fuel was examined, experimentally. Afterwards, the performance characteristics and exhaust emission of a single cylinder air-cooled diesel engine were investigated using different water in diesel emulsion fuels. The effect of water content (in the range of 5%–10% by volume), surfactant content (in the range of 0.5%–2% by volume), and hydrophilic-lipophilic balance (HLB) (in the range of 5–8) was examined using Box-Behnken design (BBD) as a subset of response surface methodology (RSM). Considering multi-objective optimization, the best formulation for the emulsion fuel was found to be 5% water, 2% surfactant, and HLB of 6.8. A comparison was made between the best emulsion fuel and the neat diesel fuel for engine performance and emission characteristics. A considerable decrease in the nitrogen oxide emission (–18.24%) was observed for the best emulsion fuel compared to neat diesel fuel.
|
| Keywords
water in diesel emulsion fuel
hydrophilic-lipophilic balance (HLB)
response surface methodology (RSM)
emulsion stability
engine performance
exhaust emission
|
|
Corresponding Author(s):
Mohammad Amin SOBATI
|
|
Online First Date: 11 December 2019
Issue Date: 26 December 2019
|
|
| 1 |
M R Seifi, S R Hassan-Beygia, B Ghobadian, U Desideri, M Antonelli. Experimental investigation of a diesel engine power, torque and noise emission using water–diesel emulsions. Fuel, 2016, 166: 392–399
https://doi.org/10.1016/j.fuel.2015.10.122
|
| 2 |
N A Mazlan, W J Yahya, A M Ithnin, A K Hasannuddin, N A Ramlan, D A Sugeng, A R Muhammad Adib, T Koga, R Mamat, N A C Sidik. Effects of different water percentages in non-surfactant emulsion fuel on performance and exhaust emissions of a light-duty truck. Journal of Cleaner Production, 2018, 179: 559–566
https://doi.org/10.1016/j.jclepro.2018.01.143
|
| 3 |
YH Tan, MO Abdullah, C Nolasco-Hipolito, N S Ahmad Zauzia, G W Abdullahb. Engine performance and emissions characteristics of a diesel engine fueled with diesel-biodiesel-bioethanol emulsions. Energy Conversion and Management, 2017, 132: 54–64
https://doi.org/10.1016/j.enconman.2016.11.013
|
| 4 |
A Alahmer, J Yamin, A Sakhrieh, M A Hamdan. Engine performance using emulsified diesel fuel. Energy Conversion and Management, 2010, 51(8): 1708–1713
https://doi.org/10.1016/j.enconman.2009.11.044
|
| 5 |
W M Yang, H An, S K Chou, K J Chua, B Mohan, V Sivasankaralingam, V Raman, A Maghbouli, J Li. Impact of emulsion fuel with nano-organic additives on the performance of diesel engine. Applied Energy, 2013, 112(Supplement C): 1206–1212
https://doi.org/10.1016/j.apenergy.2013.02.027
|
| 6 |
M Abu-Zaid. Performance of single cylinder, direct injection diesel engine using water fuel emulsions. Energy Conversion and Management, 2004, 45(5): 697–705
https://doi.org/10.1016/S0196-8904(03)00179-1
|
| 7 |
V Suresh, K S Amirthagadeswaran. Combustion and performance characteristics of water-in-diesel emulsion fuel. Energy Sources. Part A, Recovery, Utilization, and Environmental Effects, 2015, 37(18): 2020–2028
https://doi.org/10.1080/15567036.2015.1072605
|
| 8 |
B S Bidita, A R Suraya, A Shazed, M A Mohd Salleh, A Idris. Influence of fuel additive in the formulation and combustion characteristics of water-in-diesel nanoemulsion fuel. Energy & Fuels, 2014, 28(6): 4149–4161
https://doi.org/10.1021/ef5002259
|
| 9 |
A M Ithnin, M A Ahmad, M A A Bakar, S Rajoo, W J Yahya. Combustion performance and emission analysis of diesel engine fuelled with water-in-diesel emulsion fuel made from low-grade diesel fuel. Energy Conversion and Management, 2015, 90: 375–382
https://doi.org/10.1016/j.enconman.2014.11.025
|
| 10 |
J S Basha, R B Anand. An experimental study in a CI engine using nanoadditive blended water–diesel emulsion fuel. International Journal of Green Energy, 2011, 8(3): 332–348
https://doi.org/10.1080/15435075.2011.557844
|
| 11 |
D Ogunkoya, S Li, O J Rojas, T Fang. Performance, combustion, and emissions in a diesel engine operated with fuel-in-water emulsions based on lignin. Applied Energy, 2015, 154: 851–861
https://doi.org/10.1016/j.apenergy.2015.05.036
|
| 12 |
A Alahmer. Influence of using emulsified diesel fuel on the performance and pollutants emitted from diesel engine. Energy Conversion and Management, 2013, 73: 361–369
https://doi.org/10.1016/j.enconman.2013.05.012
|
| 13 |
A M A Attia, A R Kulchitskiy. Influence of the structure of water-in-fuel emulsion on diesel engine performance. Fuel, 2014, 116: 703–708
https://doi.org/10.1016/j.fuel.2013.08.057
|
| 14 |
W Yang, H An, S K Chou, S Vedharaji, R Vallinagam, M Balaji, F E A Mohammad, K J E Chua. Emulsion fuel with novel nano-organic additives for diesel engine application. Fuel, 2013, 104: 726–731
https://doi.org/10.1016/j.fuel.2012.04.051
|
| 15 |
S Henningsen. Influence of the fuel injection equipment on NOx emissions and particulates on a large heavy-duty two-stroke diesel engine operating on water-in-fuel emulsion. SAE Technical Paper, 1994
|
| 16 |
M Nadeem, C Rangkuti, K Anuar, M R U Haq, I B Tan, S S Shah. Diesel engine performance and emission evaluation using emulsified fuels stabilized by conventional and gemini surfactants. Fuel, 2006, 85(14–15): 2111–2119
https://doi.org/10.1016/j.fuel.2006.03.013
|
| 17 |
R Ochoterena, A Lif, M Nydén, S Andersson, I Denbratt. Optical studies of spray development and combustion of water-in-diesel emulsion and microemulsion fuels. Fuel, 2010, 89(1): 122–132
https://doi.org/10.1016/j.fuel.2009.06.039
|
| 18 |
K A Subramanian. A comparison of water–diesel emulsion and timed injection of water into the intake manifold of a diesel engine for simultaneous control of NO and smoke emissions. Energy Conversion and Management, 2011, 52(2): 849–857
https://doi.org/10.1016/j.enconman.2010.08.010
|
| 19 |
C Y Lin, L W Chen. Engine performance and emission characteristics of three-phase diesel emulsions prepared by an ultrasonic emulsification method. Fuel, 2006, 85(5–6): 593–600
https://doi.org/10.1016/j.fuel.2005.09.007
|
| 20 |
C Y Lin, H A Lin. Engine performance and emission characteristics of a three-phase emulsion of biodiesel produced by peroxidation. Fuel Processing Technology, 2007, 88(1): 35–41
https://doi.org/10.1016/j.fuproc.2006.07.008
|
| 21 |
R R Hegde, P Sharma, P Raj, R V Keny, P J Bhide, S Kumar, S S Bhattacharya, A Lohani, A Kumar, A Verma, P Chakraborty, A Ghosh, V Trivedi. Factors affecting emissions from diesel fuel and water-in-diesel emulsion. Energy Sources. Part A, Recovery, Utilization, and Environmental Effects, 2016, 38(12): 1771–1778
https://doi.org/10.1080/15567036.2014.989341
|
| 22 |
P Ramakrishnan, R Kasimani, M S Peer. Optimization in the performance and emission parameters of a DI diesel engine fuelled with pentanol added Calophyllum inophyllum/diesel blends using response surface methodology. Environmental Science and Pollution Research International, 2018, 25(29): 29115–29128
https://doi.org/10.1007/s11356-018-2867-4
|
| 23 |
S Vellaiyan, A Subbiah, P Chockalingam. Multi-response optimization to obtain better performance and emission level in a diesel engine fueled with water-biodiesel emulsion fuel and nanoadditive. Environmental Science and Pollution Research International, 2019, 26(5): 4833–4841
https://doi.org/10.1007/s11356-018-3979-6
|
| 24 |
E Khalife, M Tabatabaei, A Demirbas, M Aghbashlo. Impacts of additives on performance and emission characteristics of diesel engines during steady state operation. Progress in Energy and Combustion Science, 2017, 59: 32–78
https://doi.org/10.1016/j.pecs.2016.10.001
|
| 25 |
J S Basha, R Anand. An experimental investigation in a diesel engine using carbon nanotubes blended water–diesel emulsion fuel. Proceedings of the Institution of Mechanical Engineers. Part A, Journal of Power and Energy, 2011, 225(3): 279–288
https://doi.org/10.1177/2041296710394247
|
| 26 |
Z B Chen, X C Wang, Y Q Pei, C Zhang, M Xiao, J He. Experimental investigation of the performance and emissions of diesel engines by a novel emulsified diesel fuel. Energy Conversion and Management, 2015, 95: 334–341
https://doi.org/10.1016/j.enconman.2015.02.016
|
| 27 |
V W Khond, V M Kriplani. Effect of nanofluid additives on performances and emissions of emulsified diesel and biodiesel fueled stationary CI engine: a comprehensive review. Renewable & Sustainable Energy Reviews, 2016, 59: 1338–1348
https://doi.org/10.1016/j.rser.2016.01.051
|
| 28 |
A A Abdel-Rehim, S Y Akl. An experimental investigation of the effect of aluminum oxide (Al2O3) nanoparticles as fuel additive on the performance and emissions of a diesel engine. SAE Technical Paper, 2016
https://doi.org/10.4271/2016-01-0828
|
| 29 |
M E A Fahd, Y Wenming, P S Lee, S K Chou, C R Yap. Experimental investigation of the performance and emission characteristics of direct injection diesel engine by water emulsion diesel under varying engine load condition. Applied Energy, 2013, 102: 1042–1049
https://doi.org/10.1016/j.apenergy.2012.06.041
|
| 30 |
H Raheman, S Kumari. Combustion characteristics and emissions of a compression ignition engine using emulsified jatropha biodiesel blend. Biosystems Engineering, 2014, 123(Supplement C): 29–39
https://doi.org/10.1016/j.biosystemseng.2014.05.001
|
| 31 |
A B Koc, M Abdullah. Performance and NOx emissions of a diesel engine fueled with biodiesel-diesel-water nanoemulsions. Fuel Processing Technology, 2013, 109(Supplement C): 70–77
https://doi.org/10.1016/j.fuproc.2012.09.039
|
| 32 |
B K Debnath, N Sahoo, U K Saha. Adjusting the operating characteristics to improve the performance of an emulsified palm oil methyl ester run diesel engine. Energy Conversion and Management, 2013, 69: 191–198
https://doi.org/10.1016/j.enconman.2013.01.031
|
| 33 |
L Feng, B G Du, J P Tian, W Long, B Tang. Combustion performance and emission characteristics of a diesel engine using a water-emulsified heavy fuel oil and light diesel blend. Energies, 2015, 8(12): 13628–13640
https://doi.org/10.3390/en81212387
|
| 34 |
A K Wamankar, S Murugan. Combustion, performance and emission characteristics of a diesel engine with internal jet piston using carbon black-water-diesel emulsion. Energy, 2015, 91: 1030–1037
https://doi.org/10.1016/j.energy.2015.08.085
|
| 35 |
J Sadhik Basha, R B Anand. Role of nanoadditive blended biodiesel emulsion fuel on the working characteristics of a diesel engine. Journal of Renewable and Sustainable Energy, 2011, 3(2): 023106
https://doi.org/10.1063/1.3575169
|
| 36 |
B J Sadhik. AnandR.Effects of nanoparticle additive in the water-diesel emulsion fuel on the performance, emission and combustion characteristics of a diesel engine. International Journal of Vehicle Design, 2012, 59(2–3): 164–181
|
| 37 |
A Hasannuddin, J Y Wira, S Sarah, W M N Wan Syaidatul Aqma, A R Abdul Hadi, N Hirofumi, S A Aizam, M A B Aiman, S Watanabe, M I Ahmad, M A Azrin. Performance, emissions and lubricant oil analysis of diesel engine running on emulsion fuel. Energy Conversion and Management, 2016, 117: 548–557
https://doi.org/10.1016/j.enconman.2016.03.057
|
| 38 |
M Senthil Kumar, M Jaikumar. A comprehensive study on performance, emission and combustion behavior of a compression ignition engine fuelled with WCO (waste cooking oil) emulsion as fuel. Journal of the Energy Institute, 2014, 87(3): 263–271
https://doi.org/10.1016/j.joei.2014.03.001
|
| 39 |
K Kannan, M Udayakumar. NOx and HC emission control using water emulsified diesel in single cylinder diesel engine. Journal of Engineering and Applied Sciences (Asian Research Publishing Network), 2009, 4(8): 59–62
|
| 40 |
D A Sugeng, W J Yahya, A M Ithnin, M A Abdul Rashid, N S Mohd Syahril Amri, H Abd Kadir, M N Abdul Halim. Diesel engine emission analysis using fuel from diverse emulsification methods. Environmental Science and Pollution Research International, 2018, 25(27): 27214–27224
https://doi.org/10.1007/s11356-018-2760-1
|
| 41 |
P K Mondal, B K Mandal. Experimental investigation on the combustion, performance and emission characteristics of a diesel engine using water emulsified diesel prepared by ultrasonication. Journal of the Brazilian Society of Mechanical Sciences and Engineering, 2018, 40(11): 510
https://doi.org/10.1007/s40430-018-1419-7
|
| 42 |
M A Bezerra, R E Santelli, E P Oliveira, L S Villar, L A Escaleira. Response surface methodology (RSM) as a tool for optimization in analytical chemistry. Talanta, 2008, 76(5): 965–977
https://doi.org/10.1016/j.talanta.2008.05.019
|
| 43 |
H Patil, A Gadhave, S Mane, J Waghmare. Analyzing the stability of the water-in-diesel fuel emulsion. Journal of Dispersion Science and Technology, 2015, 36(9): 1221–1227
https://doi.org/10.1080/01932691.2014.962039
|
| 44 |
M R Noor El-Din, S H El-Hamouly, H M Mohamed, M R Mishrif, A M Ragab. Water-in-diesel fuel nanoemulsions: Preparation, stability and physical properties. Egyptian Journal of Petroleum, 2013, 22(4): 517–530
https://doi.org/10.1016/j.ejpe.2013.11.006
|
| 45 |
A K Hasannuddin, M I Ahmad, M Zahari, S S Mohd, A B Aiman, S A Aizam, J Y Wira. Stability studies of water-in-diesel emulsion. Applied Mechanics and Materials, 2014, 663: 54–57
https://doi.org/10.4028/www.scientific.net/AMM.663.54
|
| 46 |
M T Ghannam, M Y Selim. Stability behavior of water-in-diesel fuel emulsion. Petroleum Science and Technology, 2009, 27(4): 396–411
https://doi.org/10.1080/10916460701783969
|
| 47 |
M Y E Selim, M T Ghannam. Combustion study of stabilized water-in-diesel fuel emulsion. Energy Sources. Part A, Recovery, Utilization, and Environmental Effects, 2009, 32(3): 256–274
https://doi.org/10.1080/15567030802467621
|
|
Viewed |
|
|
|
Full text
|
|
|
|
|
Abstract
|
|
|
|
|
Cited |
|
|
|
|
| |
Shared |
|
|
|
|
| |
Discussed |
|
|
|
|