Please wait a minute...
Frontiers of Structural and Civil Engineering

ISSN 2095-2430

ISSN 2095-2449(Online)

CN 10-1023/X

Postal Subscription Code 80-968

2018 Impact Factor: 1.272

Front Arch Civil Eng Chin    0, Vol. Issue () : 418-430    https://doi.org/10.1007/s11709-010-0075-5
RESEARCH ARTICLE
Climate change and China’s mega urban regions
Chaolin GU1(), Sunsheng HAN2
1. School of Architecture and Planning, Tsinghua University, Beijing 100084, China; 2. Faculty of Architecture, Building and Planning, The University of Melbourne, Parkville VIC 3010, Australia
 Download: PDF(361 KB)   HTML
 Export: BibTeX | EndNote | Reference Manager | ProCite | RefWorks
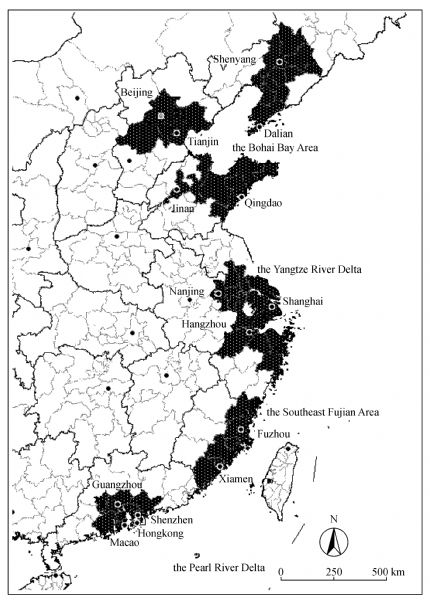
Abstract

China’s mega urban regions are focal points of economic development and environmental concerns. This paper positions four mega urban regions (i.e., the Yangtze River Delta, the Pearl River Delta, the Bohai Bay Area, and the South-eastern Fujian Province) along China’s coast into the national economy and elaborates their development challenges and planning innovations. Mega urban regions in China are spatial consequences of rapid economic transition. They deserve close scrutiny and demands for innovative planning responses in order to maintain their key role in driving economic growth but limiting their greenhouse gas emission.

Keywords climate change      mega urban region      urban planning     
Corresponding Author(s): GU Chaolin,Email:gucl@tsinghua.edu.cn   
Issue Date: 05 December 2010
 Cite this article:   
Chaolin GU,Sunsheng HAN. Climate change and China’s mega urban regions[J]. Front Arch Civil Eng Chin, 0, (): 418-430.
 URL:  
https://academic.hep.com.cn/fsce/EN/10.1007/s11709-010-0075-5
https://academic.hep.com.cn/fsce/EN/Y0/V/I/418
Fig.1  Extended metropolitan areas in China
Fig.2  Mega regions in China’s eastern coastal region
mega urban regionsarea/km2population/10,000 personsGDP/100 million yuanFDI/10,000 US $foreign imports and exports /100 million US $population density/persons·km2per capita GDP/yuan
Pearl River Delta54,7434,409.426,0602,215,0196,13380559,101
Yangtze River Delta110,8219,722.843,2358,219,562778,787744,468
Bohai Bay Area225,71312,179.646,4884,767,4284,33753638,171
south-eastern Fujian54,5422,7557,5671,437,94672750527,466
total of four mega regions4458199066.8123350166399551898465242437
% of national total12.3822.0050.0178.8687.33177.66227.36
Tab.1  China’s mega urban regions (2008)
citypopulation/10,000 personsGDP/100 million yuanFDI/10,000 US $foreign imports and xports /100 million US $
Guangzhou1,004.587,050.78328,600734.94
Shenzhen861.556,765.41366,2002,875.33
Zhuhai145.44886.84251,600398.69
Foshan592.333,588.50266,500378.48
Jiangmen412.641,095.33185,500123
Dongguan694.723,151.00312,6001,068.73
Zhongshan2511,215.00130,600246.63
Gaoyao74.2124.0813,7003.2996
Sihui43.3285.25,8121.51
Huizhou central city122.281,105157,000241.2
Zhaoqing central city49.68616.55137,00034.19
Huidong county78.35178.229,8329.2325
Bolou county79.31198.1230,07518.6797
Sum4,409.426,060.012,215,0196,133.912
percentage of national total3.3410.5710.5028.21
Tab.2  The Pearl River Delta mega urban regions (2008)
citypopulation/10,000 personsGDP/100 million yuanFDI/10,000 US $foreign imports and exports /100 million US $
Shanghai1,85812,001.161,486,9002,829.73
Nanjing7,41.33,275378,500362
Yangzhou445.971,311337,00044.59
Taizhou458.021,200171,80039.56
NanTong717.952,111774,000127.76
Zhenjiang301.931,213345,00063.05
Changzhou435.231,880440,000132.30
Wuxi599.213,858544,700511.46
Suzhou882.15,7001,852,0002,130
Hangzhou786.24,103.89558,100434.26
Jiaxing418.61,585.18345,500160.62
Huzhou257.8895.94198,60042.65
Ningbo689.53,433.08450,000565.00
Shaoxin458.11,971.00236,500192.95
Zhoushan103.5407.0019,26240.76
T’aizhou569.391,722.8981,700110.93
sum9,722.843,235.068,219,5627,787.62
% of national total7.3617.5338.9635.82
Tab.3  The Yangtze River Delta mega urban region (2008)
urban regionsarea/km2population/10,000 personsGDP/100 million yuanFDI(10,000 US $foreign imports and exports /100 million US $population density/persons·km2per capita GDP/yuan
Beijing-Tianjin-Tangshan conglomeration70,7294,997.619,0521,812,4002,75170738,123
central-southern Liaoning conglomeration81,6732,946.310,3681,975,62852036135,190
Shangdong Peninsula conglomeration73,3114,235.717,068979,4001,06657840,296
Bohai Bay mega region225,71312,179.646,4884,767,4284,33753638,171
% of national total6.279.2218.8519.2619.93
Tab.4  The Bohai Bay mega urban region (2008)
citypopulation/10,000 personsGDP/100 million yuanFDI/10,000 US $foreign imports and exports/100 million US $
Beijing1,6339,006.2507,0001,929.5
Tianjin1,1155,018.281,151,900715.2
Tangshan724.662,779.1482,00051.94
Baoding1,1231,373.438,50031.4
Langfang401.987533,00023.60
total4,997.5619,052.021,812,4002,751.64
% of national total3.787.738.5912.66
Tab.5  The Beijing-Tianjin-Tangshan conglomeration (2008)
citypopulation/10,000 personsGDP/100 million yuanFDI/10,000 US $foreign imports and exports /100 million US $
Shenyang7623,0051,285,00060.70
Dalian6083,070595,000387.50
Yingkou232.553613,00018.90
Anshan346.941,35027,10023.6
Fushun223.75386,8506.6
Liaoyang183.44356,1786.6
Benxi156.184358,62012
Tieling305.438629,1191.5371
Panjin128.26134,7612.70
sum2,946.3210,3681,975,628520.1371
% of national total2.234.209.362.39
Tab.6  The central-southern Liaoning extended metropolitan areas (2007)
citypopulation/10,000 personsGDP/100 million yuanFDI/10,000 US $foreign imports and exports /100 million US $
Jinan6802,558103,70062.18
Tsingdao838.673,786.52380,700457.25
Zibo448.391,945.0243,20046.92
Dongying199.091,658.4219,80026.52
Yantai651.472,885155,900239.44
Weifang883.612,05081,00065.10
Weihai251.061,585134,000110.81
Rizhao283.3860061,10057.59
total4,235.6717,067.96979,4001,065.81
% of national total3.216.924.644.90
Tab.7  The Shandong Peninsula conglomeration (2007)
Citypopulation/10,000 personsGDP/100 million yuanFDI/10,000 US $foreign imports and exports /100 million US $
Fuzhou6761,997132,400186.52
Xiamen2431,478327,200397.83
Putian283513.8125,50021.56
Quanzhou7742,367856,00068.52
Zhangzhou47480294,00046.49
Ningde3054092,8466.18
Total2,7557,566.811,437,946727.1
% of national total2.093.076.813.34
Tab.8  The southeast Fujian extended metropolitan areas (2008)
Fig.3  Distribution of CO emission intensity for each Province and Autonomous regions in 2006/ t·km
1 Earth Policy Institute. Carbon dioxide emissions accelerating rapidly. 2008. http://www.enn.com/press_releases/2435
2 NBSC. China Statistical Abstract. Beijing: China Statistics Press, 2008
3 Qu J S, Wang Q, Zeng J J. Regional analysis of CO2 emissions in China. Scientific Research Monitoring Express of the National Science Library of Chinese Academy , 2008, 12, 1–7
4 Gottmann J. Megalopolis, or the urbanization of the northeastern seaboard. Economic Geography , 1957, (3): 191
5 Friedman J. Miller J. The urban field. Journal of the American Institute of Planners , 1965, (31): 312–320
doi: 10.1080/01944366508978185
6 Doxiadis C A. Building Entopia. New York: Norton, 1975
7 Liangyong W. Introduction to Habitat Environmental Science. Beijing: China Building Industry Press, 2001, 48–49 (in Chinese)
8 Hall P. The World Cities. New York: McGraw-Hill, 1966
9 Friedmann J. The world city hypothesis. Development and Change , 1986, 17(1): 69–84
doi: 10.1111/j.1467-7660.1986.tb00231.x
10 Sassen S. The Global City: New York, London, Tokyo. Princeton: Princeton University Press, 1991
11 Castells M. The Rise of the Network Society. Society and Culture Vol I . UK: Blackwell, 1996
12 Scott A. Global City-Regions: Trends, Theory, Policy. Oxford: Oxford University Press, 2001
13 Hall P. Global City-Region in the 21st Century. In: Scott, A, Global City-Regions: Trends, Theory, Policy . Oxford: Oxford University Press, 2001, 59–77
14 Dicken P. Global Shift, 3rd Edition. London: Paul Chapman, 1998
15 Zhou Y X, Hu D P. The economic impact of City with county system: questionnaire survey. Economic Geography , 1991, 8(1): 8–14 (in Chinese)
16 Yao S M. China Urban Agglomerations. Hefei: China University of Technology Press, 1992
17 Yao S M, Chen Z G, Zhu Y M. Urban Agglomerations in China. Beijing: China Science and Technology Press, 2001
18 Zhang J X. The Spatial Combination of City Group. Nanjing: Southeast University Press, 2000
19 Wu L Y. To create a 21st century “new world paradise” — in Shanghai and its surrounding areas of space research to develop insights. Port Economy , 2002 (6): 6 (in Chinese)
20 Li H W. Global region in China: A case study of regional spatial development in Pearl River Delta area. Post-doctoral Research Report. Shanghai: Tongji University , 2005
21 Sit V, Cai J. Evolution of three metropolitan economic regions in China and their development strategy. Geographical Studies , 2003, 22(5): 532–533 (in Chinese)
22 Zou D C. China's major cities in mountain areas of planning and building research. The Chinese Academy of Engineering “Mountain City Area” Project Synthesis Report , 2008
23 Hu X W, Zhou Y X, Gu C L. Spatial Agglomeration and Diffusion of in China's Coastal Urbanized Area. Beijing: Science Press, 2000 (in Chinese)
24 Gu C L, Yu T F, Kam W C. Extended metropolitan area: new features of China’s metropolitan areas in the era of globalization. Planners , 2002, (2): 16–20 (in Chinese)
25 Gu C L, Chen L, Ding R. Globalization and the reconstruction of national urban systems. Geographical Science , 2005, 25(6): 641–654
26 Han S S. Shanghai: Between state and market in urban transformation. Urban Studies , 2000, 37(11): 2091–2112
doi: 10.1080/713707226
Viewed
Full text


Abstract

Cited

  Shared   
  Discussed