IntroductionRamberg and Osgood [ 1] first proposed an analytical formulation to describe the nonlinear behavior of material under compression and tension. Based on Ramberg and Osgood relations, numerous studies have been conducted to modify and improve the relationship to cover a wider range of strain for nonlinear materials under monotonic loads [ 2– 6] and to describe the stress-strain relationship at elevated temperature [ 7, 8]. Concerning hysteresis behavior, Skelton et al. [ 9] described the relationships between the various Masing-type models and the Ramberg-Osgood stress-strain response. A new link was established between the Ramberg-Osgood strength and cyclic hardening parameters. Broggiato et al. [ 10] also described the use of the Chaboche nonlinear kinematic hardening model for cyclic plasticity assessment. The tuned Chaboche model for elastoplastic material description was employed in the finite element simulation which was capable of following the cyclic elastoplastic response very closely up to large accumulated plastic strain levels. However, limited research [ 11] is conducted in the development of hysteresis stress-strain models based on Ramberg-Osgood relationships for structural carbon steel. This paper presents the calibration of the Ramberg-Osgood equations against a series of cyclic materials tests [ 12] and proposes a constitutive model to describe the material hysteresis performance.
CalibrationA series of experimental tests on steel coupons under monotonic and cyclic loadings were conducted by Chen et al. [12]. Mean measured dimensions and key results from direct tensile tests are summarized in Table 1. The specimens are categorized according to the material grade as shown in columns 1 and 2, measured yield strength, measured ultimate strength, ratio of yield to ultimate strengths and measured elongation are shown in columns 3 to 6 respectively. Further experimental details can be found in Chen et al. [ 12].
Tab.1
Tab.1
 Tab.1 Mean measured dimensions and key results from direct tensile tests| 1Group | 2Grade | 3yield strength fy/MPa | 4ultimate strength fu/MPa | 5 fy/ fu | 6elongation δ% |
|---|
| 1 | Q235C | 280 | 457 | 0.61 | 24.8 | | 2 | Q235B | 308 | 478 | 0.64 | 24.7 | | 3 | Q345B | 350 | 523 | 0.67 | 24.8 | | 4 | Q345B | 358 | 552 | 0.65 | 20.7 | | 5 | Q345B | 392 | 539 | 0.73 | 24.0 | | 6 | Q390C | 403 | 559 | 0.72 | 22.8 | | 7 | Q420D | 412 | 577 | 0.71 | 22.5 |
Notes: 1,2,3,4,5,6 mean the column | Tab.1 Mean measured dimensions and key results from direct tensile tests |
For the cyclic material tests, three different loading protocols 1) cyclic ascend 2) cyclic alternate and 3) cyclic tensile were employed as shown in Fig. 1. As shown in Fig. 1(a), cyclic ascend is a loading protocol with an equal strain increment of+/‒0.005 for each five-cycle loading phase up to+/- 0.02 strain amplitude. cyclic alternate refers to the loading scheme as shown in Fig. 1(b) which is similar to cyclic ascend, except the second and third loading phases were interchanged. The loading scheme of cyclic tensile is indicated in Fig. 1(c). All loadings are in tension and it oscillates incrementally up to 0.08 strain amplitude. Previous research [ 12] revealed that the loading protocols in particular between cyclic ascend and cyclic alternate affected the hysteresis behavior but the effect is minimal. This paper primarily focuses on the hysteresis response from cyclic ascend and cyclic alternate loading protocols.
Ramberg-Osgood modelThe most commonly used expression to describe nonlinear material stress-strain behavior is that proposed by Ramberg and Osgood [ 1] as shown in Eq. (1).
where,
σ and
ϵ are engineering stress and strain, respectively,
E is the material Young’s modulus which was taken as 2 × 10
5 N/mm
2 in this study,
n is a strain hardening exponent and
K is a modular parameter. Grouping terms, Eq. (1) can be simplified to
where
.
The corresponding data pairs are σ i and ϵ i - σ i/ E where i = 1, 2, 3, …….. k. Given that
and adopting the least-square method, the target is to minimize the following function to obtain an optimum pair of modular parameter
K and strain-hardening exponent
n.
From
| (6a) |
It can be deduced
| (6b) |
As K and n are both nonzeros, Eq. (6)b can be further simplified to
| (7) |
For a given set of σ i, ϵ i ( i = 1,2,…., k), the corresponding K and n parameters can then be determined.
Cyclic stress-strain curvesFrom Chen et al. [ 12], typical hysteresis loops are shown in Fig. 2. The hysteresis loops for Group 1 specimens under cyclic ascend (1-1) and cyclic alternate (1-2) loading protocol are shown in Figs. 2(a) and 2(b) respectively.
In general, the hysteresis loops are bi-symmetric, therefore, to simplify the calibration process against Ramberg-Osgood equations, the hysteresis loops in the first quadrant (I) are calibrated and the calibration results are shown in Tables 2 to 8.
Tab.2
Tab.2
Tab.2 Group 1 specimens Ramberg-Osgood parameters| parameters | specimen designation | strain amplitude |
|---|
| 0.005 | 0.010 | 0.015 | 0.020 |
|---|
| K/MPa | 1-1 | 1076 | 1016 | 1025 | 1054 | | 1-2 | 1025 | 1053 | 1001 | 1048 | | n | 1-1 | 8.43 | 11.66 | 13.77 | 15.50 | | 1-2 | 9.66 | 12.68 | 15.72 | 17.59 | | r2 | 1-1 | 0.998 | 0.997 | 0.995 | 0.993 | | 1-2 | 0.999 | 0.996 | 0.994 | 0.995 |
| Tab.2 Group 1 specimens Ramberg-Osgood parameters |
Tab.3
Tab.3
Tab.3 Group 2 specimens Ramberg-Osgood parameters| parameters | specimen designation | strain amplitude |
|---|
| 0.005 | 0.010 | 0.015 | 0.020 |
|---|
| K/MPa | 2-1 | 1003 | 1032 | 1054 | 1071 | | 2-2 | 1118 | 1099 | 1058 | 1096 | | n | 2-1 | 9.06 | 10.94 | 12.52 | 13.30 | | 2-2 | 7.95 | 9.69 | 11.48 | 12.48 | | r2 | 2-1 | 0.997 | 0.998 | 0.997 | 0.997 | | 2-2 | 0.995 | 0.998 | 0.997 | 0.997 |
| Tab.3 Group 2 specimens Ramberg-Osgood parameters |
Tab.4
Tab.4
Tab.4 Group 3 specimens Ramberg-Osgood parameters| parameters | specimen designation | strain amplitude |
|---|
| 0.005 | 0.01 | 0.015 | 0.02 |
|---|
| K/MPa | 3-1 | 1146 | 1152 | 1159 | 1177 | | 3-2 | 1179 | 1211 | 1165 | 1177 | | n | 3-1 | 9.75 | 11.57 | 13.54 | 14.81 | | 3-2 | 9.13 | 11.17 | 13.24 | 14.46 | | r2 | 3-1 | 0.998 | 0.998 | 0.997 | 0.997 | | 3-2 | 0.993 | 0.998 | 0.997 | 0.997 |
| Tab.4 Group 3 specimens Ramberg-Osgood parameters |
Tab.5
Tab.5
Tab.5 Group 4 specimens Ramberg-Osgood parameters| parameters | specimen designation | strain amplitude |
|---|
| 0.005 | 0.010 | 0.015 | 0.020 |
|---|
| K/MPa | 4-1 | 1260 | 1263 | 1256 | 1263 | | 4-2 | 1270 | 1269 | 1268 | 1282 | | n | 4-1 | 8.49 | 10.14 | 11.84 | 12.95 | | 4-2 | 8.08 | 10.46 | 11.18 | 12.10 | | r2 | 4-1 | 0.998 | 0.998 | 0.997 | 0.997 | | 4-2 | 0.998 | 0.998 | 0.997 | 0.997 |
| Tab.5 Group 4 specimens Ramberg-Osgood parameters |
Tab.6
Tab.6
Tab.6 Group 5 specimens Ramberg-Osgood parameters| parameters | specimen designation | strain amplitude |
|---|
| 0.005 | 0.010 | 0.015 | 0.020 |
|---|
| K/MPa | 5-1 | 1138 | 1143 | 1137 | 1142 | | 5-2 | 1141 | 1177 | 1145 | 1159 | | n | 5-1 | 10.98 | 11.19 | 13.23 | 14.42 | | 5-2 | 11.20 | 11.31 | 13.84 | 15.11 | | r2 | 5-1 | 0.995 | 0.998 | 0.996 | 0.996 | | 5-2 | 0.995 | 0.997 | 0.997 | 0.997 |
| Tab.6 Group 5 specimens Ramberg-Osgood parameters |
Tab.7
Tab.7
Tab.7 Group 6 specimens Ramberg-Osgood parameters| parameters | specimen designation | strain amplitude |
|---|
| 0.005 | 0.010 | 0.015 | 0.020 |
|---|
| K/MPa | 6-1 | 1320 | 1318 | 1309 | 1317 | | 6-2 | 1315 | 1380 | 1307 | 1315 | | n | 6-1 | 8.95 | 9.40 | 10.69 | 11.42 | | 6-2 | 8.83 | 8.89 | 10.48 | 11.12 | | r2 | 6-1 | 0.996 | 0.998 | 0.997 | 0.997 | | 6-2 | 0.996 | 0.998 | 0.997 | 0.997 |
| Tab.7 Group 6 specimens Ramberg-Osgood parameters |
Tab.8
Tab.8
Tab.8 Group 7 specimens Ramberg-Osgood parameters| parameters | specimen designation | strain amplitude |
|---|
| 0.005 | 0.01 | 0.015 | 0.02 |
|---|
| K/MPa | 7-1 | 1250 | 1254 | 1246 | 1255 | | 7-2 | 1220 | 1242 | 1195 | 1209 | | n | 7-1 | 10.82 | 10.87 | 12.24 | 13.47 | | 7-2 | 10.80 | 11.28 | 13.75 | 14.96 | | r2 | 7-1 | 0.995 | 0.998 | 0.996 | 0.996 | | 7-2 | 0.996 | 0.998 | 0.997 | 0.996 |
| Tab.8 Group 7 specimens Ramberg-Osgood parameters |
Tables 2 to 8 show the calibrated parameters for Group 1 to 7 specimens under cyclic ascend and cyclic alternate loading protocols at different amplitudes. The coefficient of determination r2 between the experimental data and proposed hysteresis models are also tabulated.
As shown in the above tables, all coefficient of determination r2 are close to 1 showing close relation between experimental data and Ramberg-Osgood equations. Under different strain amplitudes, for example in Group 7 specimens (Table 8), the modular parameter K remains fairly constant while the strain-hardening exponent, n increases with the strain amplitude.
Proposed K‒ fy relationship A summary of modular parameters for hysteresis loops under cyclic ascend loading protocol is shown in Table 9.
Tab.9
Tab.9
Tab.9 Modular parameters for hysteresis loops| modular parameter K/MPa | specimen designation |
|---|
| 1-1 | 2-1 | 3-1 | 4-1 | 5-1 | 6-1 | 7-1 |
|---|
| maximum | 1076 | 1071 | 1177 | 1263 | 1143 | 1320 | 1255 | | minimum | 1016 | 1003 | 1146 | 1256 | 1137 | 1309 | 1246 | | mean Kmean | 1043 | 1040 | 1159 | 1261 | 1140 | 1316 | 1251 | | standard deviation | 27.46 | 29.38 | 13.43 | 3.32 | 2.94 | 4.83 | 4.11 | | COV | 0.026 | 0.028 | 0.016 | 0.003 | 0.003 | 0.004 | 0.003 |
| Tab.9 Modular parameters for hysteresis loops |
Tab.10 Modular parameter and yield strength relation| yield stress/MPa | Kmean/MPa | Kpredicted/MPa | Kmean/ Kpredicted |
|---|
| 280 | 1043 | 1033 | 1.01 | | 308 | 1040 | 1083 | 0.96 | | 350 | 1159 | 1159 | 1.00 | | 358 | 1261 | 1173 | 1.08 | | 392 | 1140 | 1234 | 0.92 | | 403 | 1316 | 1253 | 1.05 | | 412 | 1251 | 1269 | 0.99 |
| Tab.10 Modular parameter and yield strength relation |
As shown in the table, under different imposed strain amplitude, the variation of modular parameter K is minimal, for example for specimen 2-1, the maximum modular parameter is 1071 MPa while the minimum modular parameter is 1003 MPa, so an average value was used. It is also observed that as the yield stress increases, the modular parameter K displays an increasing trend. It is therefore proposed a linear relationship between modular parameter K and yield strength as follows:
The predicted K values show good correlation with the experimental results as summarized in Table 10.
Constitutive modelPrimary skeleton stress-strain curveBased on the discussion from Section 2, the proposed constitutive model of cyclic stress-strain behavior is summarized as follows:
| (9) |
where
K and
n can be evaluated based on the methodology as shown in Section 2.1 for cyclic ascend loading protocol.
Cyclic stress-strain curve | (10) |
where
σu,
ϵu are the unloading reference point at each cycle,
E is taken as 2 × 10
5 MPa,
K can be obtained from the relationship proposed in Eq. (8) and
n can be defined by the approach in Halford and Morrow [
13]. Hence, to define full hysteresis stress-strain behavior of structural carbon steel, two key parameters which are
K and
n are needed. The parameters
K and
n also depend on the strength of steel, and the latter changes significant with the increase of maximum strain.
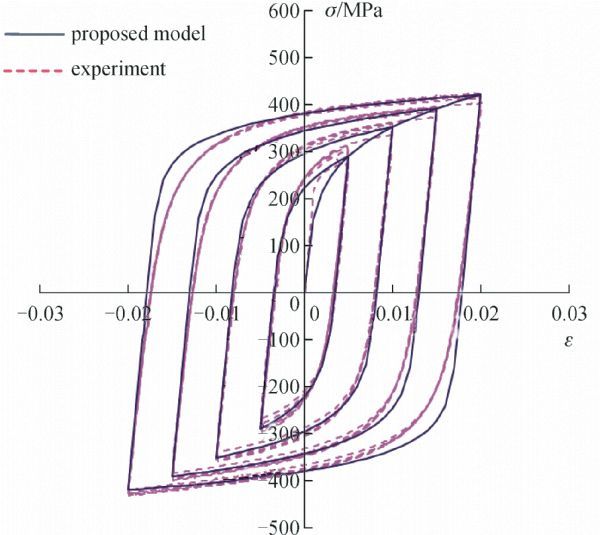
Based on Eqs. (9) and (10), the derived hysteresis stress-strain curves were compared with the experimental results. For Group 1 specimens, as shown before, the corresponding parameters are K = 1067 MPa (primary skeleton), n = 4.34 (primary skeleton), E = 2 × 10⁵ MPa and K = 1033 MPa (hysteresis behavior as shown in Table 10). For specimens under cyclic ascend loading protocol, the straining history is 0→0.005→-0.005→0.01→-0.01→0.015→-0.015→0.02→-0.02→0.02 and for specimens under cyclic alternate loading protocol, the straining history is 0→0.005→-0.005→0.015→-0.015→0.015→-0.01→0.01→-0.01→0.02→-0.02→0.02. The comparison between the proposed constitutive model and the experimental results are shown in Figs. 3 and 4.
The above figures revealed the proposed hysteresis models correlate closely with the experimental data. The proposed material stress-strain model can also capture the effect of different loading protocols. Figure 5 shows the hysteresis loops for Group 1 specimens under cyclic ascend (1-1) and cyclic alternate (1-2). The difference is indicated at strain amplitude of 0.01, the cyclic peak values for specimen 1-2 is greater than 1-1, which illustrates the effect of loading protocol but as discussed in Chen et al. [ 12], the effect is insignificant toward seismic applications.
In general, the calibrated Ramberg-Osgood equation shows excellent agreement with the experimental results on the primary skeleton and the cyclic stress-strain curves.
Application to Q460 specimensThe proposed constitutive model in Section 3 was calibrated by experimental coupons with nominal yield strengths between 235 to 420 MPa. To investigate their applicability to a higher grade of steel, this section presents the comparison between the proposed constitutive model and the experimental result on coupons with nominal yield strength of 460 MPa (Q460 specimens). The direct tensile tests from the additional Group 8 specimens were conducted by the Authors on Grade Q460E materials with the measured yield strength of 491 MPa, ultimate strength of 611 MPa, yield-ultimate strength ratio of 0.8 and the elongation of 22.7%. Other Group 9 specimens on Grade Q460C materials were tested by Shi et al. [ 14] with the reported yield strength of 466 MPa.
Based on the proposed constitutive models (Eqs. (8)‒(10)), Figs. 6 and 7 illustrate the comparison between the proposed models and the experimental observations which reveal close agreement between the two.
Numerical validationThis section presents a numerical study based upon the proposed constitutive model in Section 3.
Validation experimentThe validation experiment refers to a cyclic test of tubular column of steel grade Q235B with nominal yield strength of 235 N/mm2. The geometry of the test arrangement is shown in Fig. 8. The bottom part of the specimen was anchored to the strong floor facilities at the Structures laboratory of Tongji University. The loading was applied through the top part of the specimen under displacement-controlled loading scheme. The loading scheme (Displacement ratio Δ/Δ1 vs. number of cycle n) is shown in Fig. 9 which is similar to the cyclic ascend loading protocol as shown in Fig. 1(a). As shown in Fig. 9, Δ1 (0.7 mm) is the yield displacement. Further experimental details are presented in Zhao et al. [ 15].
Numerical simulationA numerical modeling investigation, employing the finite element (FE) package ABAQUS [ 16], was carried out to replicate the experimental results based on the proposed constitutive model in Section 3. The element chosen for the FE model was a general purpose linear brick element, with reduced integration, designated as C3D8R in the ABAQUS element library. The mesh density was carefully chosen by carrying out a mesh convergence study with the aim of achieving accurate results while minimizing computational effort. The meshed finite element model is shown in Fig. 10.
The true material stress-strain relationships were generated from the engineering stress-strain curves obtained from the tensile coupon tests and cyclic coupons [ 12]. A kinematic/isotropic combined model [ 16] was employed in which the kinematic hardening parameters employed were determined through the full stress-strain response of specimen 1-1 from Eqs. (8) and (9) under four different strain amplitudes. Boundary conditions were applied to the model fixed end support conditions at both ends but allowing free vertical displacement at the top. The vertical displacement at top end was monitored throughout the analysis. Geometric and material nonlinearity was incorporated in the models which also enabled the cyclic behavior to be traced. The numerical derived hysteresis curves are shown in Fig. 11 and are compared with the corresponding experimental hysteresis results. Replication of test results was found to be satisfactory with the numerical models able to successfully capture the initial primary stress-strain behavior and general hysteresis response.


