Please wait a minute...
Frontiers of Chemical Science and Engineering

ISSN 2095-0179

ISSN 2095-0187(Online)

CN 11-5981/TQ

Postal Subscription Code 80-969

2018 Impact Factor: 2.809

Front. Chem. Sci. Eng.    2015, Vol. 9 Issue (3) : 386-406    https://doi.org/10.1007/s11705-015-1533-3
RESEARCH ARTICLE
Real time monitoring of bioreactor mAb IgG3 cell culture process dynamics via Fourier transform infrared spectroscopy: Implications for enabling cell culture process analytical technologyŽ 
Huiquan Wu1,2(), Erik Read3, Maury White1, Brittany Chavez3, Kurt Brorson3, Cyrus Agarabi1, Mansoor Khan1
1. Division of Product Quality Research (DPQR, HFD-940), Office of Testing and Research (OTR), Office of Pharmaceutical Quality (OPQ), Center for Drug Evaluation and Research (CDER), US Food and Drug Administration (FDA), Federal Research Center at White Oak, 10903 New Hampshire Ave, Silver Spring, MD 20993, USA
2. Process Assessment Branch II, Division of Process Assessment 1 (DPA 1), Office of Process and Facilities (OPF), Office of Pharmaceutical Quality (OPQ), Center for Drug Evaluation and Research (CDER), US Food and Drug Administration (FDA), Federal Research Center at White Oak, 10903 New Hampshire Ave, Silver Spring, MD 20993, USA
3. Division of Biotechnology Review and Research II (DBRRII), Office of Biotechnology Products (OBP), Office of Pharmaceutical Quality (OPQ), Center for Drug Evaluation and Research (CDER), US Food and Drug Administration (FDA), Federal Research Center at White Oak, 10903 New Hampshire Ave, Silver Spring, MD 20993, USA
 Download: PDF(1100 KB)   HTML
 Export: BibTeX | EndNote | Reference Manager | ProCite | RefWorks
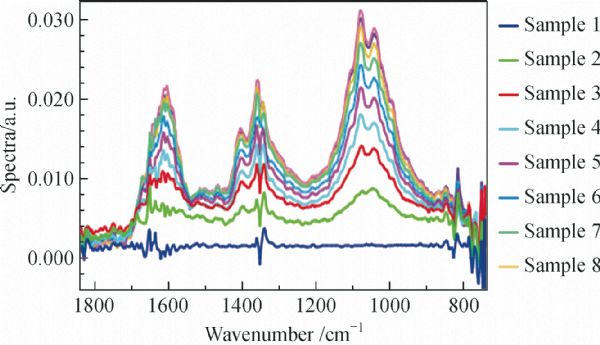
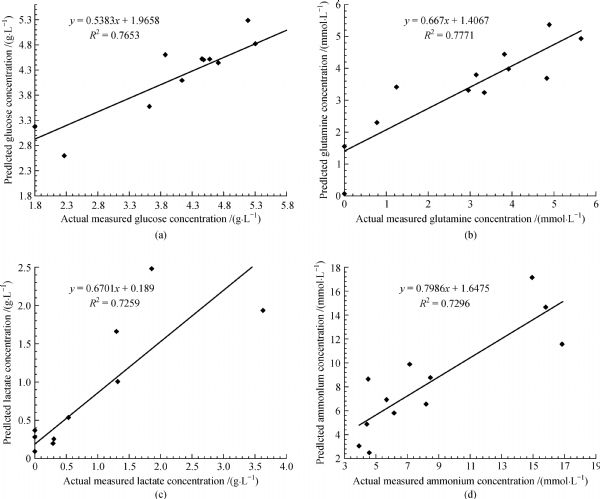
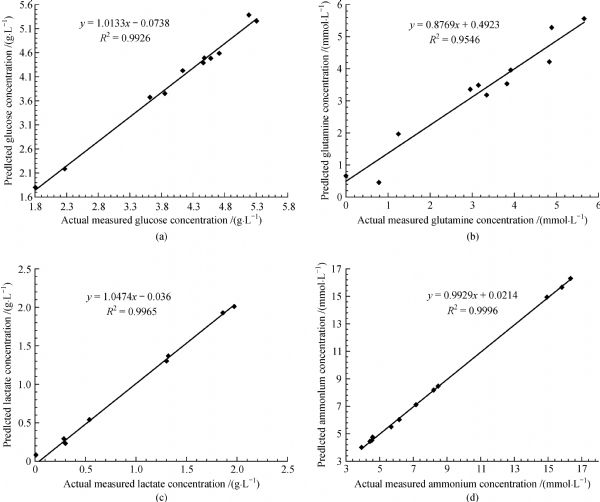
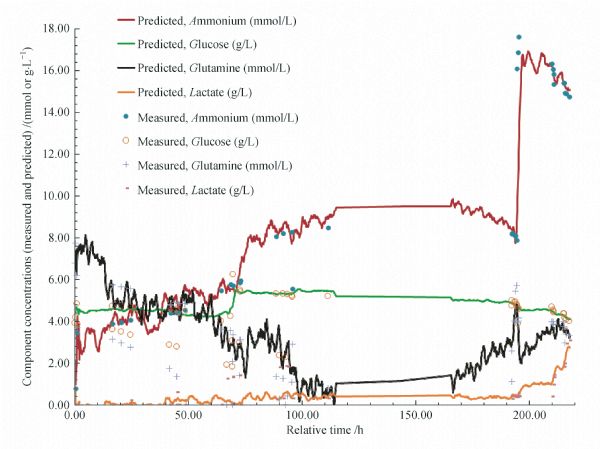
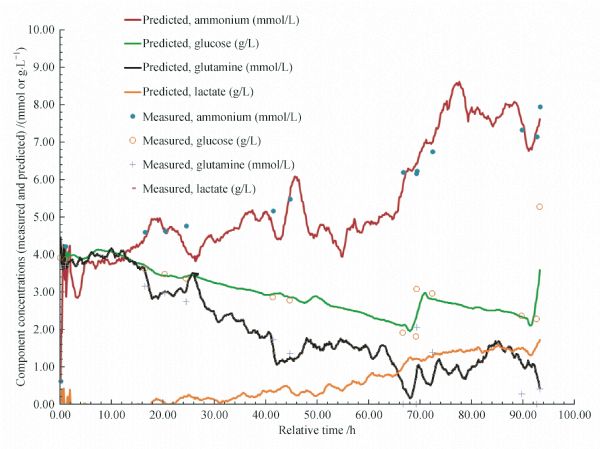
Abstract

Compared to small molecule process analytical technology (PAT) applications, biotechnology product PAT applications have certain unique challenges and opportunities. Understanding process dynamics of bioreactor cell culture process is essential to establish an appropriate process control strategy for biotechnology product PAT applications. Inline spectroscopic techniques for real time monitoring of bioreactor cell culture process have the distinct potential to develop PAT approaches in manufacturing biotechnology drug products. However, the use of inline Fourier transform infrared (FTIR) spectroscopic techniques for bioreactor cell culture process monitoring has not been reported. In this work, real time inline FTIR Spectroscopy was applied to a lab scale bioreactor mAb IgG3 cell culture fluid biomolecular dynamic model. The technical feasibility of using FTIR Spectroscopy for real time tracking and monitoring four key cell culture metabolites (including glucose, glutamine, lactate, and ammonia) and protein yield at increasing levels of complexity (simple binary system, fully formulated media, actual bioreactor cell culture process) was evaluated via a stepwise approach. The FTIR fingerprints of the key metabolites were identified. The multivariate partial least squares (PLS) calibration models were established to correlate the process FTIR spectra with the concentrations of key metabolites and protein yield of in-process samples, either individually for each metabolite and protein or globally for all four metabolites simultaneously. Applying the 2nd derivative pre-processing algorithm to the FTIR spectra helps to reduce the number of PLS latent variables needed significantly and thus simplify the interpretation of the PLS models. The validated PLS models show promise in predicting the concentration profiles of glucose, glutamine, lactate, and ammonia and protein yield over the course of the bioreactor cell culture process. Therefore, this work demonstrated the technical feasibility of real time monitoring of the bioreactor cell culture process via FTIR spectroscopy. Its implications for enabling cell culture PAT were discussed.

Keywords process analytical technology (PAT)      Fourier-transform infrared (FTIR) spectroscopy      partial least squares (PLS) regression      mouse IgG3      bioreactor cell culture process      real time process monitoring     
Corresponding Author(s): Huiquan Wu   
Online First Date: 24 September 2015    Issue Date: 30 September 2015
 Cite this article:   
Huiquan Wu,Erik Read,Maury White, et al. Real time monitoring of bioreactor mAb IgG3 cell culture process dynamics via Fourier transform infrared spectroscopy: Implications for enabling cell culture process analytical technologyŽ [J]. Front. Chem. Sci. Eng., 2015, 9(3): 386-406.
 URL:  
https://academic.hep.com.cn/fcse/EN/10.1007/s11705-015-1533-3
https://academic.hep.com.cn/fcse/EN/Y2015/V9/I3/386
Dose # Calculated glutamine concentration, C cal /(mmol·L−1) Measured glutamine concentration by Nova, C Nova /(mmol·L−1) Data preprocessing algorithms applied PLS modeling results based on C cal PLS modeling results based on C Nova
1 0 0 Spectral block: User specified region: 1900 to 900?cm−1; single point B/L @ Zero; mean center.
Component concentration block: Mean center
Calibration model R 2 = 0.9652
Leave-one-out cross validation model R 2 = 0.8849
PLS latent variables based on RMSEC vs. factors : 3 factors
Calibration model R 2 = 0.9225
Leave-one-out cross validation model R 2 = 0.8064
PLS latent variables based on RMSEC vs. factors : 3 factors
2 1 2.605
3 2 3.055
4 3 4
5 4 4.56
6 5 5.67
7 6 6.04
8 7 6.37
9 8 6.6
Tab.1  Accumulated glutamine concentrations in the medium during the stepwise addition of glutamine—measurement and prediction
Component & data preprocessing algorithm Concentration Range Specific Wavenumber Range/cm−1 Number of PLS latent variables Calibration PLS model merits of figure Characteristic Peaks /cm−1 Identified (without applying the 2nd derivative preprocessing)
FTIR spectra block Baseline correction; Mean center Baseline correction; 2nd derivative; Mean center Baseline correction; Mean center; No 2nd derivative applied Baseline correction; Mean center 2nd derivative applied No 2nd derivative applied 2nd derivative applied
R 2 RMSEC RMSECV R 2 RMSEC RMSECV
Glucose 0.7?21?g?L−1 1200−1000 1800−1000 9 3 1 0.935 0.983 2.24 1394, 1625
Glutamine 0.7?21?mmol?L−1 1780−1000 1800−1300 11 4 1 9.79E-4 0.945 0.995 0.393 3.15 1401, 1573, 1658, 1692
Ammonia 0.7?21?mmol?L−1 1850−750 1850−750 6 4 0.993 0.69 4.34 0.984 1.07 6.07 1397, 1871, 1886
Lactate 1?30?g?L−1 1900−900 1800−1000 7 5 0.999 0.135 1.95 0.997 0.307 2.21 865, 1010, 1125, 1144, 1394, 1416, 1662
Tab.2  FTIR calibration model results for pure components of cell culture media in water at 37°C
Fig.1  FTIR spectroscopy responses to the stepwise additions of base CD hybridoma media with 40?mL of concentrated glutamine solution to the bioreactor. Legends in the Figure: Sample 1, water; Sample 2, after the 1st addition of 40?mL concentrated dose of glutamine; Sample 3, after the 2nd addition of 40?mL concentrated dose of glutamine; Sample 4, after the 3rd addition of 40?mL concentrated dose of glutamine; Sample 5, after the 4th addition of 40?mL concentrated dose of glutamine; Sample 6, after the 5th addition of 40?mL concentrated dose of glutamine; Sample 7, after the 6th addition of 40?mL concentrated dose of glutamine; Sample 8, after the 7th addition of 40?mL concentrated dose of glutamine
Component Calculated concentration range covered Number of PLS latent variables PLS calibration model R 2
concentration based on component weight concentration based on NOVA data of in-process samples
Glucose /(g·L−1) 6−8.04 3 0.9954 0.9996
Glutamine /(mmol·L−1) 0−8 3 0.9652 0.9225
Lactate /(g·L−1) 0−20 3 0.9988 0.9982
Ammonia /(mmol·L−1) 0−10 3 0.7677 0.6956
Tab.3  PLS model results for stepwise addition of individual components to base media in uninoculated bioreactor at constant temperature
Fig.2  (a) Process trajectory for a representative bioreactor cell culture process and IgG3 production; (b) Glutamine, glutamate, glucose, lactate, ammonia concentrations measured throughout the cell culture by Nova nutrient analyzer
Batch # T spectra acquired/h Spectra included in calibration? Spectra included in test? Glutamine /(mmol·L−1) Glucose /(g·L−1) Lactate/(g·L−1) Ammonium /(mmol·L−1)
A 0.38 Yes 7.72 4.17 0.01 0.79
A 0.88 Yes 6.17 4.84 0.01 3.45
A 16.43 Yes 5.74 4.71 0.01 3.88
A 20.43 Yes 5.65 4.72 0.01 3.94
A 24.43 Yes 5.54 4.7 0.01 4.06
A 41.93 Yes 4.78 4.57 0.01 4.39
A 44.43 Yes 4.89 4.58 0.01 4.45
A 45.60 Yes 4.84 4.46 0.01 4.4
A 48.43 Yes 4.83 4.46 0.01 4.54
A 64.43 Yes 3.6 3.99 0.01 5.47
A 68.43 Yes 3.56 4.25 0.01 5.77
A 69.43 Yes 3.34 6.23 0.01 5.7
A 72.43 Yes 3.12 5.5 0.01 5.85
A 72.77 Yes 3.11 5.42 0.01 5.93
A 88.42 Yes 1.34 5.32 0.26 8.05
A 91.42 Yes 1.25 5.31 0.29 8.21
A 95.25 Yes 1.07 5.24 0.3 8.28
A 111.42 Yes 0.78 5.19 0.3 8.48
A 192.03 Yes 1.12 4.75 0.26 8.22
A 192.20 Yes 2.57 5 0.38 8.18
A 193.20 Yes 4 4.91 0.4 8.13
A 193.87 Yes 5.43 4.93 0.36 8.1
A 194.20 Yes 5.7 4.76 0.35 7.87
A 194.37 Yes 4 4.8 0.41 16.1
A 194.87 Yes 3.92 3.88 0.54 16.865
A 195.03 Yes 4.01 4.63 0.38 17.63
A 195.20 Yes 4.15 4.58 0.41 18.76
A 209.78 Yes 3.96 4.69 0.4 16.33
A 210.28 Yes 3.97 4.54 0.96 16.05
A 210.45 Yes 3.82 4.48 1.3 15.82
A 210.62 Yes 3.85 4.42 1.44 15.34
A 214.95 Yes 3.96 4.36 1.83 15.41
A 215.28 Yes 3.74 4.35 1.97 15.4
A 215.62 Yes 2.96 4.14 3.63 14.94
A 215.95 Yes 3.37 4.07 2.93 14.91
A 217.45 Yes 3.32 4.01 3.08 14.76
B 0.05 Yes 6.79 3.9 0 0.63
B 1.00 Yes 3.7 3.86 0 4.22
B 16.50 Yes 3.15 3.62 0 4.6
B 20.38 Yes 2.97 3.48 0 4.64
B 24.55 Yes 2.74 3.35 0.21 4.77
B 41.38 Yes 1.72 2.86 0 5.18
B 44.72 Yes 1.35 2.78 0.61 5.49
B 66.71 Yes 0 1.9 1.26 6.21
B 69.22 Yes 0 1.81 1.32 6.18
B 69.38 Yes 2.06 3.08 1.33 6.24
B 72.38 Yes 1.39 2.95 1.41 6.75
B 89.88 Yes 0.27 2.36 1.78 7.34
B 92.71 Yes 0 2.27 1.86 7.16
B 93.38 Yes 0.41 5.28 1.81 7.96
Tab.4  Calibration dataset and testing dataset for correlating process FTIR spectra with nutrients’ concentrations at various time points during bioreactor mAb IgG3 cell culture process of two independent batches
Fig.3  Key metabolite concentration prediction results from the global PLS calibration models using 7 PLS factors for the bioreactor cell culture process of batch A and batch B. (a) Glucose; (b) Glutamine; (c) Lactate; (d) Ammonium
Fig.4  Key metabolite concentration prediction results from the individual PLS calibration models for the bioreactor cell culture process for batch A and batch B. (a) Glucose, 4 PLS factors; (b) Glutamine, 7 PLS factors; (c) Lactate, 14 PLS factors; (d) Ammonium, 20 PLS factors
Model type Global PLS model for simultaneously prediction of four components Individual PLS model for prediction of each component separately
Nutrient component Glucose /g·L−1 Glutamine /mmol·L−1 Lactate/g·L−1 Ammonium /mmol·L−1 Glucose /g·L−1 Glutamine /mmol·L−1 Lactate /mmol·L−1 Ammonium /mmol·L-1
Spectral data preprocessing algorithm Mean center; 2nd derivative; variance scale Mean center; 2nd derivative Mean center; 2nd derivative; variance scale Mean center; 2nd derivative Mean center; 2nd derivative
User specified wave length regions 2000 to 600, single point baseline correction (B/L) @ 1300 1200 to 1000, B/L @Zero 1780 to 1000, B/L@ Zero 1850 to 1000, B/L @ Zero 1400 to 750, B/L@ Zero
Nutrient data treatment Mean center; variance scale Mean center Mean center; 2nd derivative; variance scale Mean center Mean center
Number of latent variables 7 4 7 14 20
RMSEC 0.278 0.912 0.324 1.43 0.134 0.58 0.0559 0.0973
RMSECV 0.615 1.56 0.445 2.46 0.168 0.972 0.282 1.41
RMSEP 0.679 1.06 0.586 2.5 N/A N/A N/A N/A
R 2 (Cumulative) 0.898 0.751 0.851 0.918 0.979 0.894 0.995 0.999
R c a l i b r a t i o n 2 0.8979 0.7512 0.8506 0.9184 0.9789 0.8943 0.9950 0.9995
R c r o s s ? ? v a l i d a t i o n 2 0.7179 0.5047 0.8428 0.8669 0.9830 0.8155 0.9009 0.9447
R t e s t i n g 2 0.6978 0.7037 0.7177 0.7230 N/A N/A N/A N/A
Tab.5  Comparison of the global PLS model and the individual PLS model for concentration predictions of four key cell culture metabolites: PLS model calibration, cross validation, and testing results a)
Number of PLS latent variables selected Model performance matrix Glucose /(g·L−1) Glutamine /(mmol·L−1) Lactate /(g·L−1) Ammonium /(mmol·L−1)
4 RMSEC 1.12 0.537 0.367 2.28
RMSECV 1.56 0.651 0.452 2.77
RMSEP 1.27 0.683 0.587 1.91
R 2 (Cumulative) 0.627 0.619 0.808 0.791
Mahalanobis distance: 95% limit 0.71
5 RMSEC 0.918 0.533 0.325 2.27
RMSECV 1.59 0.699 0.448 2.8
RMSEP 1.06 0.71 0.591 1.9
R 2 (Cumulative) 0.748 0.625 0.849 0.792
Mahalanobis distance: 95% limit 1.15
6 RMSEC 0.913 0.321 0.324 2.13
RMSECV 1.53 0.606 0.448 2.73
RMSEP 1.05 0.693 0.586 2.05
R 2 (Cumulative) 0.751 0.863 0.851 0.819
Mahalanobis distance: 95% limit 1.64
Tab.6  Effect of number of PLS latent variables on the global PLS model performance matrix after FTIR spectra had been subjected to the 2nd derivative preprocessing algorithm. (Data treatments for the FTIR spectra block including mean center, variance scale, 2nd derivative, user specified regions: 2000 to 660?cm−1, single point baseline @ 1300?cm−1; data treatments for the component concentration block including mean center and variance scale; quantitative analysis: leave-one-out (38 samples) cross-validation; F test statistic: 95% limit= 1.13, warn if>1.13)
Fig.5  The prediction results from individual PLS calibration models for each component in the bioreactor cell culture media for batch A in comparison with the experimental data. (a) Glucose; (d) Glutamine; (c) Lactate; (d) Ammonium (Note: batch monitoring disruption occurred due to unanticipated power supply disruption during the timeframe of 120?168?h. Extrapolated data were used to bridge the gap.)
Fig.6  The prediction results from individual PLS calibration models for each component in the bioreactor cell culture media for a batch B carried out at a different time in comparison with the experimental data. (a) Glucose; (d) Glutamine; (c) Lactate; (d) Ammonium
Batch # T spectra acquired /h Spectra included in calibration? Spectra included in testing? mAb concentration /(mg·mL−1)
A 0.38 Yes 0
A 0.88 Yes 0
A 16.43 Yes 0
A 20.43 Yes 0
A 24.43 Yes 0.7843
A 41.93 Yes 2.22
A 44.43 Yes 3.16
A 48.43 Yes 4.34
A 69.43 Yes 9.07
A 72.43 Yes 10.3
A 88.42 Yes 12.3
A 91.42 Yes 12.4
A 95.25 Yes 11.9
A 111.42 Yes 12
B 0.05 Yes 0
B 1.05 Yes 0
B 16.55 Yes 0
B 20.38 Yes 0
B 24.55 Yes 0
B 41.38 Yes 0
B 66.72 Yes 0.62
B 69.22 Yes 0.67
B 69.38 Yes 0.66
B 72.38 Yes 0.74
B 89.88 Yes 2.3
B 92.72 Yes 2.32
B 93.38 Yes 2.31
Tab.7  Calibration dataset and testing dataset for correlating process FTIR spectra with the mAb concentration at various time points during bioreactor mAb IgG3 cell culture process
Model type PLS PLS PLS PLS
Protein A measured result mAb mAb mAb mAb
FTIR spectral data preprocessing algorithm Mean center Mean center Mean center; 2nd derivative Mean center; 2nd derivative
User specified wave length regions 1900 to 796?cm−1, Single point baseline correction @1900?cm−1 1277 to 796?cm−1, Single point baseline correction @1277?cm−1 1900 to 796?cm−1, Single point baseline correction @1900?cm−1 1277 to 796?cm−1, Single point baseline correction @1277?cm−1
mAb data treatment Mean center Mean center Mean center Mean center
Method of determining PLS latent variables Minimum PRESS Minimum PRESS Minimum PRESS Minimum PRESS
Number of latent variables 7 9 4 4
Number of data points for calibration 22 22 22 22
Number of data points for testing 5 5 5 5
RMSEC /g·L−1 0.335 0.12 1.28 0.842
RMSECV /g·L−1 1.14 0.893 1.93 1.68
RMSEP /g·L−1 1.2 0.698 3.48 1.44
R C u m u l a t i v e 2 0.995 0.999 0.922 0.966
R c a l i b r a t i o n 2 0.995 0.999 0.922 0.966
R t e s t i n g 2 0.943 0.981 0.519 0.918
R c r o s s ? ? v a l i d a t i o n 2 0.968 0.980 0.903 0.930
Tab.8  Comparison of the PLS models’ figures of merits for correlating process FTIR spectra with the absolute concentrations of IgG3 antibody at various time points during the bioreactor cell culture process
Fig.7  The prediction results from PLS calibration model for mAb concentrations produced at various time points during the bioreactor cell culture process for batch A and batch B. (a) 7 PLS factors, model built based on specific regions from 1900 to 796?cm−1, region to single point baseline @ 1900?cm−1. (b) 9 PLS factors, model built based on specific regions from 1277 to 796?cm−1, region to single point baseline @ 1277?cm−1
Dose # Amount of glucose added /mg Calculated glucose concentration/g•L-1
1 350 0.7
2 350 1.4
3 350 2.1
4 350 2.8
5 350 3.5
6 350 4.2
7 350 4.9
8 350 5.6
9 350 6.3
10 350 7
11 1750 10.5
12 1750 14
13 3500 21
  Table A1 Accumulated glucose concentrations in the binary system after each dose
Dose # Amount of glutamine added /mg Calculated Concentration/mmol•L-1
1 51 0.872
2 51 1.396
3 51 2.094
4 51 2.792
5 51 3.490
6 51 4.188
7 51 4.886
8 51 5.584
9 51 6.282
10 51 6.932
11 255 10.469
12 255 13.959
13 511 20.953
  Table A2 Accumulated glutamine concentrations in the binary system after each dose
Dose # Amount of Lactic acid added /mg Calculated lactate concentration/mmol•L-1
1 31.9 0.708
2 31.9 1.417
3 30.5 2.094
4 32.1 2.806
5 31.9 2.837
6 30.4 4.190
7 30.8 4.873
8 32 5.584
9 30.6 6.263
10 32.7 6.989
11 159.4 10.528
12 156.2 14.067
13 315.2 21.066
  Table A3 Accumulated lactate concentrations in the binary system after each dose
Dose # Amount of ammonium chloride added /mg Calculated ammonium concentration/mmol•L-1
1 26.7 0.998
2 26.7 1.997
3 26.7 2.995
4 26.7 3.993
5 26.7 4.991
6 26.7 5.990
7 26.7 6.988
8 53.4 8.985
9 26.7 9.983
10 133.5 14.974
11 133.5 19.966
12 267 29.949
  Table A4 Accumulated ammonium concentrations in the binary system after each dose
Dose # Calculated glucose concentration, Ccal/g·L−1 Measured glucose concentration by Nova, CNova /g·L−1 Data preprocessing algorithms applied PLS modeling results based on Ccal PLS modeling results based on CNova
1 6 N/A Spectral block: User specified region: 1900 to 900?cm−1; single point B/L @ Zero; mean center.
Component concentration block: Mean center
Calibration model R2 = 0.9954
Leave-one-out cross validation model R2 = 0.5785
PLS latent variables based on RMSEC vs. factors: 3 factors
Calibration model R2 = 0.9996
Leave-one-out cross validation model R2 = 0.3680
PLS latent variables based on RMSEC vs. factors: 3 factors
2 6 N/A
3 6.04 4.12
4 6.08 4.4
5 6.58 5.37
6 7.07 5.80
7 7.56 6.38
8 8.04 6.95
  Table A5 Accumulated glucose concentrations in the medium during the stepwise addition of glucose—measurement and prediction
Dose # Calculated lactate concentration, C cal/g·L−1 Measured lactate concentration by Nova, C Nova/g·L−1 Data preprocessing algorithms applied PLS modeling results based on C cal PLS modeling results based on C Nova
1 0 0 Spectral block: User specified region: 1900 to 900?cm−1; single point B/L @ Zero; mean center.
Component concentration block: Mean center
Calibration model R 2 = 0.9988
Leave-one-out cross validation model R 2 = 0.8638
PLS latent variables based on RMSEC vs. factors: 3 factors
Calibration model R 2 = 0.9982
Leave-one-out cross validation model R 2 = 0.9230
PLS latent variables based on RMSEC vs. factors: 3 factors
2 4 0.59
3 8 1.16
4 12 1.53
5 16 1.84
6 20 2.16
  Table A6 Accumulated lactate concentrations in the medium during the stepwise addition of lactic acid—measurement and prediction
Dose # Calculated ammonium concentration, C cal/mmol·L−1 Measured ammonium concentration by Nova, C Nova/mmol·L−1 Data preprocessing algorithms applied PLS modeling results based on C cal PLS modeling results based on C Nova
1 0 0 Spectral block: User specified region: 1900 to 900?cm−1; single point B/L @ Zero; mean center.
Component concentration block: Mean center
Calibration model R 2 = 0.7677;
Leave-one-out cross validation model R 2 = 0.6822;
PLS latent variables based on RMSEC vs. factors: 1 factor
Calibration model R 2 = 0.6956;
Leave-one-out cross validation model R 2 = 0.5196;
PLS latent variables based on RMSEC vs. factors: 1 factor
2 2 2.99
3 4 4.98
4 6 8.24
5 8 9.27
6 10 12.95
  Table A7 Accumulated ammonium concentrations in the medium during the stepwise addition of ammonium chloride—measurement and prediction
1 FDA/ICH. Guidance for Industry Q11 Development and Manufacture of Drug Substances. FDA, 2012.
2 FDA. Guidance for Industry PAT—A Framework for Innovative Pharmaceutical Development, Manufacturing, and Quality Assurance. FDA, 2004.
3 FDA. Advancing Regulatory Science at FDA: A Strategic Plan. FDA, 2011.
4 H Q Wu, M A Khan, A S Hussain. Process control perspective for process analytical technology: Integration of chemical engineering practice into semiconductor and pharmaceutical industries. Chemical Engineering Communications, 2007, 194(6): 760–779
https://doi.org/10.1080/00986440601098755
5 E K Read, J T Park, R B Shah, B S Riley, K A Brorson, A S Rathore. Process analytical technology (PAT) for biopharmaceutical products: Part I. Concepts and applications. Biotechnology and Bioengineering, 2010, 105(2): 276–284
https://doi.org/10.1002/bit.22528
6 J Glassey, K V Gernaey, C Clemens, T W Schulz, R Oliveira, G Striedner, C F Mandenius. Process analytical technology (PAT) for biopharmaceuticals. Biotechnology Journal, 2011, 6(4): 369–377
https://doi.org/10.1002/biot.201000356
7 L L Simon, H Pataki, G Marosi, F Meemken, K Hungerbühler, A Baiker, S Tummala, B Glennon, M Kuentz, G Steele, H J M Kramer, J W Rydzak, Z Chen, J Morris, F Kjell, R Singh, R Gani, K V Gernaey, M Louhi-Kultanen, J O’Reilly, N Sandler, O Antikainen, J Yliruusi, P Frohberg, J Ulrich, R D Braatz, T Leyssens, M von Stosch, R Oliveira, R B H Tan, H Wu, M Khan, D O’Grady, A Pandey, R Westra, E Delle-Case, D Pape, D Angelosante, Y Maret, O Steiger, M Lenner, K Abbou-Oucherif, Z K Nagy, J D Litster, V K Kamaraju, M S Chiu. Assessment of recent process analytical technology (PAT) trends: A multiauthor review. Organic Process Research & Development, 2015, 19(1): 3–62
https://doi.org/10.1021/op500261y
8 H Wu, Z Dong, H Li, M A Khan. An integrated process analytical technology (PAT) approach for pharmaceutical crystallization process understanding to ensure product quality and safety: FDA scientist’s perspective. Organic Process Research & Development, 2015, 19(1): 89–101
https://doi.org/10.1021/op500056a
9 H Wu, E Heilweil, A S Hussain, M A Khan. Process analytical technology (PAT): Quantification approaches in Terahertz spectroscopy for pharmaceutical application. Journal of Pharmaceutical Sciences, 2007, 97(2): 970–984
https://doi.org/10.1002/jps.21004
10 H Wu, M A Khan. THz spectroscopy: An emerging technology for pharmaceutical development and pharmaceutical process analytical technology (PAT) applications. Journal of Molecular Structure, 2012, 1020: 112–120
https://doi.org/10.1016/j.molstruc.2012.04.019
11 H Wu, M A Khan. Quality-by-design (QbD): An integrated approach for evaluation of powder blending process kinetics and determination of powder blending end-point. Journal of Pharmaceutical Sciences, 2009, 98(8): 2784–2798
https://doi.org/10.1002/jps.21646
12 H Wu, M White, M A Khan. An integrated process analytical technology (PAT) approach for process dynamics-related measurement error and process design space development for a pharmaceutical powder blending bed. Organic Process Research & Development, 2015, 19(1): 215–226
https://doi.org/10.1021/op500085m
13 H Wu, M White, M A Khan. Quality-by-design (QbD): An integrated process analytical technology (PAT) approach for a dynamic pharmaceutical co-precipitation process characterization and process design space development. International Journal of Pharmaceutics, 2011, 405(1-2): 63–78
https://doi.org/10.1016/j.ijpharm.2010.11.045
14 H Wu, M White, R Berendt, R Foringer, M A Khan. An integrated PAT approach for nucleation induction time measurement and nucleation mechanism assessment for a dynamic multi-component pharmaceutical antisolvent crystallization system. Industrial & Engineering Chemistry Research, 2014, 53(4): 1688–1701
https://doi.org/10.1021/ie4036466
15 H Wu, R C Lyon, M A Khan, R Voytilla, J Drennen III. Integration of near-infrared spectroscopy and mechanistic modeling for predicting film-coating and dissolution of modified release tablets. Industrial & Engineering Chemistry Research. Accepted for publication on 2015-May-19.
16 H Chung, M A Arnold, M Rhiel, D W Murhammer. Simultaneous measurements of glucose, glutamine, ammonia, lactate, and glutamate in aqueous solutions by near-infrared spectroscopy. Applied Spectroscopy, 1996, 50(2): 270–276
https://doi.org/10.1366/0003702963906447
17 A E Cervera, N Petersen, A E Lantz, A Larsen, K V Gernaey. Application of near-infrared spectroscopy for monitoring and control of cell culture and fermentation. Biotechnology Progress, 2009, 25(6): 1561–1581
18 K Z Liu, H H Mantsch. Simultaneous quantitation from infrared spectra of glucose concentrations, lactate concentrations, and lecithin/sphingomyelin ratios in amniotic fluid. American Journal of Obstetrics and Gynecology, 1999, 180(3): 696–702
https://doi.org/10.1016/S0002-9378(99)70275-9
19 N Petersen, P Odman, A E Padrell, S Stocks, A E Lantz, K V Gernaey. In situ near infrared spectroscopy for analyte-specific monitoring of glucose and ammonium in streptomyces coelicolor fermentations. Biotechnology Progress, 2010, 26(1): 263–271
20 G E Jose, F Folque, J C Menezes, S Werz, U Strauss, C Hakemeyer. Predicting mab product yields from cultivation media components, using near-infrared and 2D-fluorescence spectroscopies. Biotechnology Progress, 2011, 27(5): 1339–1346
https://doi.org/10.1002/btpr.638
21 N R Abu-Absi, B M Kenty, M E Cuellar, M C Borys, S Sakhamuri, D J Strachan, M C Hausladen, Z J Li. Real time monitoring of multiple parameters in mammalian cell culture bioreactors using an in-line Raman spectroscopy probe. Biotechnology and Bioengineering, 2011, 108(5): 1215–1221
https://doi.org/10.1002/bit.23023
22 G Budinova, J Salva, K Volka. Application of molecular spectroscopy in the mid-infrared region to the determination of glucose and cholesterol in whole blood and in blood serum. Applied Spectroscopy, 1997, 51(5): 631–635
https://doi.org/10.1366/0003702971941034
23 C Petibois, G Cazorla, A Cassaigne, G Deleris. Plasma protein contents determined by Fourier-transform infrared spectrometry. Clinical Chemistry, 2001, 47(4): 730–738
24 D I Ellis, R Goodacre. Metabolic fingerprinting in disease diagnosis: Biomedical applications of infrared and Raman spectroscopy. Analyst (London), 2006, 131(8): 875–885
https://doi.org/10.1039/b602376m
25 P I Haris, D Chapman. Does Fourier-transform infrared-spectroscopy provide useful information on protein structures. Trends in Biochemical Sciences, 1992, 17(9): 328–333
https://doi.org/10.1016/0968-0004(92)90305-S
26 S Gross-Selbeck, G Margreiter, C Obinger, K Bayer. Fast quantification of recombinant protein inclusion bodies within intact cells by FTIR spectroscopy. Biotechnology Progress, 2007, 23(3): 762–766
https://doi.org/10.1021/bp070022q
27 B H Stuart, D J Ando, eds. Biological Applications of Infrared Spectroscopy. New York: John Wiley & Sons, Inc., 1997, 191
28 C A Sellick, R Hansen, R M Jarvis, A R Maqsood, G M Stephens, A J Dickson, R Goodacre. Rapid monitoring of recombinant antibody production by mammalian cell cultures using fourier transform infrared spectroscopy and chemometrics. Biotechnology and Bioengineering, 2010, 106(3): 432–442
29 E K Read, S A Bradley, T A Smitka, C D Agarabi, S C Lute, K A Brorson. Fermentanomics informed amino acid supplementation of an antibody producing mammalian cell culture. Biotechnology Progress, 2013, 29(3): 745–753
https://doi.org/10.1002/btpr.1728
30 S R Delwiche, J B Reeves III. A graphical method to evaluate spectral proprecessing in multivariate regression calibrations: example with Savtzky-Golay filters and partial least squares regression. Applied Spectroscopy, 2010, 64(1): 73–82
https://doi.org/10.1366/000370210790572007
31 H Wu, M A Khan. Quality-by-design (QbD): An integrated process analytical technology (PAT) approach for real-time monitoring and mapping the state of a pharmaceutical co-precipitation process. Journal of Pharmaceutical Sciences, 2010, 99(3): 1516–1534
https://doi.org/10.1002/jps.21923
32 FDA/ICH. Guidance for Industry Q8(R2) Pharmaceutical Development. FDA, 2009.
Viewed
Full text


Abstract

Cited

  Shared   
  Discussed