|
|
|
Combining innovative science and policy to improve air quality in cities with refining and chemicals manufacturing: The case study of Houston, Texas, USA |
David T. Allen( ) ) |
| University of Texas Austin, Department of Chemical Engineering and Center for Energy and Environmental Resources, Austin, TX 78759, USA |
|
|
|
|
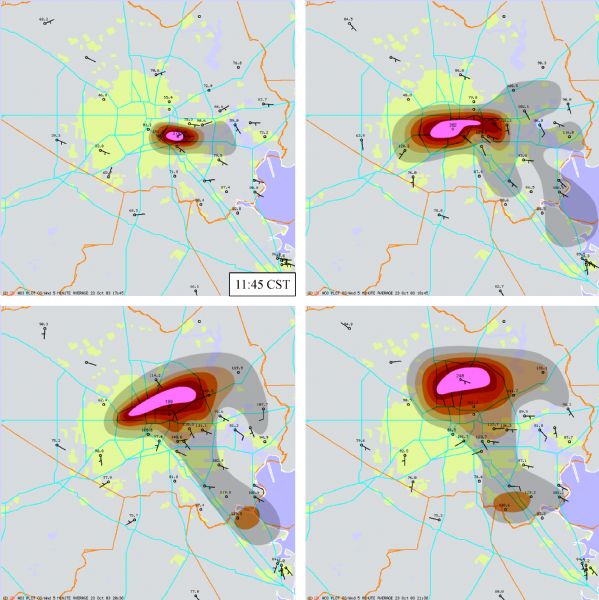
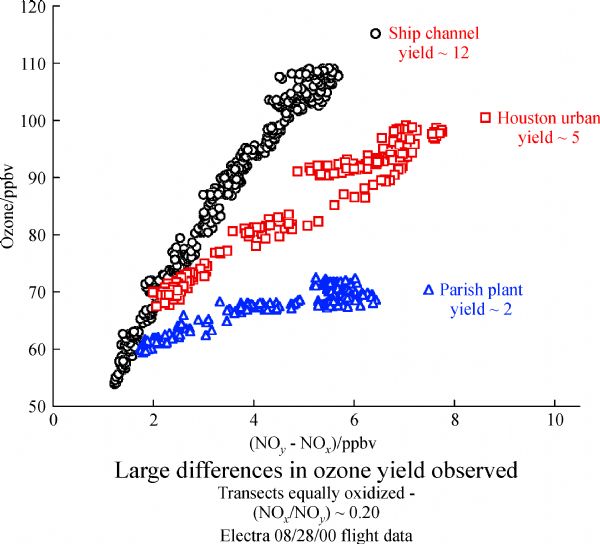
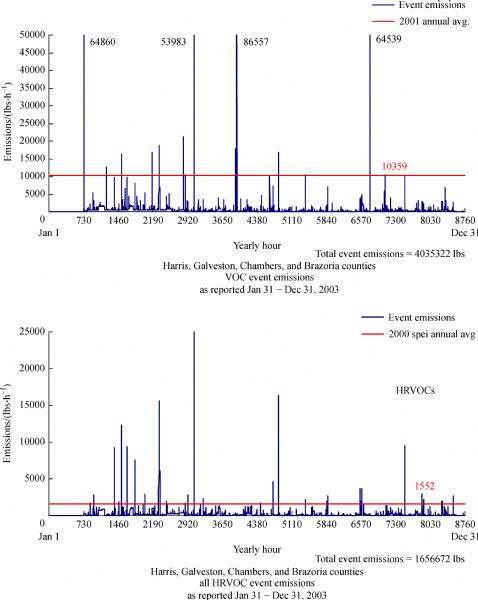
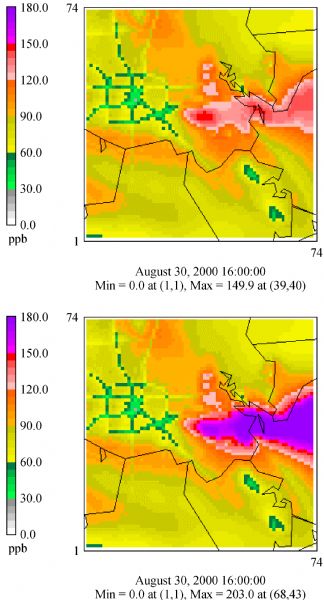
Abstract In Houston, a combination of urban emissions from a city of 4 million people, coupled with emissions from extensive petroleum refining and chemical manufacturing, leads to conditions for photochemistry that are unique in the United States, and historically, the city had experienced some of the highest ozone concentrations recorded in the United States. Large air quality field studies (the Texas Air Quality Studies or TexAQS I and II) were conducted to determine root causes of the high ozone concentrations. Hundreds of air quality investigators, from around the world, deployed instruments on aircraft, on ships, and at fixed ground sites to make extensive air quality measurements; detailed photochemical modeling was used to interpret and assess the implications of the measurements. The Texas Air Quality Studies revealed that both continuous and episodic emissions of light alkenes, which came to be called highly reactive volatile organic compounds, played a critical role in the formation of ozone and other photochemical oxidants in the region. Understanding and quantifying the role of these emissions in regional air quality required innovations in characterizing emissions and in photochemical modeling. Reducing emissions required innovative policy approaches. These coupled scientific and policy innovations are described, and the result, substantially cleaner air for Houston, is documented. The lessons learned from the Houston air quality experience are relevant to cities with similar population and industrial profiles around the world.
|
| Keywords
ozone
air quality
highly reactive volatile organic compounds
Houston
|
|
Corresponding Author(s):
David T. Allen
|
|
Just Accepted Date: 10 May 2017
Online First Date: 14 July 2017
Issue Date: 23 August 2017
|
|
| 1 |
Texas Commission on Environmental Quality. 2016, https://www.tceq.texas.gov/cgi-bin/compliance/monops/select_summary.pl
|
| 2 |
University of Texas. Accelerated science evaluation, overview. 2002,
|
| 3 |
Kleinman L I, Daum P H, Imre D, Lee Y N, Nunnermacker L J, Springston S R, Weinstein-Lloyd J, Rudolph J. Ozone production rate and hydrocarbon reactivity in 5 urban areas: A cause of high ozone concentration in Houston. Geophysical Research Letters, 2002, 29(10): 1467
https://doi.org/10.1029/2001GL014569
|
| 4 |
Ryerson T B, Trainer M, Angevine W M, Brock C A, Dissly R W, Fehsenfeld F C, Frost G J, Goldan P D, Holloway J S, Hubler G, et al. Effect of petrochemical industrial emissions of reactive alkenes and NOx on tropospheric ozone formation in Houston,Texas. Journal of Geophysical Research, 2003, 108(D8): 4249
https://doi.org/10.1029/2002JD003070
|
| 5 |
University of Texas. Accelerated science evaluation, atmospheric chemistry version 2.0. 2002,
|
| 6 |
University of Texas. Accelerated science evaluation, emission inventories version 3.0. 2002,
|
| 7 |
University of Texas. Accelerated science evaluation, meteorology version 2.0. 2002,
|
| 8 |
University of Texas. Accelerated science evaluation, air quality modeling version 1.3. 2002,
|
| 9 |
TAC (Texas Administrative Code). Environmental Quality, Part 1 Texas Commission on Environmental Quality, Chapter 101 General Air Quality Rules, 2002
|
| 10 |
Texas Commission on Environmental Quality. Status of electronic reporting of air emission incidents. 2003,
|
| 11 |
Murphy C F, Allen D T. Hydrocarbon emissions from industrial release events in the Houston-Galveston area and their impact on ozone formation. Atmospheric Environment, 2005, 39(21): 3785–3798
https://doi.org/10.1016/j.atmosenv.2005.02.051
|
| 12 |
Nam J, Kimura Y, Vizuete W, Murphy C, Allen D T. Modeling the impacts of emission events on ozone formation in Houston, Texas. Atmospheric Environment, 2006, 40(28): 5329–5341
https://doi.org/10.1016/j.atmosenv.2006.05.002
|
| 13 |
Vizuete W, Kimura Y, Jeffries H, Allen D T. Modeling ozone formation from industrial emission events in Houston, Texas. Atmospheric Environment, 2008, 42(33): 7641–7650
https://doi.org/10.1016/j.atmosenv.2008.05.063
|
| 14 |
Webster M, Nam J, Kimura Y, Jeffries H, Vizuete W, Allen D T. The effect of variability in industrial emissions on ozone formation in Houston, Texas. Atmospheric Environment, 2007, 41(40): 9580–9593
https://doi.org/10.1016/j.atmosenv.2007.08.052
|
| 15 |
Wang L, Thompson T, McDonald-Buller E C, Webb A, Allen D T. Photochemical modeling of emissions trading of highly reactive volatile organic compounds (HRVOCs) in Houston, Texas. Part 1. Potential for ozone hot spot formation and reactivity based trading. Environmental Science & Technology, 2007, 41: 2095–2102
https://doi.org/10.1021/es061273i
|
| 16 |
Wang L, Thompson T, McDonald-Buller E C, Webb A, Allen D T. Photochemical modeling of emissions trading of highly reactive volatile organic compounds (HRVOCs) in Houston, Texas. Part 2. Incorporation of chlorine emissions. Environmental Science & Technology, 2007, 41(7): 2103–2107
https://doi.org/10.1021/es061276v
|
| 17 |
Torres V M, Herndon S, Kodesh Z, Nettles R, Allen D T. Industrial flare performance at low flow conditions: Part 1. Study overview. Industrial & Engineering Chemistry Research, 2012, 51: 12559–12568
https://doi.org/10.1021/ie202674t
|
| 18 |
Torres V M, Herndon S, Allen D T. Industrial flare performance at low flow conditions: Part 2. Air and steam assisted flares. Industrial & Engineering Chemistry Research, 2012, 51(39): 12569–12576
https://doi.org/10.1021/ie202675f
|
| 19 |
Parrish D D, Allen D T, Bates T S, Estes M, Fehsenfeld F C, Feingold G, Ferrare R, Hardesty R M, Meagher J F, Nielsen-Gammon J W, et al.. Overview of the second Texas air quality study (TexAQS II) and the gulf of Mexico atmospheric composition and climate study (GoMACCS ). Journal of Geophysical Research, D, Atmospheres, 2009, 114: D00F13
https://doi.org/10.1029/2009JD011842
|
| 20 |
Texas Commission on Environmental Quality. Air quality successes. 2015,
|
| 21 |
Allen D T, Turner J R. Transport of atmospheric fine particulate matter. Part 1: Findings from recent field programs on the extent of regional transport within North America. Journal of the Air & Waste Management Association, 2008, 58(2): 254–264
https://doi.org/10.3155/1047-3289.58.2.254
|
| 22 |
Berlin S R, Langford A O, Estes M, Dong M, Parrish D D. Magnitude, decadal changes and impact of regional background ozone transported into the greater Houston, Texas area. Environmental Science & Technology, 2013, 47(24): 13985–13992
https://doi.org/10.1021/es4037644
|
| 23 |
Turner J R, Allen D T. Transport of atmospheric fine particulate matter: Part 2. Findings from recent field programs on the intraurban variability in fine particulate matter. Journal of the Air & Waste Management Association, 2008, 58(2): 196–215
https://doi.org/10.3155/1047-3289.58.2.196
|
|
Viewed |
|
|
|
Full text
|
|
|
|
|
Abstract
|
|
|
|
|
Cited |
|
|
|
|
| |
Shared |
|
|
|
|
| |
Discussed |
|
|
|
|