|
|
|
Techno-economic evaluation of a biogas-based oxidative coupling of methane process for ethylene production |
Alberto T. Penteado( ), Mijin Kim, Hamid R. Godini, Erik Esche, Jens-Uwe Repke ), Mijin Kim, Hamid R. Godini, Erik Esche, Jens-Uwe Repke |
| Process Dynamics and Operations Group, Technische Universität Berlin, D-10623 Berlin, Germany |
|
|
|
|
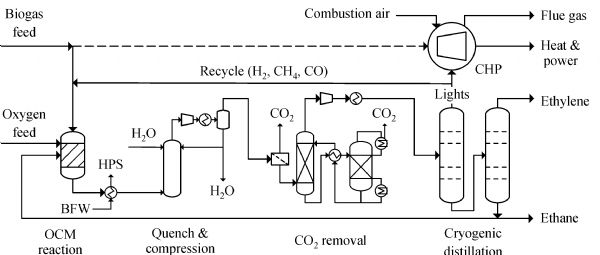
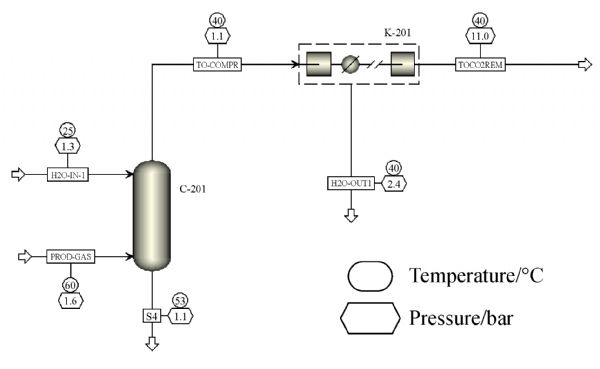
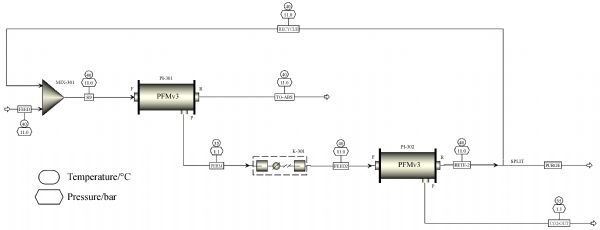
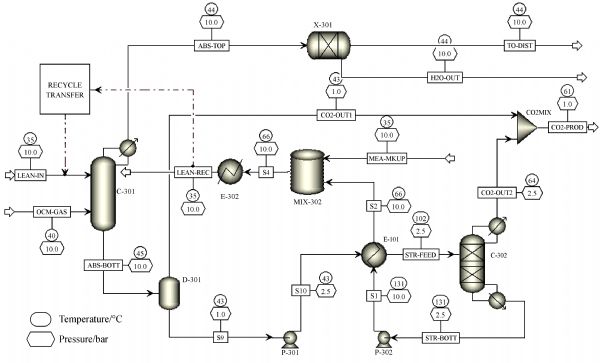
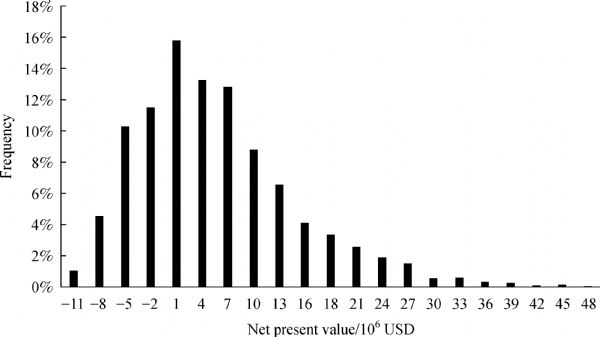
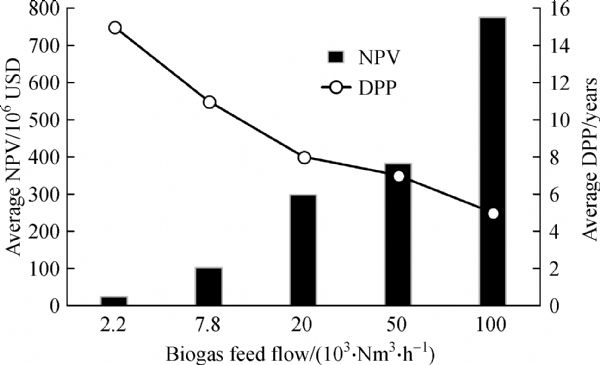
Abstract This contribution is a preliminary techno-economic assessment of a biogas-based oxidative coupling of methane (OCM) process. Biogas is frequently utilized as a renewable energy source within small scale combined heat and power plants or as a natural gas substitute. The activation of methane also enables its utilization as a feedstock to produce chemicals. In this sense, the OCM process allows for the direct conversion of methane into ethylene, which is a major building block for the chemical and polymer industries. Biogas resulting from the anaerobic digestion of vinasse, a liquid effluent from bioethanol industry, is treated for contaminant removal and its methane content is converted into ethylene, which is then purified as the main product. The biogas cleaning process is assessed based on literature data, while an experimentally validated simulation model is used to assess the OCM process. A techno-economic evaluation is then performed through a Monte Carlo simulation, wherein uncertain parameters take random values between reasonable bounds. The net present value results positive in 74% of the cases, indicating that the project is profitable under a wide range of scenarios. Some performance improvement opportunities have been identified and highlighted to guide future studies in the topic.
|
| Keywords
biogas conversion
ethylene production
oxidative coupling of methane
feasibility study
|
|
Corresponding Author(s):
Alberto T. Penteado
|
|
Just Accepted Date: 09 August 2018
Online First Date: 18 December 2018
Issue Date: 03 January 2019
|
|
| 1 |
SRasi, A Veijanen, JRintala. Trace compounds of biogas from different biogas production plants. Energy, 2007, 8(8): 1375– 1380
https://doi.org/10.1016/j.energy.2006.10.018
|
| 2 |
MScheftelowitz, N Rendsberg, VDenysenko, JDaniel-Gromke, WStinner, KHillebrand, KNaumann, DPeetz, CHennig, DThran, et al. Stromerzeugung aus Biomasse (Vorhaben IIa Biomasse). Leipzig: German Biomass Research Center, 2015, 1–154 (in German)
|
| 3 |
J BHolm-Nielsen, TAl Seadi, POleskowicz-Popiel. The future of anaerobic digestion and biogas utilization. Bioresource Technology, 2009, 100(22): 5478–5484
https://doi.org/10.1016/j.biortech.2008.12.046
|
| 4 |
YGao, J Jiang, YMeng, FYan, A Aihemaiti. A review of recent developments in hydrogen production via biogas dry reforming. Energy Conversion and Management, 2018, 171: 133–155
https://doi.org/10.1016/j.enconman.2018.05.083
|
| 5 |
S NNaik, V V Goud, P K Rout, A K Dalai. Production of first and second generation biofuels: A comprehensive review. Renewable & Sustainable Energy Reviews, 2010, 14(2): 578–597
https://doi.org/10.1016/j.rser.2009.10.003
|
| 6 |
ERyckebosch, M Drouillon, HVervaeren. Techniques for transformation of biogas to biomethane. Biomass and Bioenergy, 2011, 35(5): 1633–1645
https://doi.org/10.1016/j.biombioe.2011.02.033
|
| 7 |
Institute of Chemical Engineering—Research Division Thermal Process Engineering and Simulation. Guide to Cooperative Biogas to Biomethane Developments. Vienna: Vienna University of Technology, 2012: 1–17
|
| 8 |
XWang, X Lu, GYang, YFeng, G Ren, XHan. Development process and probable future transformations of rural biogas in China. Renewable & Sustainable Energy Reviews, 2016, 55: 703–712
https://doi.org/10.1016/j.rser.2015.09.097
|
| 9 |
K RSalomon, E E S Lora. Estimate of the electric energy generating potential for different sources of biogas in Brazil. Biomass and Bioenergy, 2009, 33(9): 1101–1107
https://doi.org/10.1016/j.biombioe.2009.03.001
|
| 10 |
SBarros, C Berk. Brazil Biofuels Annual (Global Agricultural Information Network Report Number BR16009). US Department of Agriculture—Foreign Agricultural Serivces, 2016: 1–26
|
| 11 |
The website of ANEEL (Agência Nacional de Energia Elétrica). 2016
|
| 12 |
P V LReddy, K HKim, HSong. Emerging green chemical technologies for the conversion of CH4 to value added products. Renewable & Sustainable Energy Reviews, 2013, 24: 578–585
https://doi.org/10.1016/j.rser.2013.03.035
|
| 13 |
XChen, J Jiang, KLi, STian, F Yan. Energy-efficient biogas reforming process to produce syngas: The enhanced methane conversion by O2. Applied Energy, 2017, 185(1): 687–697
https://doi.org/10.1016/j.apenergy.2016.10.114
|
| 14 |
A TPenteado, M Kim, H RGodini, EEsche, J URepke. Biogas as a renewable feedstock for green ethylene production via oxidative coupling of methane: Preliminary feasibility study. Chemical Engineering Transactions, 2017, 61: 589–594
|
| 15 |
G EKeller, M M Bhasin. Synthesis of ethylene via oxidative coupling of methane: I. Determination of active catalysts. Journal of Catalysis, 1982, 73(1): 9–19
https://doi.org/10.1016/0021-9517(82)90075-6
|
| 16 |
W RTrue. Global ethylene capacity continues advance in 2011. Oil & Gas Journal, 2012, 110(7): 1–12
|
| 17 |
CWailes. The website of Siluria Technologies. 2016
|
| 18 |
RAlbanez, B C Chiaranda, R G Ferreira, A L P França, C D Honório, J A D Rodrigues, S M Ratusznei, M Zaiat. Anaerobic biological treatment of vinasse for environmental compliance and methane production. Applied Biochemistry and Biotechnology, 2016, 178(1): 21–43
https://doi.org/10.1007/s12010-015-1856-z
|
| 19 |
QSun, H Li, JYan, LLiu, Z Yu, XYu. Selection of appropriate biogas upgrading technology—a review of biogas cleaning, upgrading and utilisation. Renewable & Sustainable Energy Reviews, 2015, 51: 521–532
https://doi.org/10.1016/j.rser.2015.06.029
|
| 20 |
DRamírez-Sáenz, P BZarate-Segura, CGuerrero-Barajas, E IGarca-Peña. H2S and volatile fatty acids elimination by biofiltration: Clean-up process for biogas potential use. Journal of Hazardous Materials, 2009, 163(2-3): 1272–1281
https://doi.org/10.1016/j.jhazmat.2008.07.129
|
| 21 |
JKrischan, A Makaruk, MHarasek. Design and scale-up of an oxidative scrubbing process for the selective removal of hydrogen sulfide from biogas. Journal of Hazardous Materials, 2012, 215-216: 49–56
https://doi.org/10.1016/j.jhazmat.2012.02.028
|
| 22 |
MMiltner, A Makaruk, JKrischan, MHarasek. Chemical-oxidative scrubbing for the removal of hydrogen sulphide from raw biogas: Potentials and economics. Water Science and Technology, 2012, 66(6): 1354–1360
https://doi.org/10.2166/wst.2012.329
|
| 23 |
E CCarlson. Don’t gamble with physical properties for simulations. Chemical Engineering Progress, 1996, 92(10): 35–46
|
| 24 |
C HTwu, W D Sim, V Tassone. Getting a handle on advanced cubic equations of state. Chemical Engineering Progress, 2002, 98(11): 58–65
|
| 25 |
D YPeng, D B Robinson. A new two-constant equation of state. Industrial & Engineering Chemistry Fundamentals, 1976, 15(1): 59–64
https://doi.org/10.1021/i160057a011
|
| 26 |
C CChen, Y Song. Generalized electrolyte—NRTL model for mixed—solvent electrolyte systems. AIChE Journal. American Institute of Chemical Engineers, 2004, 50(8): 1928–1941
https://doi.org/10.1002/aic.10151
|
| 27 |
SArndt, T Otremba, USimon, MYildiz, HSchubert, RSchomäcker. Mn-Na2WO4/SiO2 as catalyst for the oxidative coupling of methane. What is really known? Applied Catalysis A, General, 2012, 425-426: 53–61
https://doi.org/10.1016/j.apcata.2012.02.046
|
| 28 |
JXu, L Peng, XFang, ZFu, W Liu, XXu, HPeng, R Zheng, XWang. Developing reactive catalysts for low temperature oxidative coupling of methane: On the factors deciding the reaction performance of Ln2Ce2O7 with different rare earth A sites. Applied Catalysis A, General, 2018, 552: 117–128
https://doi.org/10.1016/j.apcata.2018.01.004
|
| 29 |
ZStansch, L Mleczko, MBaerns. Comprehensive kinetics of oxidative coupling of methane over the La2O3/CaO catalyst. Industrial & Engineering Chemistry Research, 1997, 36(7): 2568–2579
https://doi.org/10.1021/ie960562k
|
| 30 |
SJaso, H Arellano-Garcia, GWozny. Oxidative coupling of methane in a fluidized bed reactor: Influence of feeding policy, hydrodynamics, and reactor geometry. Chemical Engineering Journal, 2011, 171(1): 255–271
https://doi.org/10.1016/j.cej.2011.03.077
|
| 31 |
H RGodini, S Xiao, MKim, NHolst, SJaso, O Görke, JSteinbach, GWozny. Experimental and model-based analysis of membrane reactor performance for methane oxidative coupling: Effect of radial heat and mass transfer. Journal of Industrial and Engineering Chemistry, 2014, 20(4): 1993–2002
https://doi.org/10.1016/j.jiec.2013.09.022
|
| 32 |
V OIgenegbai, R JMeyer, SLinic. In the search of membrane-catalyst materials for oxidative coupling of methane: Performance and phase stability studies of gadolinium-doped barium cerate and the impact of Zr doping. Applied Catalysis B: Environmental, 2018, 230: 29–35
https://doi.org/10.1016/j.apcatb.2018.02.040
|
| 33 |
H ARafique, S Vuddagiri, HHarraz, GRadaelli, E CScher, JMcCormick, RIyer, S Duggal, JCizeron, JKi Hong. US Patent, 2015/0210610 A1, 2015-07-30
|
| 34 |
APenteado, E Esche, DSalerno, H RGodini, GWozny. Design and assessment of a membrane and absorption based carbon dioxide removal processs for oxidative coupling of methane. Industrial & Engineering Chemistry Research, 2016, 55(27): 7473–7483
https://doi.org/10.1021/acs.iecr.5b04910
|
| 35 |
SStünkel. Carbon dioxide separation in the gas scrubbing of the oxidative coupling of methane process. Dissertation for the Doctoral Degree. Berlin: Technische Universität Berlin, 2013, 1–153 (in German)
|
| 36 |
EEsche, D Müller, SSong, GWozny. Optimization during the process synthesis: Enabling the oxidative coupling of methane by minimizing the energy required for the carbon dioxide removal. Journal of Cleaner Production, 2015, 91: 100–108
https://doi.org/10.1016/j.jclepro.2014.12.034
|
| 37 |
DSalerno, H R Godini, A Penteado, EEsche, GWozny. Techno-economic evaluation of an oxidative coupling of methane process at industrial scale production. Computer-Aided Chemical Engineering, 2016, 38: 1785–1790
https://doi.org/10.1016/B978-0-444-63428-3.50302-7
|
| 38 |
LGarcía, Y A Poveda, M Khadivi, GRodríguez, OGörke, EEsche, H RGodini, GWozny, AOrjuela. Synthesis and granulation of a 5A zeolite-based molecular sieve and adsorption equilibrium of the oxidative coupling of methane gases. Journal of Chemical & Engineering Data, 2017, 62(4): 1550–1557
https://doi.org/10.1021/acs.jced.7b00061
|
| 39 |
GNarin, V F D Martins, M Campo, A MRibeiro, AFerreira, J CSantos, KSchumann, A ERodrigues. Light olefins/paraffins separation with 13X zeolite binderless beads. Separation and Purification Technology, 2014, 133: 452–475
https://doi.org/10.1016/j.seppur.2014.06.060
|
| 40 |
The website of S&P Global Platts. 2018
|
| 41 |
CLühe. Modular cost estimation in support of system planning for bidding and early basic engineering phase. Dissertation for the Doctoral Degree. Berlin: Technische Universität Berlin, 2012, 1–135 (in German)
|
| 42 |
ABejan, G Tsatsaronis, MMoran. Thermal Design & Optimization. New Jersey: John Wiley & Sons, Inc., 1996, 1–560
|
| 43 |
EGudmundsson. Ramboll Group A/S. 2016
|
| 44 |
H RGodini, S Xiao, SJaso, SStünkel, DSalerno, N XSon, SSong, G Wozny. Techno-economic analysis of integrating the methane oxidative coupling and methane reforming processes. Fuel Processing Technology, 2013, 106: 684–694
https://doi.org/10.1016/j.fuproc.2012.10.002
|
|
Viewed |
|
|
|
Full text
|
|
|
|
|
Abstract
|
|
|
|
|
Cited |
|
|
|
|
| |
Shared |
|
|
|
|
| |
Discussed |
|
|
|
|