|
|
|
Physical and chemical processes of wintertime secondary nitrate aerosol formation |
Qi YING( ) ) |
| Zachry Department of Civil Engineering, Texas A&M University, College Station, TX 77845-3136, USA |
|
|
|
|
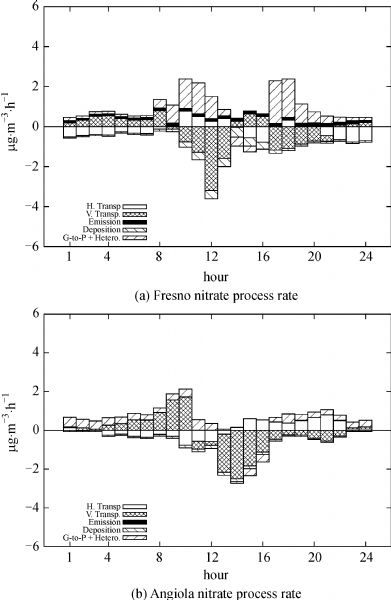
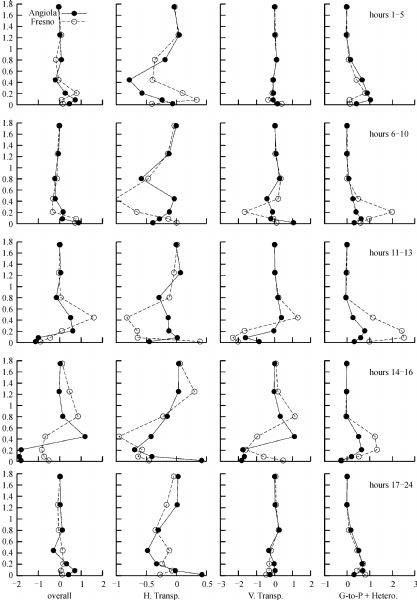
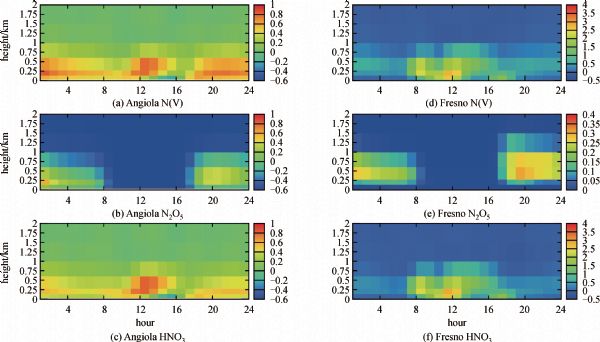
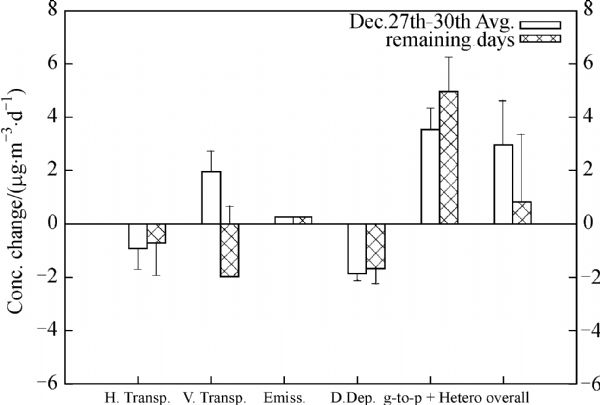
Abstract The UCD/CIT model was modified to include a process analysis (PA) scheme for gas and particulate matter (PM) to study the formation of secondary nitrate aerosol during a stagnant wintertime air pollution episode during the California Regional PM2.5/PM10 Air Quality Study (CRPAQS) where detailed measurements of PM components are available at a few sites. Secondary nitrate is formed in the urban areas from near the ground to a few hundred meters above the surface during the day with a maximum modeled net increase rate of 4 μg·m-3·d-1 during the study episode. The secondary nitrate formation rate in rural areas is lower due to lower NO2. In the afternoon hours, near-surface temperature can be high enough to evaporate the particulate nitrate. In the nighttime hours, both the gas phase N2O5 reactions with water vapor and the N2O5 heterogeneous reactions with particle-bound water are important for secondary nitrate formation. The N2O5 reactions are most import near the surface to a few hundred meters above surface with a maximum modeled net secondary nitrate increase rate of 1 μg·m-3·d-1 and are more significant in the rural areas where the O3 concentrations are high at night. In general, vertical transport during the day moves the nitrate formed near the surface to higher elevations. During the stagnant days, process analysis indicates that the nitrate concentration in the upper air builds up and leads to a net downward flux of nitrate through vertical diffusion and a rapid increase of surface nitrate concentration.
|
| Keywords
secondary nitrate aerosol
N2O5 heterogeneous reaction
process analysis
|
|
Corresponding Author(s):
YING Qi,Email:qying@civil.tamu.edu
|
|
Issue Date: 05 September 2011
|
|
| 1 |
Herner J D, Aw J, Gao O, Chang D P, Kleeman M J. Size and composition distribution of airborne particulate matter in northern California: I—particulate mass, carbon, and water-soluble ions. Journal of the Air & Waste Management Association , 2005, 55(1): 30-51
|
| 2 |
Harrison R M, Deacon A R, Jones M R. Sources and processes affecting concentrations of PM10 and PM2.5 particulate matter in Birmingham (UK). Atmospheric Environment , 1997, 31(24): 4103-4117
doi: 10.1016/S1352-2310(97)00296-3
|
| 3 |
Lonati G, Giugliano M, Butelli P, Romele L, Tardivo R. Major chemical components of PM2.5 in Milan (Italy). Atmospheric Environment , 2005, 39(10): 1925-1934
doi: 10.1016/j.atmosenv.2004.12.012
|
| 4 |
Celis J E, Morales J R, Zaror C A, Inzunza J C. A study of the particulate matter PM10 composition in the atmosphere of Chillan, Chile. Chemosphere , 2004, 54(4): 541-550
doi: 10.1016/S0045-6535(03)00711-2
|
| 5 |
Seinfeld J H, Pandis S N. Atmospheric Chemistry and Physics: From Air Pollution to Climate Change. 2006, New York: Wiley-Interscience
|
| 6 |
Foley K M, Roselle S J, Appel K W , Bhave P V, Pleim J E, Otte T L, Mathur R, Sarwar G, Young J O, Gilliam R C, Nolte C G, Kelly J T, Gilliland A B, Bash J O. Incremental testing of the Community Multiscale Air Quality (CMAQ) modeling system version 4.7. Geoscientific Model Development , 2010, 3(1): 205-226
doi: 10.5194/gmd-3-205-2010
|
| 7 |
Riemer N, Vogel H, Vogel B, Schell B, Ackermann I, Kessler C, Hass H. Impact of the heterogeneous hydrolysis of N2O5 on chemistry and nitrate aerosol formation in the lower troposphere under photosmog conditions. Journal of Geophysical Research-Atmospheres , 2003, 108(D4)
|
| 8 |
Bertram T H, Thornton J A. Toward a general parameterization of N2O5 reactivity on aqueous particles: the competing effects of particle liquid water, nitrate and chloride. Atmospheric Chemistry and Physics , 2009, 9(21): 8351-8363
doi: 10.5194/acp-9-8351-2009
|
| 9 |
Chang W L, Bhave P V, Brown S S, Riemer N, Stutz J, Dabdub D. Heterogeneous Atmospheric chemistry, ambient measurements, and model calculations of N2O5: a review. Aerosol Science and Technology , 2011, 45(6): 655-685
doi: 10.1080/02786826.2010.551672
|
| 10 |
Stutz J, Alicke B, Ackermann R, Geyer A, White A, Williams E. Vertical profiles of NO3, N2O5, O3, and NOx in the nocturnal boundary layer: 1. Observations during the Texas air quality study 2000. Journal of Geophysical Research—Atmospheres , 2004, 109(D12)
|
| 11 |
Jang J C C, Jeffries H E, Tonnesen S. Sensitivity of ozone to model grid resolution-II. Detailed process analysis for ozone chemistry. Atmospheric Environment , 1995, 29(21): 3101-3114
doi: 10.1016/1352-2310(95)00119-J
|
| 12 |
Herner J D, Ying Q, Aw J, Gao O, Chang D P Y, Kleeman M J. Dominant mechanisms that shape the airborne particle size and composition distribution in central California. Aerosol Science and Technology , 2006, 40(10): 827-844
doi: 10.1080/02786820600728668
|
| 13 |
Zhang, Y, Wen X Y, Wang K, Vijayaraghavan K, Jacobson M Z. Probing into regional O-3 and particulate matter pollution in the United States: 2. An examination of formation mechanisms through a process analysis technique and sensitivity study. Journal of Geophysical Research-Atmospheres, 2009, 114
|
| 14 |
Kleeman M J, Cass G R. A 3D Eulerian source-oriented model for an externally mixed aerosol. Environmental Science & Technology , 2001, 35(24): 4834-4848
doi: 10.1021/es010886m
|
| 15 |
Ying Q, Kleeman M J. Source contributions to the regional distribution of secondary particulate matter in California. Atmospheric Environment , 2006, 40(4): 736-752
doi: 10.1016/j.atmosenv.2005.10.007
|
| 16 |
Ying Q, Lu J, Allen P, Livingstone P, Kaduwela A, Kleeman M J. Modeling air quality during the California Regional PM10/PM2.5 Air Quality Study (CRPAQS) using the UCD/CIT source-oriented air quality model-Part I. Base case model results. Atmospheric Environment , 2008, 42: 8954-8966
doi: 10.1016/j.atmosenv.2008.05.064
|
| 17 |
Ghosal S, Hemminger J C. Surface adsorbed water on NaCl and its effect on nitric acid reactivity with NaCl powders. Journal of Physical Chemistry B , 2004, 108(37): 14102-14108
doi: 10.1021/jp047774c
|
| 18 |
Zhang Y, Liu P, Liu X H , Pun B , Seigneur C , Jacobson M Z , Wang W X. Fine scale modeling of wintertime aerosol mass, number, and size distributions in central California. Journal of Geophysical Research-Atmospheres, 2010, 115
|
| 19 |
Pun B K, Balmori R T F, Seigneur C. Modeling wintertime particulate matter formation in central California. Atmospheric Environment , 2009, 43(2): 402-409
doi: 10.1016/j.atmosenv.2008.08.040
|
| 20 |
Livingstone P L, Magliano K, Gürer K, Allen P D, Zhang K M, Ying Q, Jackson B S, Kaduwela A, Kleeman M, Woodhouse L F, Turkiewicz K, Horowitz L W, Scott K, Johnson D, Taylor C,O’Brien G, DaMassa J, Croes B E, Binkowski F, Byun D. Simulating PM concentration during a winter episode in a subtropical valley: Sensitivity simulations and evaluation methods. Atmospheric Environment , 2009, 43(37): 5971-5977
doi: 10.1016/j.atmosenv.2009.07.033
|
| 21 |
Ying Q, Lu J, Kaduwela A, Kleeman M. Modeling air quality during the California Regional PM10/PM2.5 Air Quality Study (CPRAQS) using the UCD/CIT Source Oriented Air Quality Model-Part II. Regional source apportionment of primary airborne particulate matter. Atmospheric Environment , 2008, 42(39): 8967-8978
doi: 10.1016/j.atmosenv.2008.05.065
|
| 22 |
Chen J J, Ying Q, Kleeman M J. Source apportionment of wintertime secondary organic aerosol during the California regional PM10/PM2.5 air quality study. Atmospheric Environment , 2010, 44(10): 1331-1340
doi: 10.1016/j.atmosenv.2009.07.010
|
| 23 |
Ying Q, Kleeman M. Regional contributions to airborne particulate matter in central California during a severe pollution episode. Atmospheric Environment , 2009, 43(6): 1218-1228
doi: 10.1016/j.atmosenv.2008.11.019
|
| 24 |
Goodin W R, McRae G J, Seinfeld J H. Comparison of interpolation methods for sparse data-application to wind and concentration fields. Journal of Applied Meteorology , 1979, 18(6): 761-771
doi: 10.1175/1520-0450(1979)018<0761:ACOIMF>2.0.CO;2
|
| 25 |
Goodin W R, McRae G J, Seinfeld J H. Objective analysis technique for constructing 3-dimensional urban-scale wind fields . Journal of Applied Meteorology , 1980, 19(1): 98-108
doi: 10.1175/1520-0450(1980)019<0098:AOATFC>2.0.CO;2
|
| 26 |
Held T, Ying Q, Kaduwela A, Kleeman M. Modeling particulate matter in the San Joaquin Valley with a source-oriented externally mixed three-dimensional photochemical grid model. Atmospheric Environment , 2004, 38(22): 3689-3711
doi: 10.1016/j.atmosenv.2004.02.053
|
| 27 |
Judith C, John W, Douglas L, Susanne H. Particulate nitrate measurements duringCRPAQS. 2004, Desert Research Institute, Aerosol Dynamics In: Reno, NV, Berkeley CA.
|
| 28 |
Ying Q, Lu J, Kleeman M J. Modeling air quality during the California Regional PM10/PM2.5 Air Quality Study (CRPAQS) using the UCD/CIT source oriented air quality model-part III. Regional source apportionment of secondary and total airborne particulate matter. Atmospheric Environment , 2009, 43: 419-430
doi: 10.1016/j.atmosenv.2008.08.033
|
| 29 |
Evans M J, Jacob D J. Impact of new laboratory studies of N2O5 hydrolysis on global model budgets of tropospheric nitrogen oxides, ozone, and OH. Geophysical Research Letters , 2005, 32(9): L09813
|
|
Viewed |
|
|
|
Full text
|
|
|
|
|
Abstract
|
|
|
|
|
Cited |
|
|
|
|
| |
Shared |
|
|
|
|
| |
Discussed |
|
|
|
|