|
|
|
Modeling agricultural non-point source pollution in a high-precipitation coastal area of China |
Zhiyi LI,Pengfei DU( ),Haiwei HUANG,Yong Ge,Xu LI ),Haiwei HUANG,Yong Ge,Xu LI |
| State Key Joint Laboratory of Environment Simulation and Pollution Control, School of Environment, Tsinghua University, Beijing 100084, China |
|
|
|
|
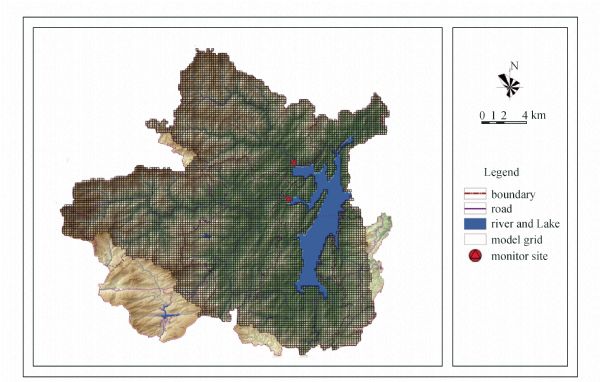
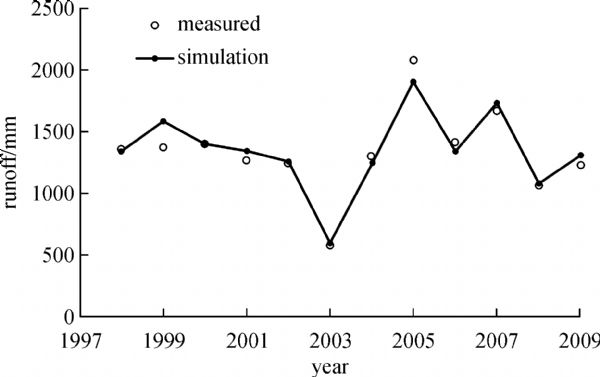
Abstract Non-point source (NPS) pollution simulation in the high-precipitation coastal areas of China is difficult because varying annual typhoon incidence leads to highly contrasting rainfall patterns in dry years and wet years. An IMPULSE (Integrated Model of Non-point Sources Pollution Processes) based NPS model of the Changtan Reservoir watershed, which is a typical high-precipitation coastal area in China, was established based on the analysis of point and NPS pollution data, a digital elevation model, and data on land-use, soil, meteorology, economy, and agricultural management practice. Pre-processed pre-rainfall soil moisture levels were introduced during the simulation to model the effects of typhoons on hydrology. Rainfall events were simulated sequentially through the year and the model was calibrated and verified using hydrological and water quality data. Accuracy of the simulated rainfall runoff and water quality in the Changtan watershed was found to be acceptable. The study showed that the NPS modeling system could be applied to the simulation and prediction of NPS loadings in the Changtan Reservoir watershed.
|
| Keywords
Changtan Reservoir watershed
non-point source pollution modeling
pre-rainfall soil moisture
model calibration
|
|
Corresponding Author(s):
Pengfei DU
|
|
Online First Date: 12 June 2014
Issue Date: 17 November 2014
|
|
| 1 |
Dowd B M, Press D, Huertos M L. Agricultural nonpoint source water pollution policy: The case of California’s Central Coast. Agriculture, Ecosystems & Environment, 2008, 128(3): 151–161
https://doi.org/10.1016/j.agee.2008.05.014
|
| 2 |
Zhang R, Zhou W, Field R, Field R, Tafuri A, Shaw L Y, Jin K. Field test of best management practice pollutant removal efficiencies in Shenzhen, China. Frontiers of Environmental Science & Engineering in China, 2009, 3(3): 354–363
https://doi.org/10.1007/s11783-009-0033-4
|
| 3 |
Liang T, Wang S, Cao H, Zhang C, Li H, Li H, Song W, Chong Z. Estimation of ammonia nitrogen load from nonpoint sources in the Xitiao River catchment, China. Journal of Environmental Sciences (China), 2008, 20(10): 1195–1201
https://doi.org/10.1016/S1001-0742(08)62209-3
pmid: 19143343
|
| 4 |
Guo Y, Jia H. An approach to calculating allowable watershed pollutant loads. Frontiers of Environmental Science & Engineering, 2012, 6(5): 658–671
|
| 5 |
He W Q, Chen S, Liu X H, Chen J N. Water quality monitoring in a slightly-polluted inland water body through remote sensing—case study of the Guanting Reservoir in Beijing, China. Frontiers of Environmental Science & Engineering in China, 2008, 2(2): 163–171
https://doi.org/10.1007/s11783-008-0027-7
|
| 6 |
Zhang H X, Shaw L Y. Critical flow-storm approach to total maximum daily load (TMDL) development: an analytical conceptual model. Frontiers of Environmental Science & Engineering in China, 2008, 2(3): 267–273
https://doi.org/10.1007/s11783-008-0058-0
|
| 7 |
Ren F, Wu G, Wang X, Wang Y. Changes in tropical cyclone precipitation over China. Geophysical Research Letters, 2006, 33(20): L20702
https://doi.org/10.1029/2006GL027951
|
| 8 |
Thatcher L, Takayabu Y N, Yokoyama C, Pu Z.Characteristics of tropical cyclone precipitation features over the western Pacific warm pool. Journal of Geophysical Research: Atmospheres (1984–2012), 2012, 117(D16): D16208
|
| 9 |
Ren F, Wang Y, Wang X, Li W. Estimating tropical cyclone precipitation from station observations. Advances in Atmospheric Sciences, 2007, 24(4): 700–711
https://doi.org/10.1007/s00376-007-0700-y
|
| 10 |
Zhang D W. The Development and Application of Decision Support System for Watershed Nonpoint Source Pollution Simulation and Management. Beijing: Tsinghua University Press, 2005 (in Chinese)
|
| 11 |
McCuen Richard H. A Guide to Hydrologic Analysis Using SCS Methods. Michigan: Prentice-Hall, Inc., 1982
|
| 12 |
Neitsch S L, Arnold J G, Kiniry J R, Williams J R, King K W. Soil and water assessment tool theoretical documentation. Version 2000. Texas: Texas Water Resources Institute, College Station, Texas TWRI Report, 2001
|
| 13 |
Knisel W G. CREAMS: A field scale model for chemicals, runoff, and erosion from agricultural management systems. Conservation Research Report No. 26, U.S. Department of Agriculture, Washington, DC, 1980
|
| 14 |
Young R A, Onstad C A, Bosch D D, Anderson W P. AGNPS agricultural nonpoint source pollution model: a large watershed analysis tool. USDA, ARS Conservation Research Report No. 35, Springfield, VA, 1986
|
| 15 |
He W Q. Identification of parameter uncertainties for distributed event-based model of nonpoint source pollution. Dissertation for the Doctoral Degree. Beijing: Tsinghua University, 2008 (in Chinese)
|
| 16 |
He W Q, Chen J N, Zeng S Y, Liu Y. Assessment of IMPULSE model simulation capability based on uncertainty analysis. Journal of Tsinghua University (Science & Technology)2009, 49(6): 850–854(in Chinese)
|
| 17 |
Lai S Y. Study on non-point sources pollution investigation and evaluation method and its application. Dissertation for the Master Degree. Beijing: Tsinghua University, 2004 (in Chinese)
|
| 18 |
Ju X, Liu X, Zhang F, Roelcke M. Nitrogen fertilization, soil nitrate accumulation, and policy recommendations in several agricultural regions of China. Ambio: A Journal of the Human Environment, 2004, 33(6): 300–305
|
| 19 |
Zhao R F, Chen X P, Zhang F S, Zhang H, Schroder J, R?mheld V. Fertilization and nitrogen balance in a wheat–maize rotation system in North China. Agronomy Journal, 2006, 98(4): 938–945
https://doi.org/10.2134/agronj2005.0157
|
| 20 |
Tan D S, Jiang L H, Tan S Y, Zheng F L, Xu Y, Cui R Z, Wang M, Shi J, Li G S, Liu Z H. An in situ study of inorganic nitrogen flow under different fertilization treatments on a wheat–maize rotation system surrounding Nansi Lake, China. Agricultural Water Management, 2013, 123: 45–54
https://doi.org/10.1016/j.agwat.2013.03.011
|
| 21 |
Geng W, Hu L, Cui J Y, Bu M D, Zhang B B. Biogas energy potential for livestock manure and gross control of animal feeding in region level of China. Transactions of the Chinese Society of Agricultural Engineering, 2013, 29(1): 171–179
|
| 22 |
Zheng C, Liu Y, Bluemling B, Chen J, Mol A P. Modeling the environmental behavior and performance of livestock farmers in China: An ABM approach. Agricultural Systems, 2013, 122: 60–72
https://doi.org/10.1016/j.agsy.2013.08.005
|
|
Viewed |
|
|
|
Full text
|
|
|
|
|
Abstract
|
|
|
|
|
Cited |
|
|
|
|
| |
Shared |
|
|
|
|
| |
Discussed |
|
|
|
|