|
|
|
Ambient photolysis frequency of NO2 determined using chemical actinometer and spectroradiometer at an urban site in Beijing |
Qi Zou,Keding Lu( ),Yusheng Wu,Yudong Yang,Zhuofei Du,Min Hu ),Yusheng Wu,Yudong Yang,Zhuofei Du,Min Hu |
| State Key Joint Laboratory of Environmental Simulation and Pollution Control, College of Environmental Sciences and Engineering, Peking University, Beijing 100871, China |
|
|
|
|
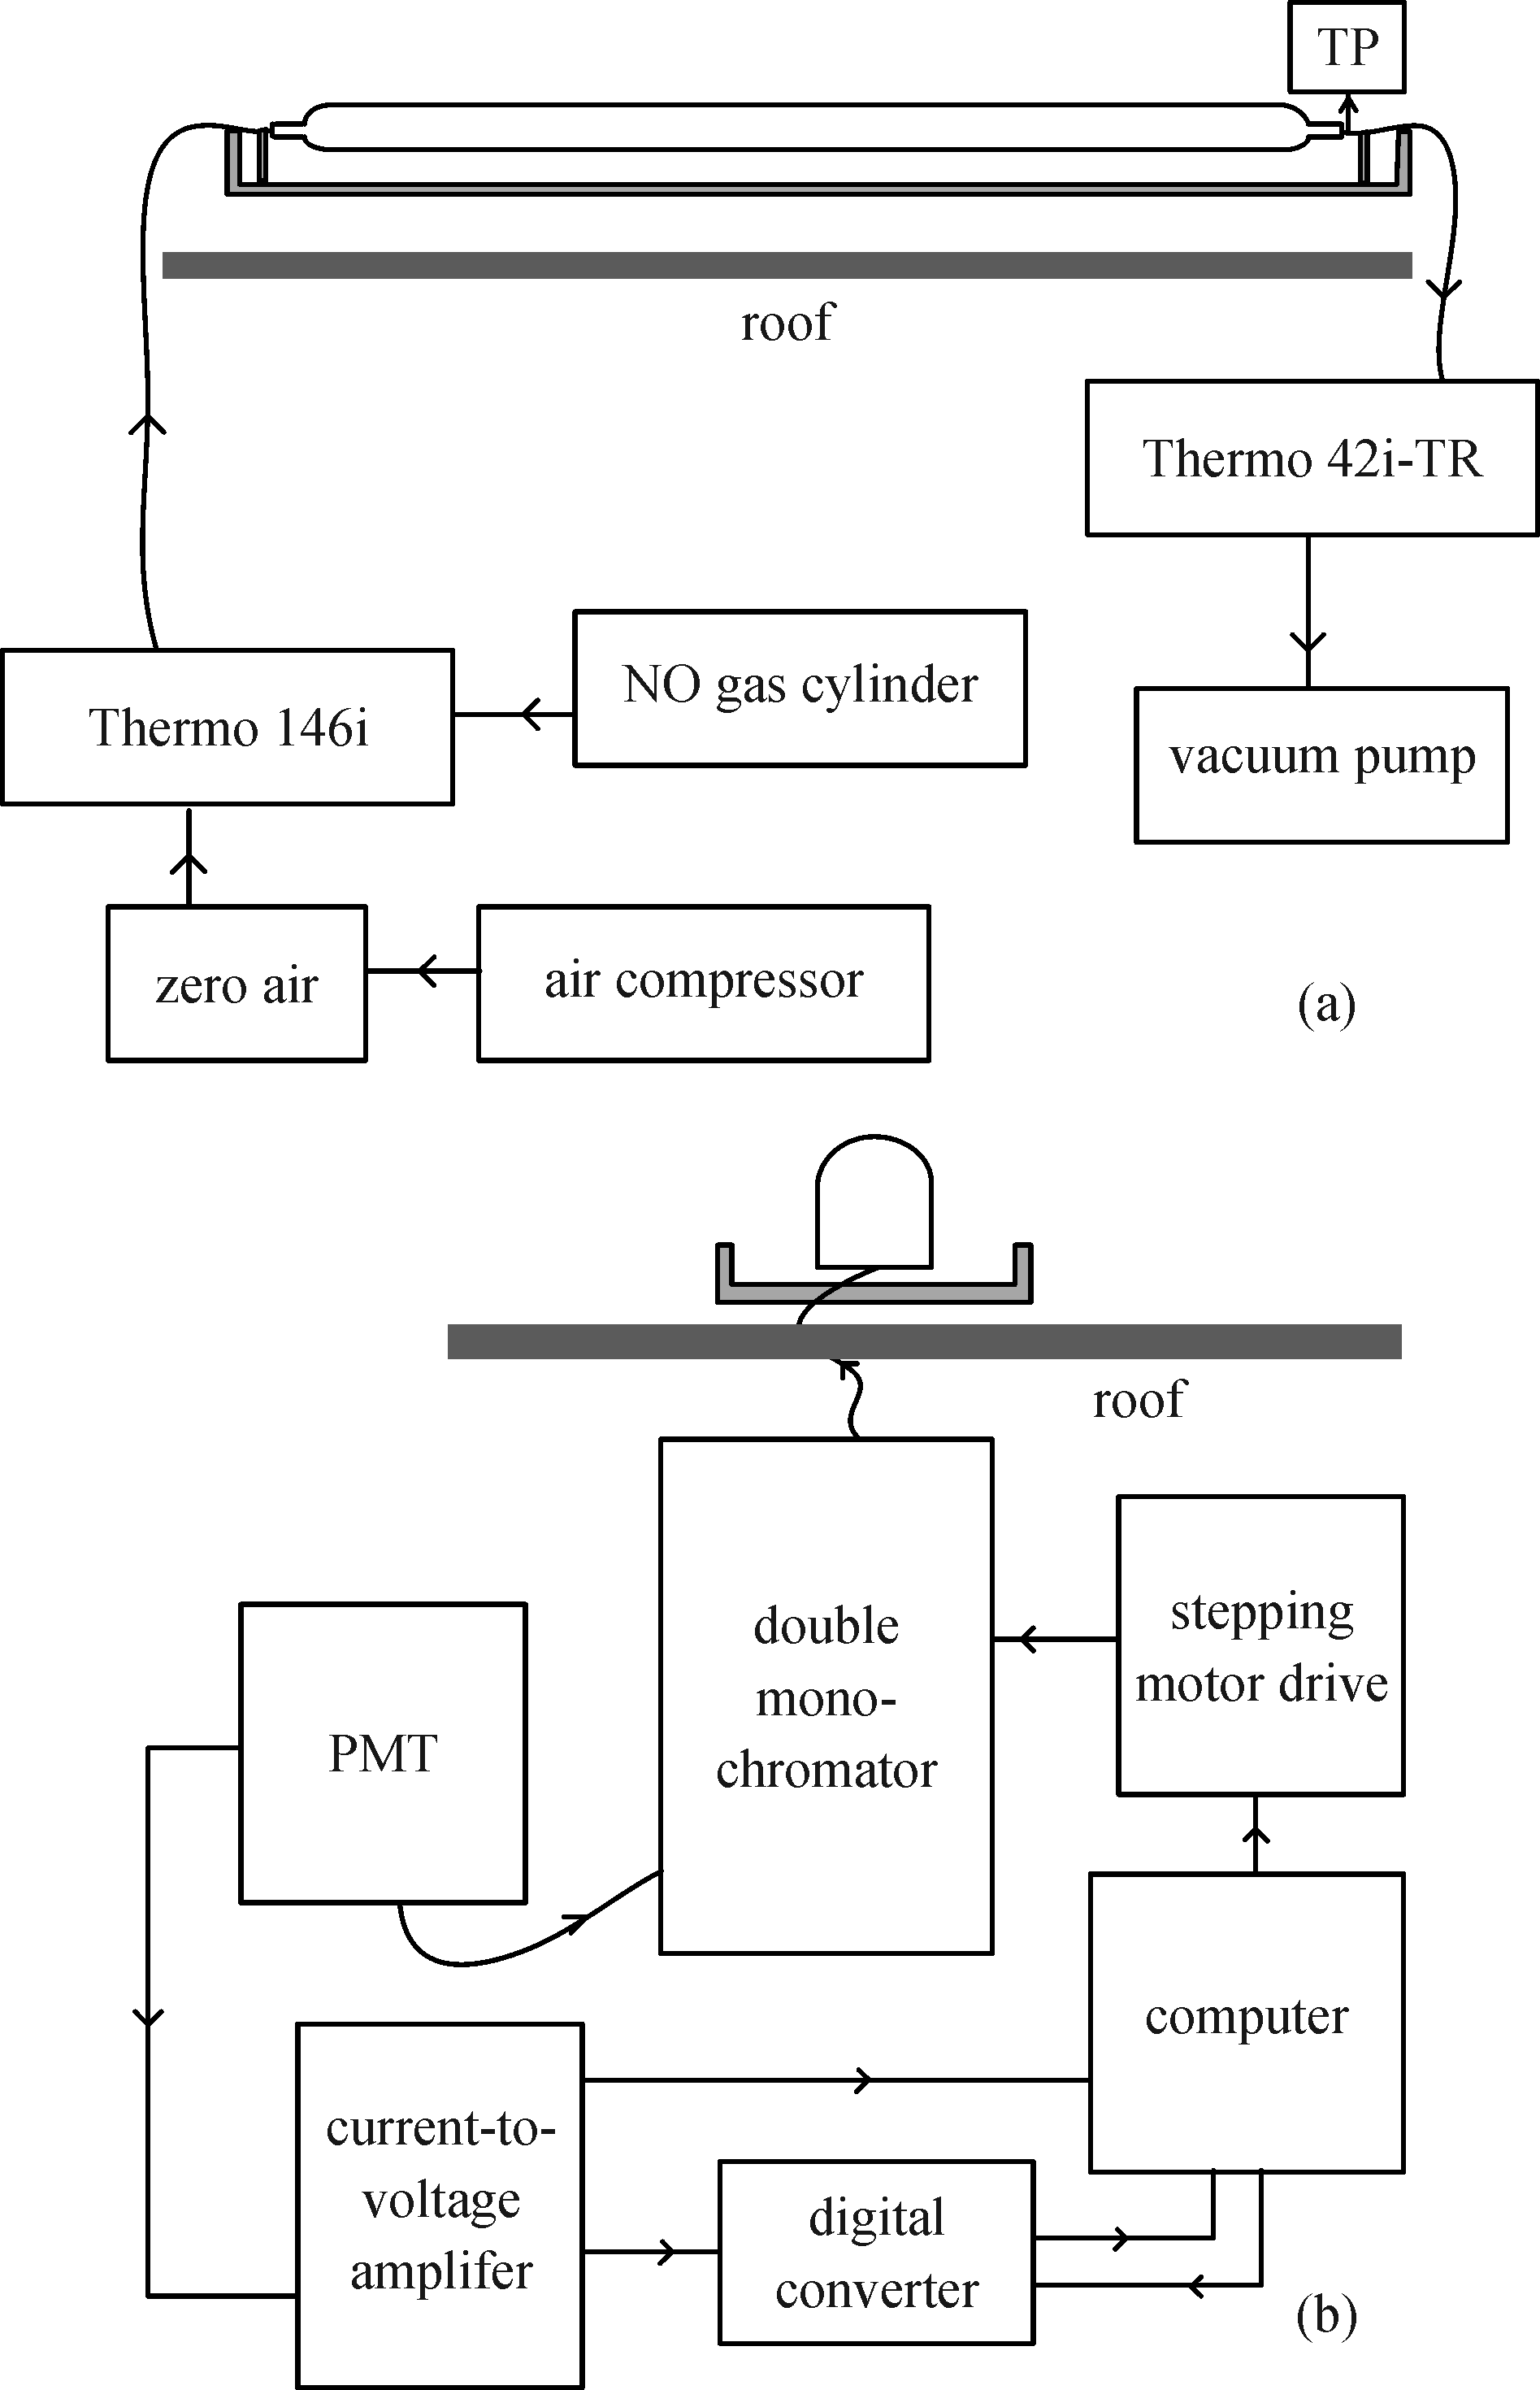
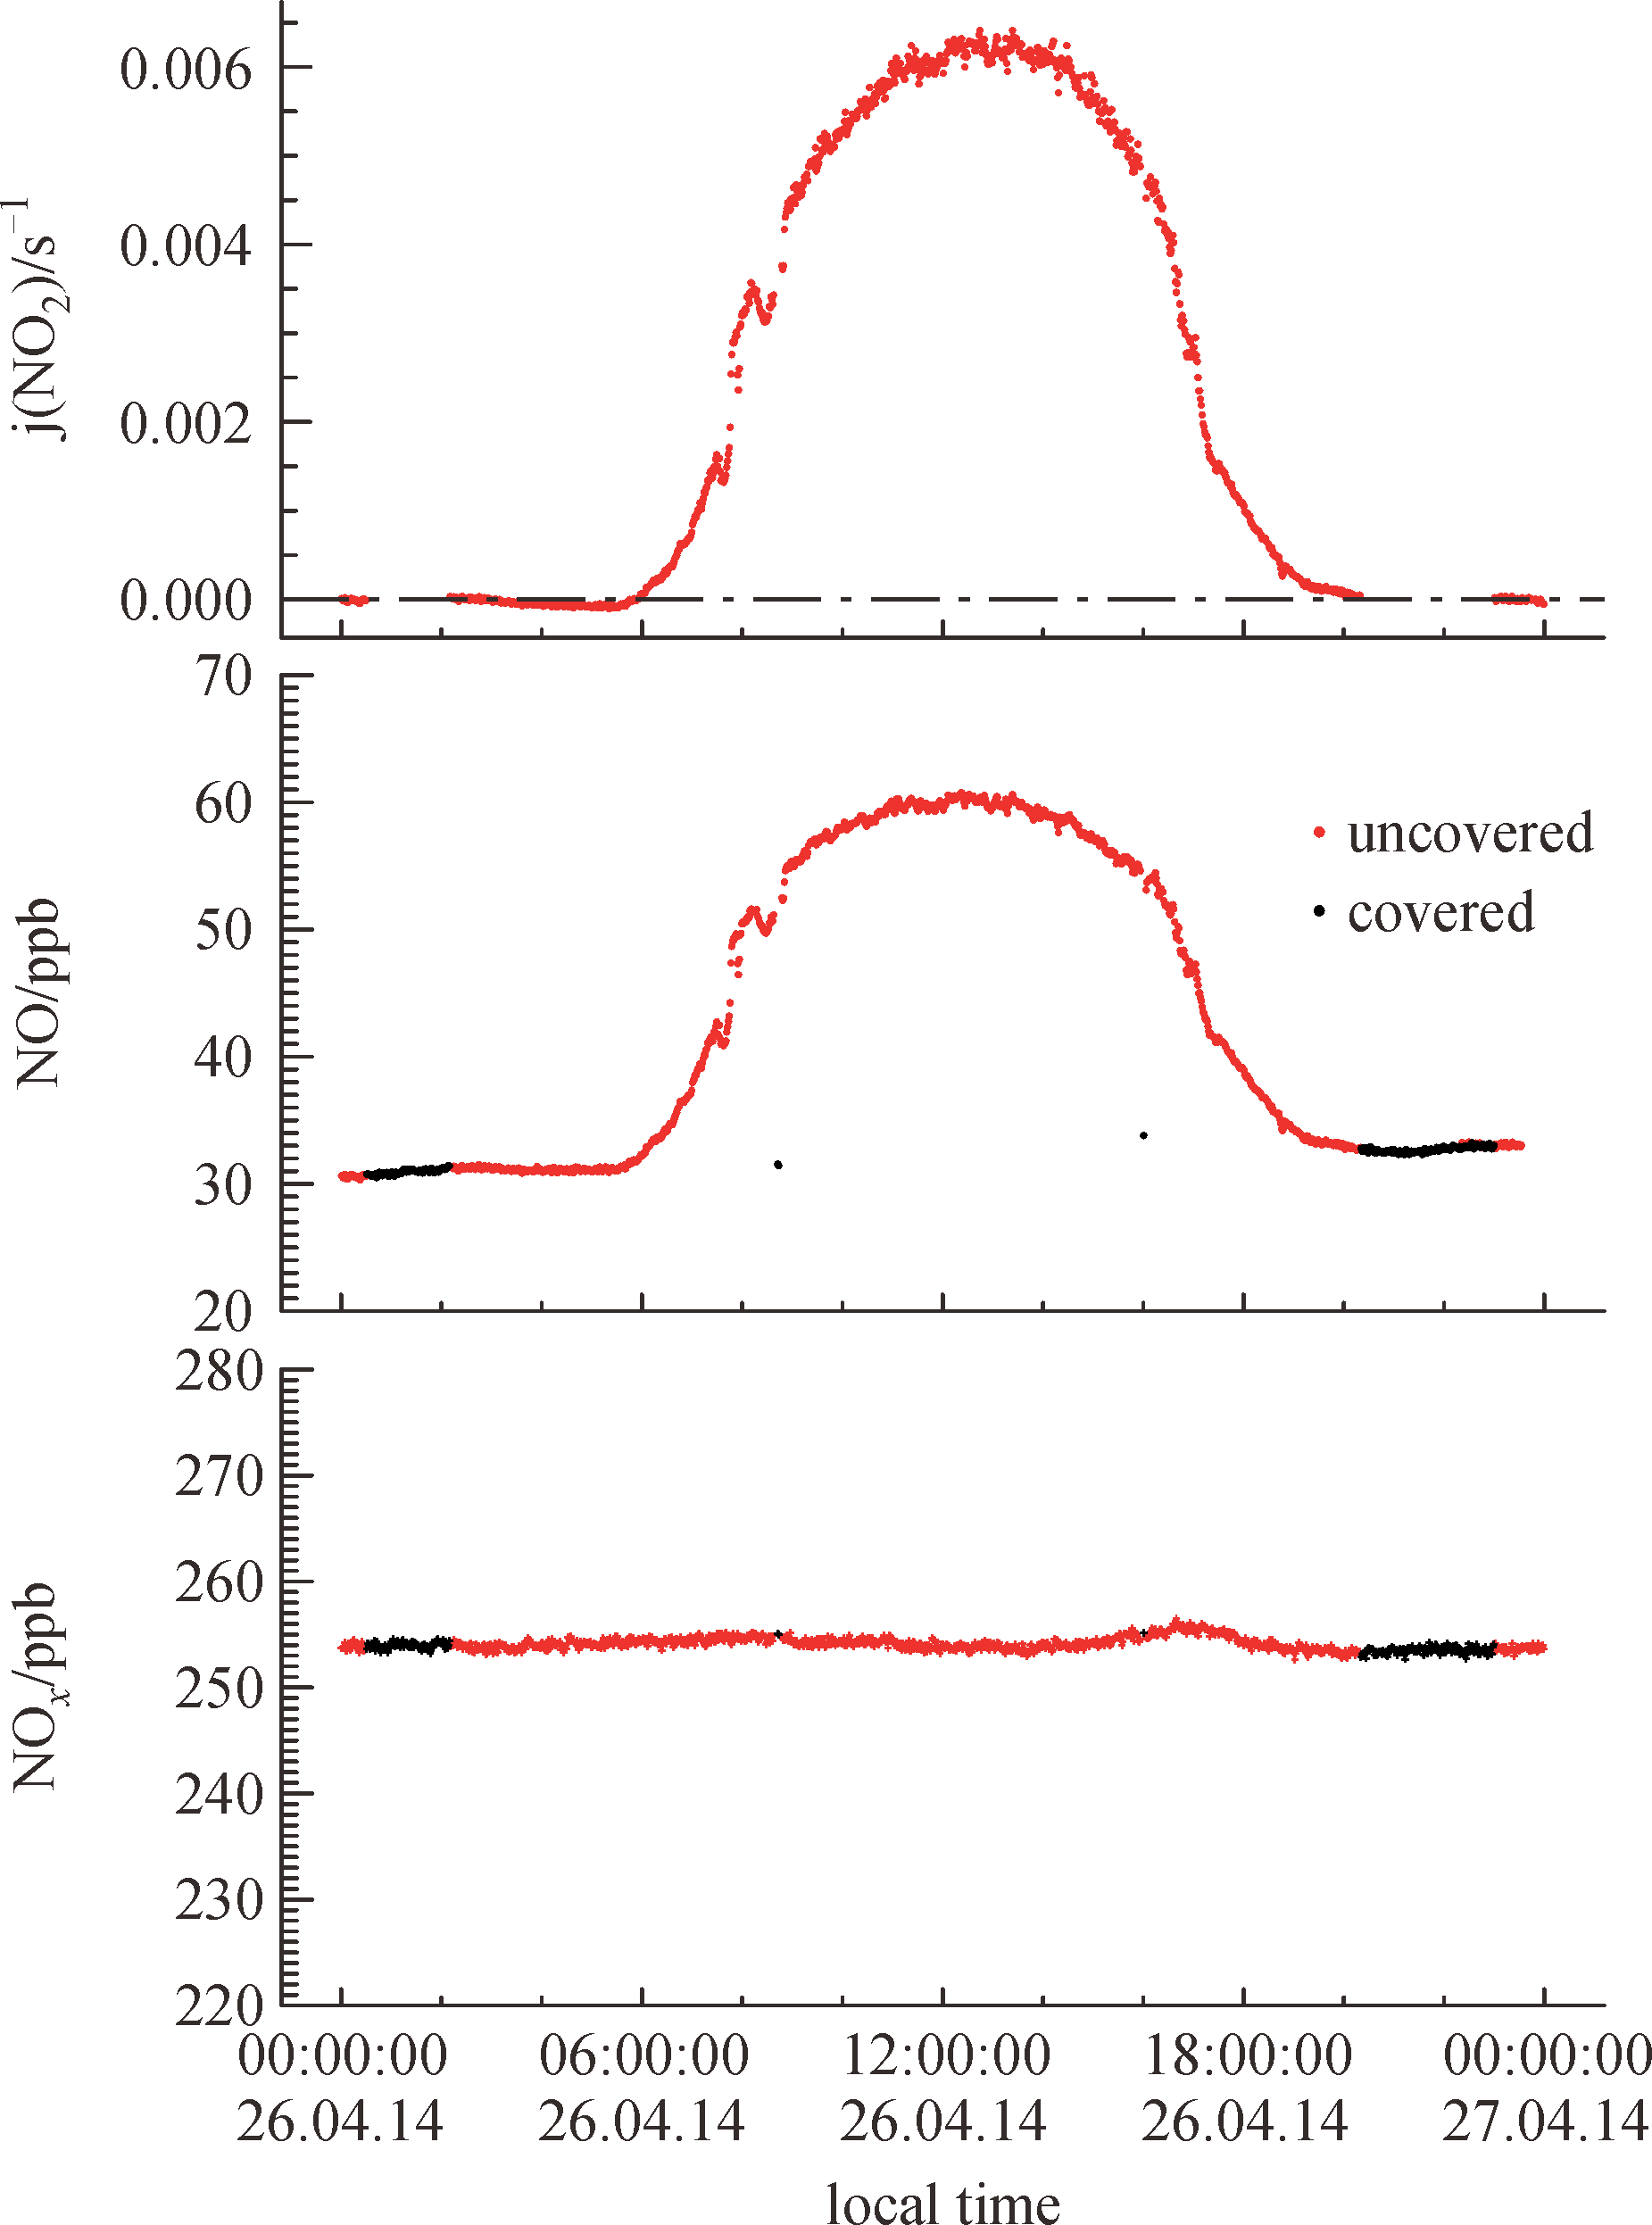
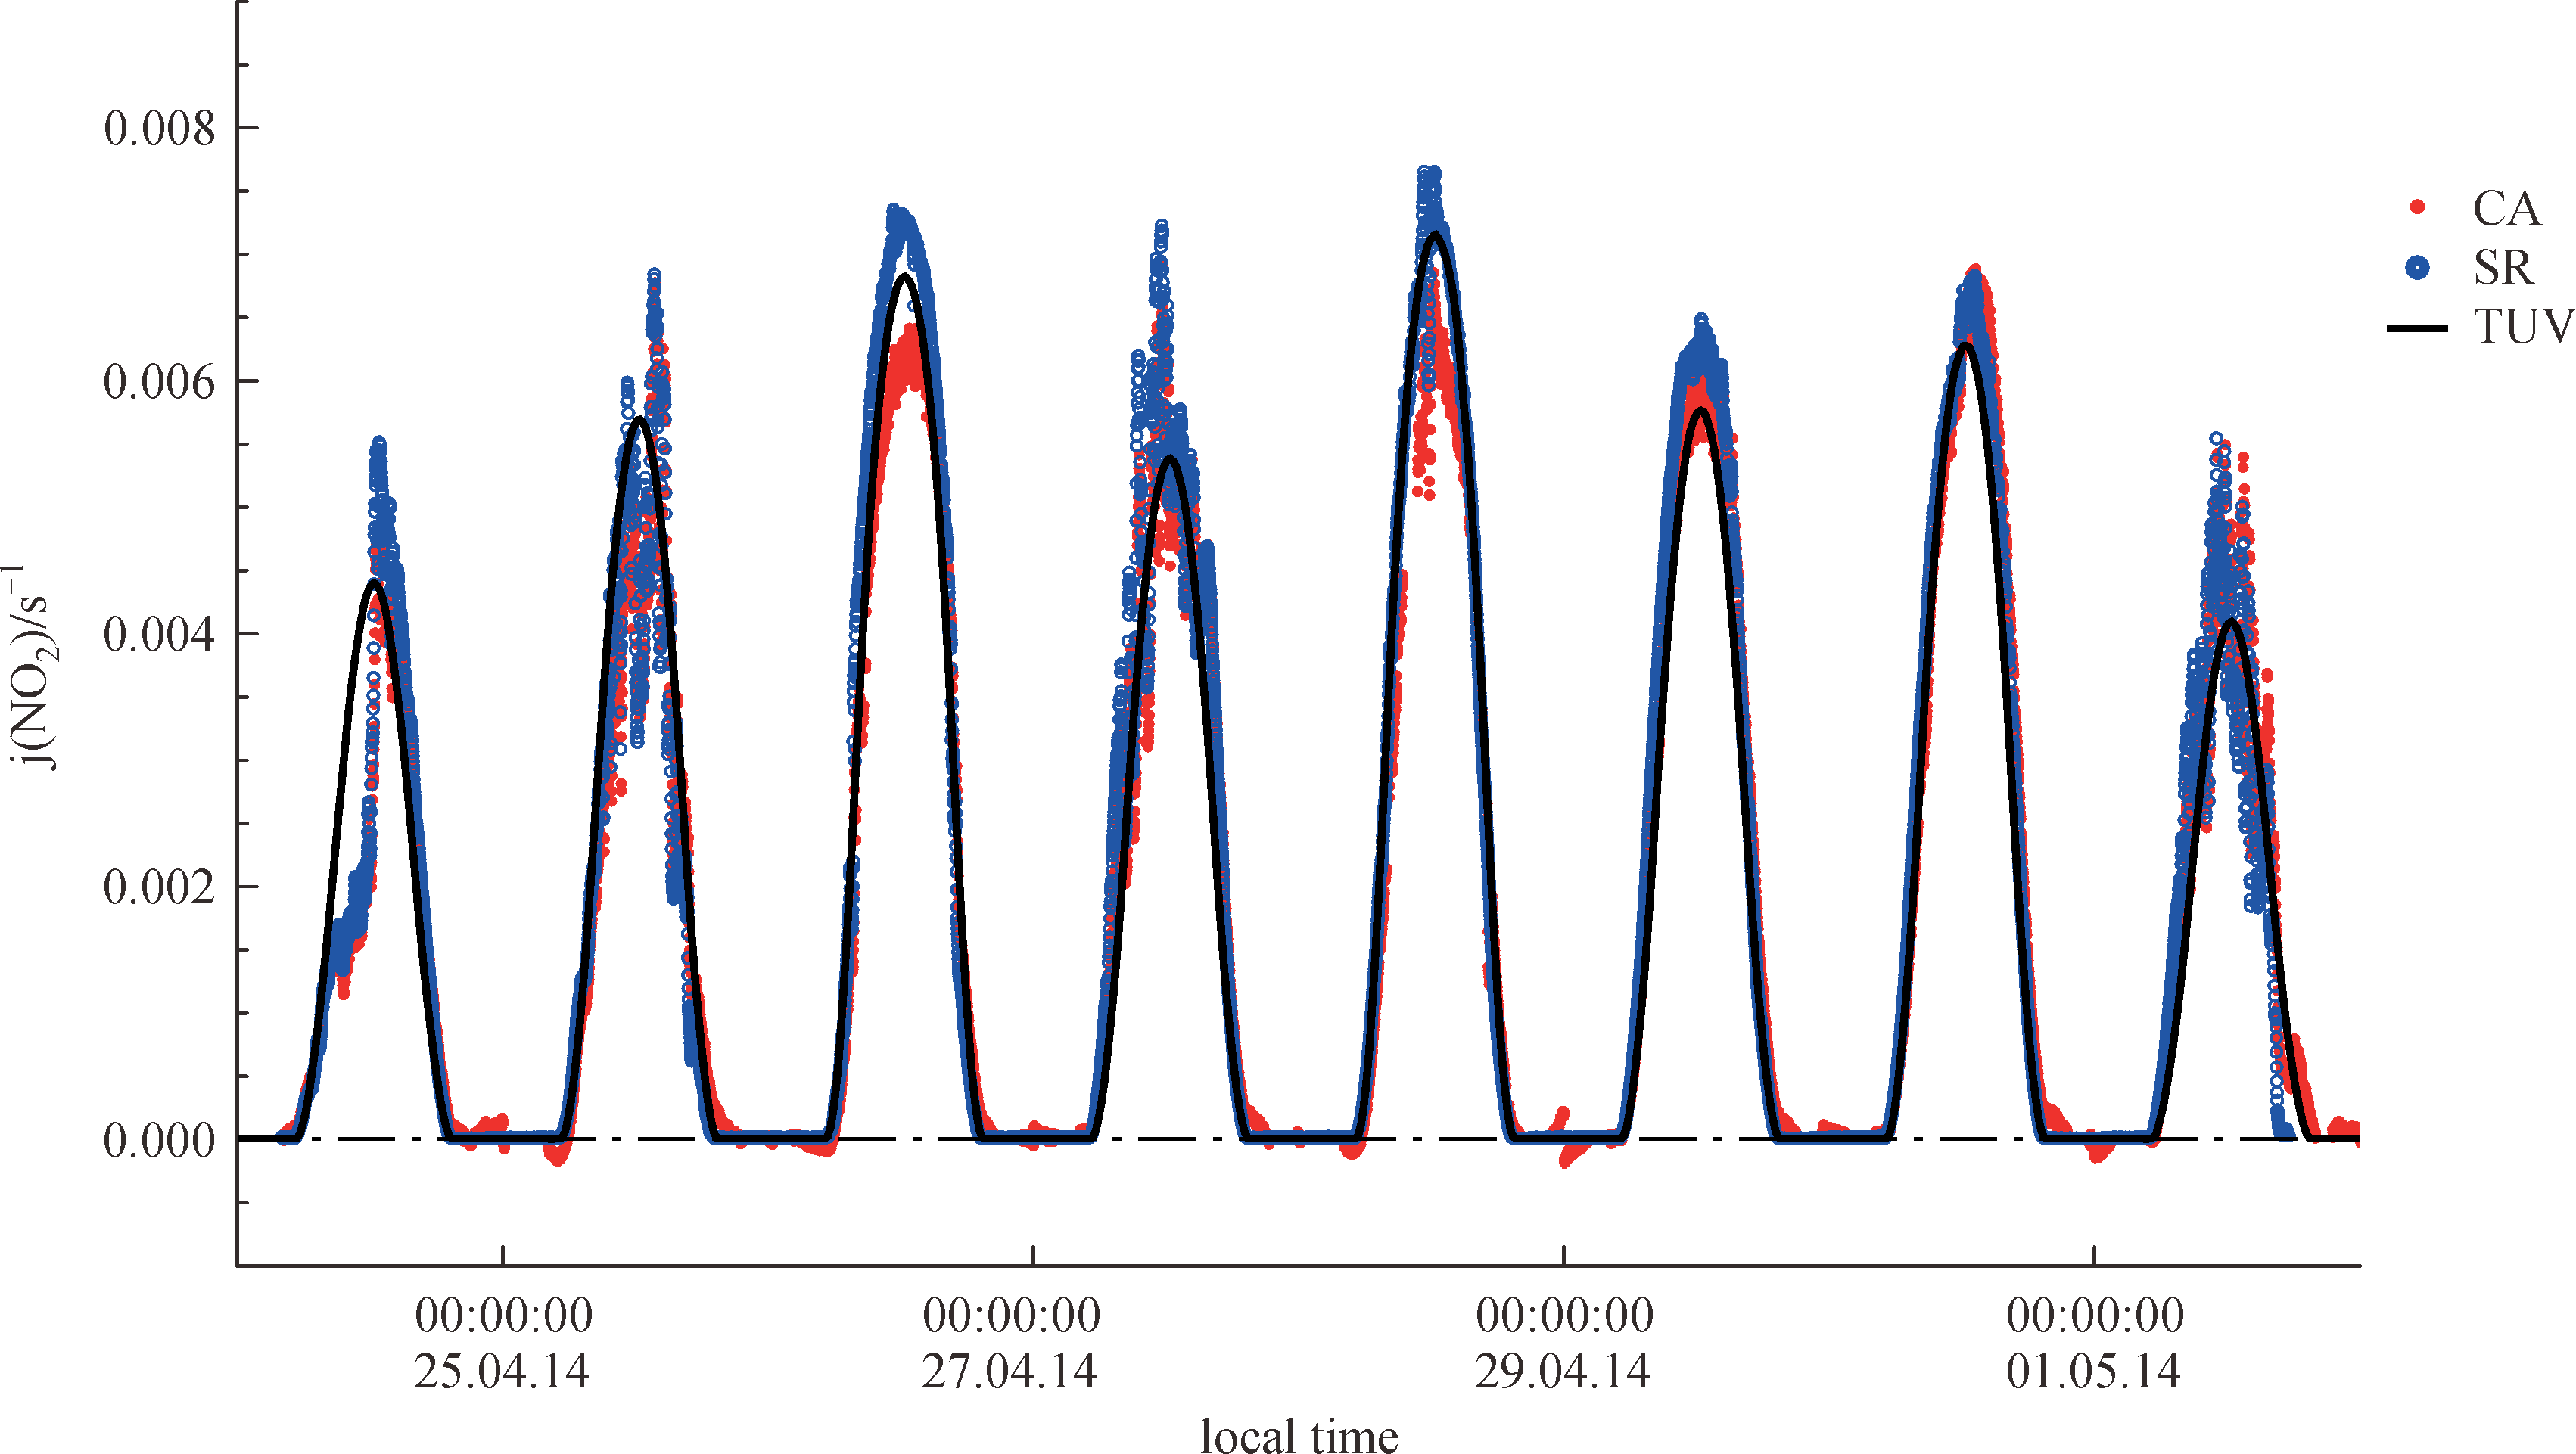
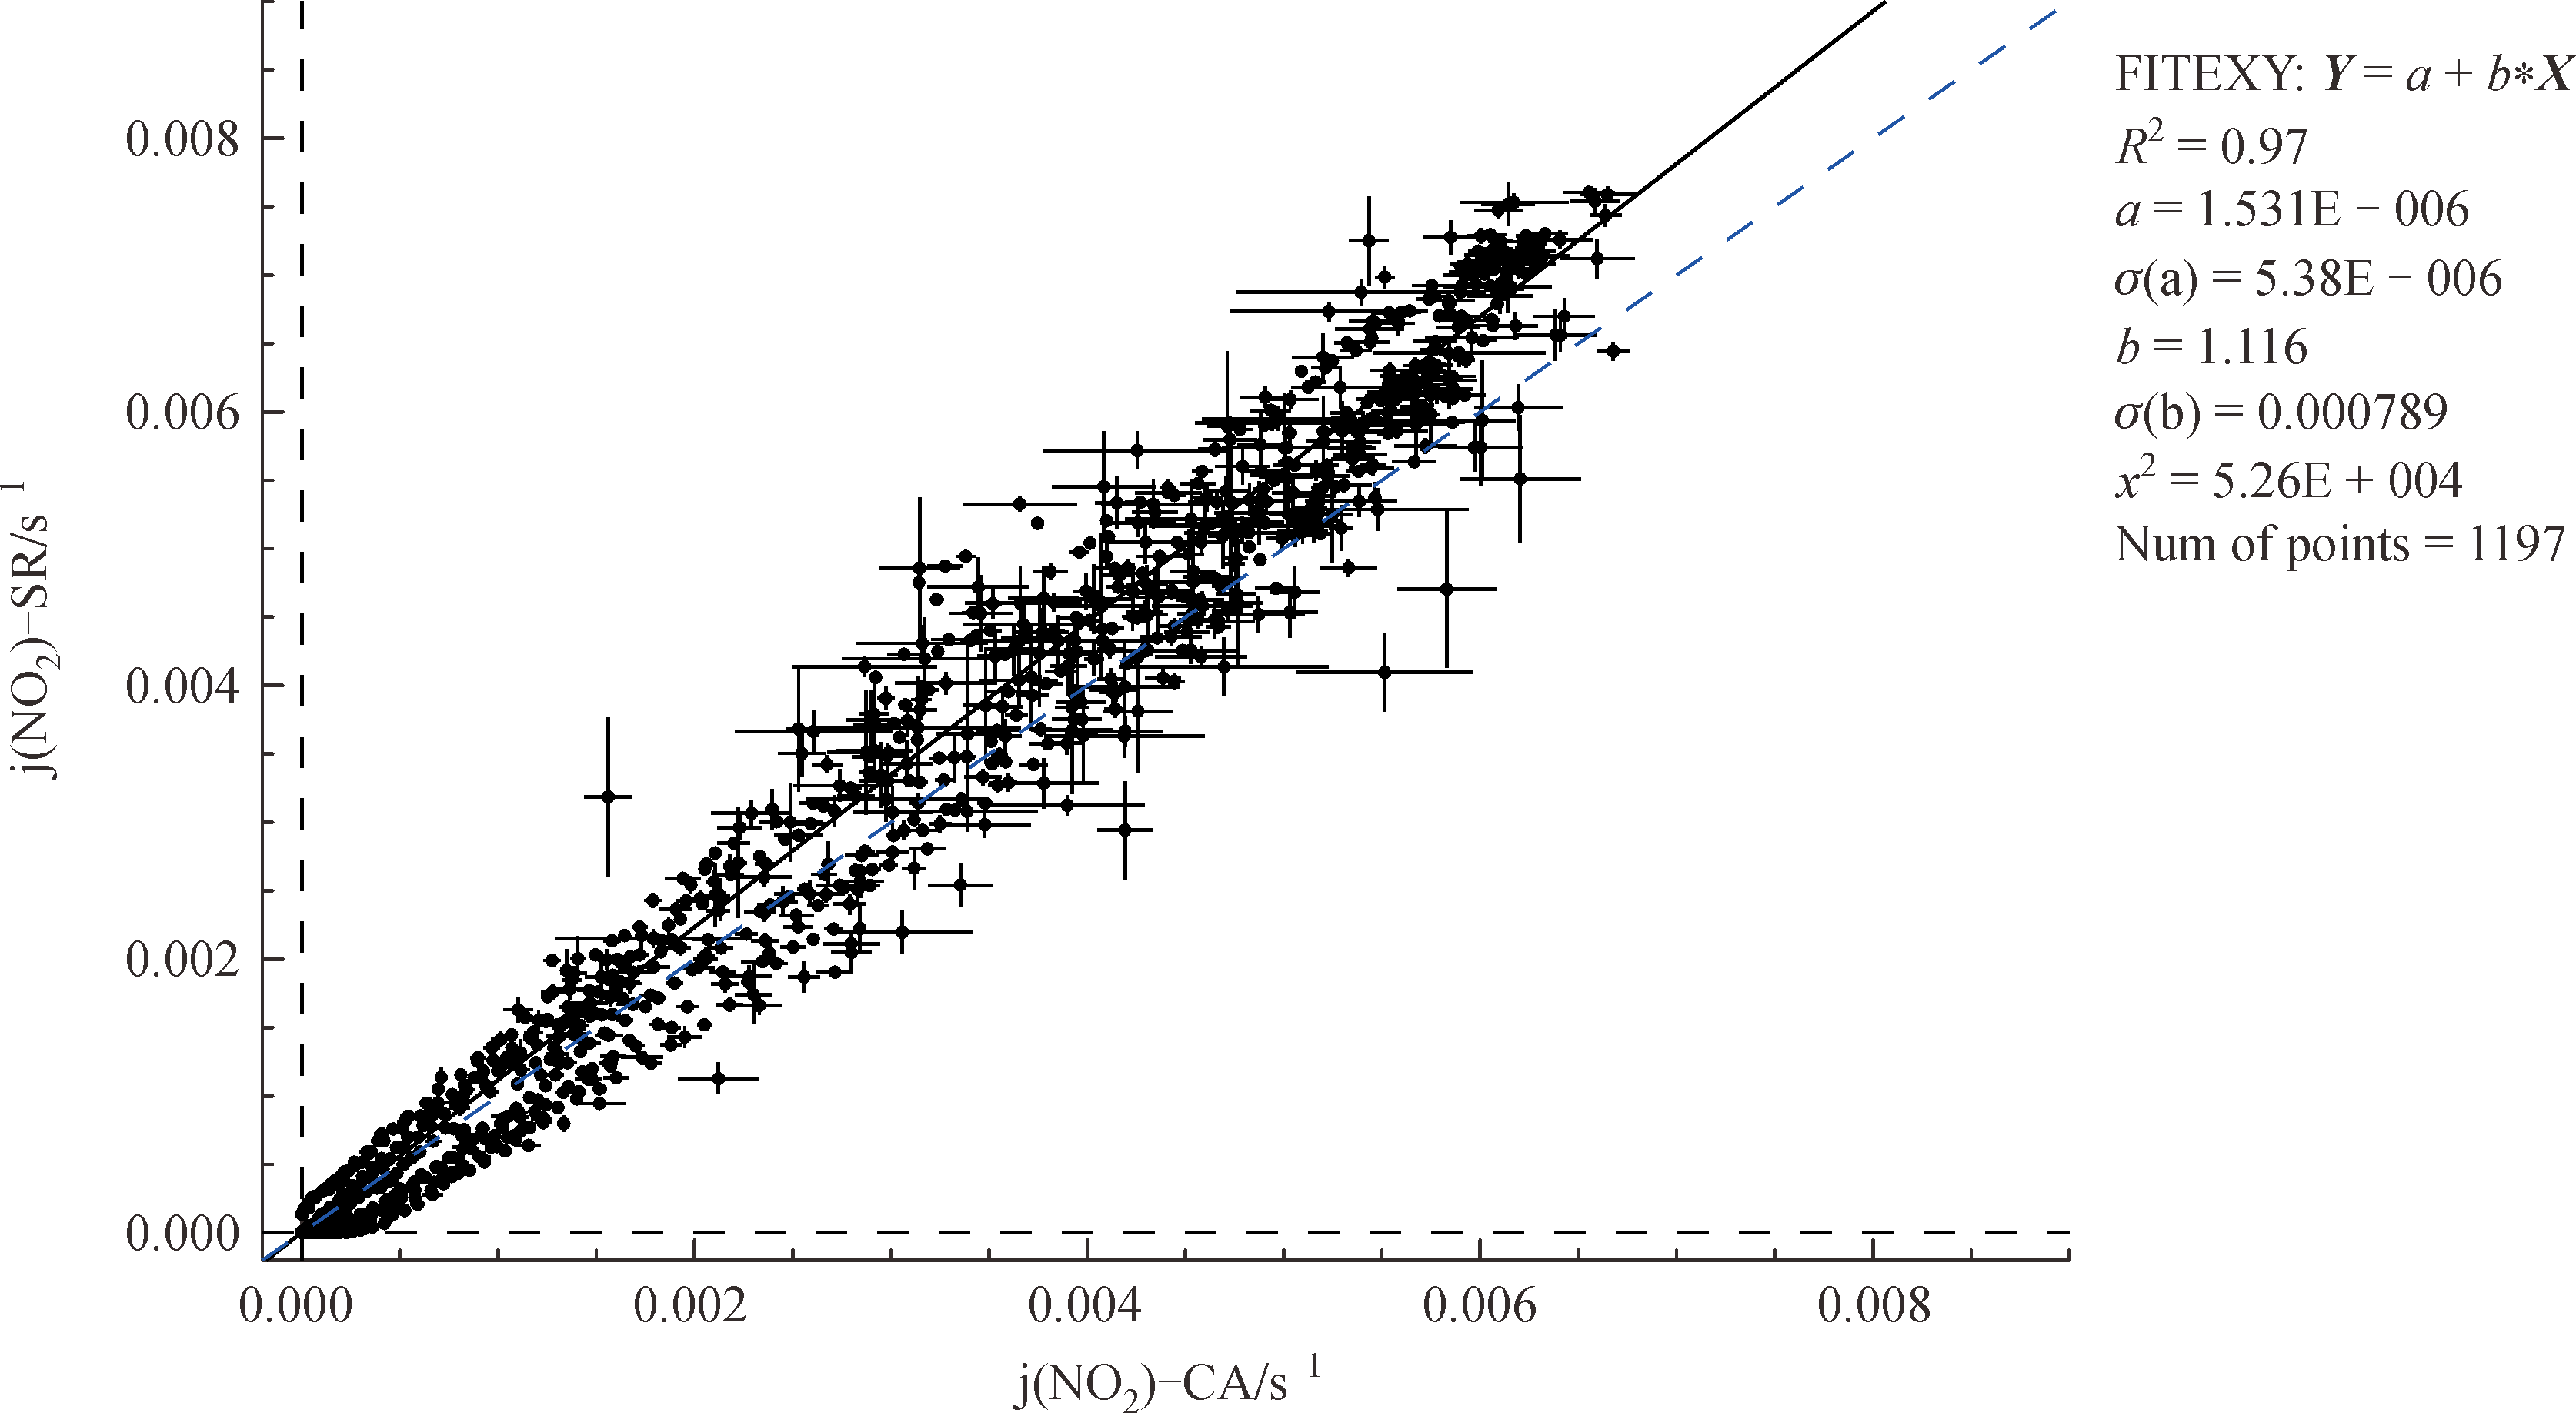
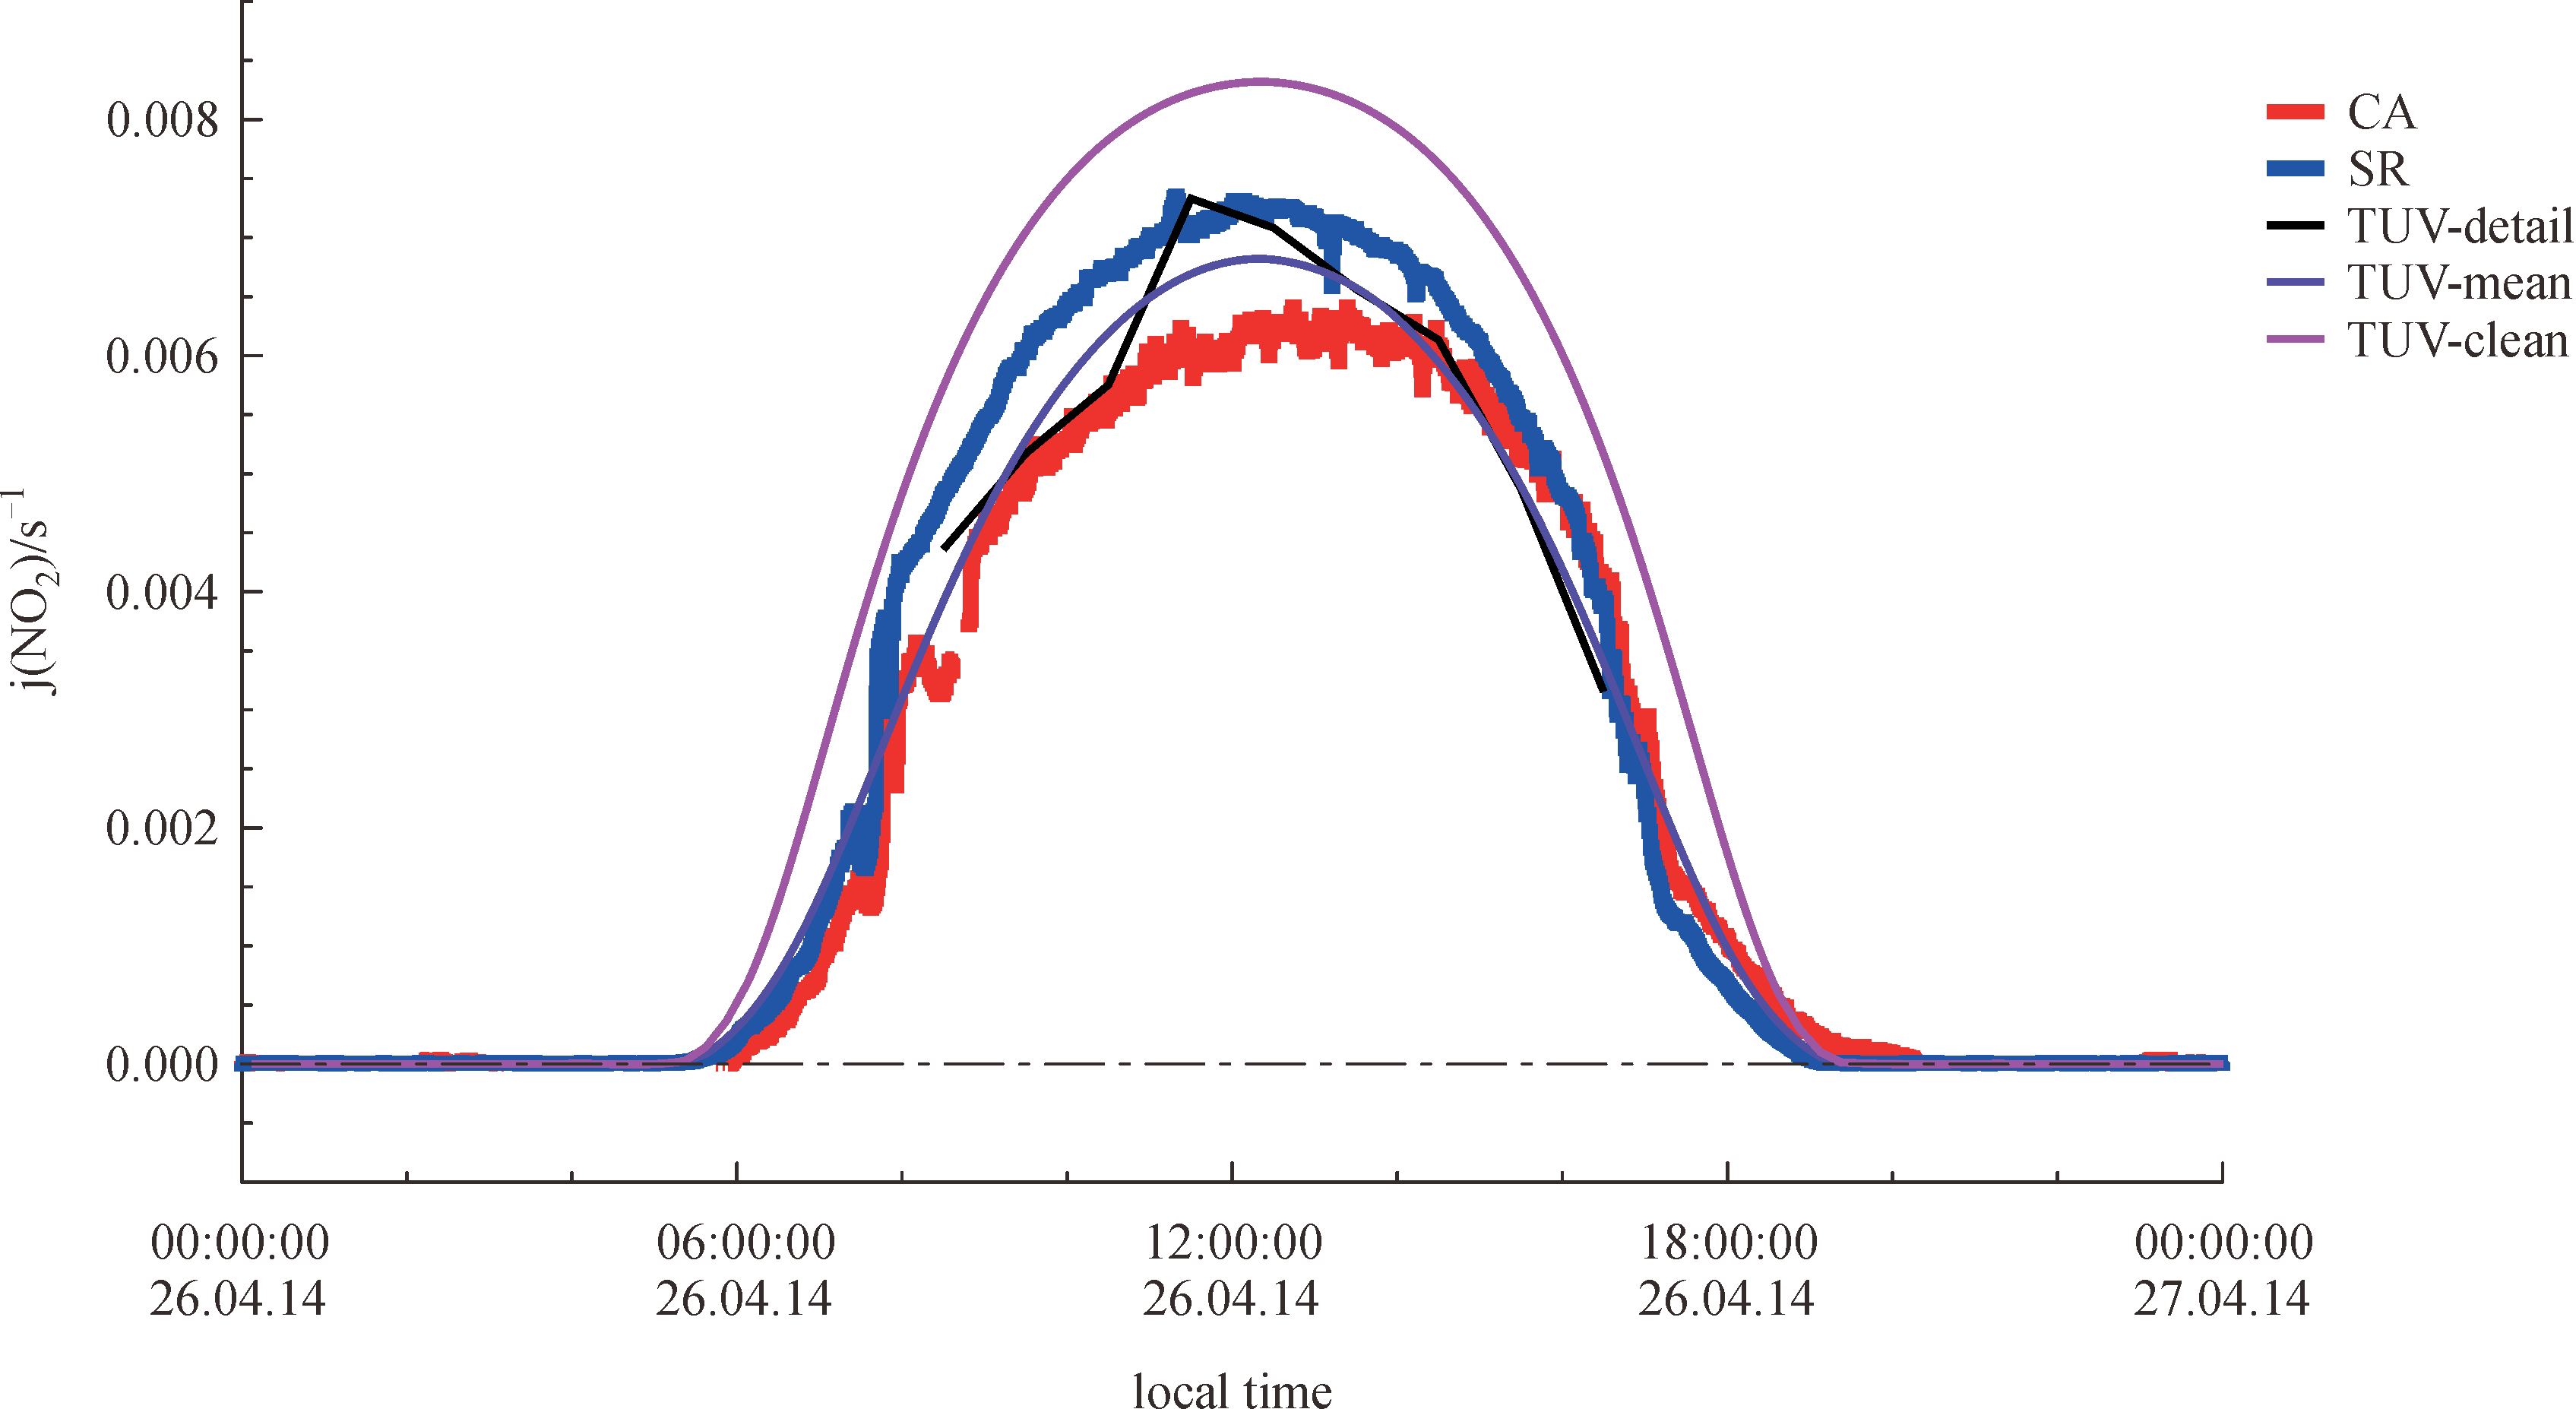
Abstract • Chemical actinometer (CA) was built for NO2 photolysis frequency, j(NO2), analysis. • CA data (10% accuracy) were compared with spectroradiometer (SR) data. • Long-term j(NO2) measurement was validated by comparison of CA and SR. • Dis-benefit of aerosol on j(NO2) due toparticulate matter (PM2.5) control on O3. The photolysis frequency of NO2, j(NO2), is an important analytical parameter in the study of tropospheric chemistry. A chemical actinometer (CA) was built to measure the ambient j(NO2) based on a high precision NOx instrument with 1 min time resolution. Parallel measurements of the ambient j(NO2) by using the CA and a commercial spectroradiometer (SR) were conducted at a typical urban site (Peking University Urban Environmental Monitoring Station) in Beijing. In general, good agreement was achieved between the CA and SR data with a high linear correlation coefficient (R2 = 0.977) and a regression slope of 1.12. The regression offset was negligible compared to the measured signal level. The j(NO2) data were calculated using the tropospheric ultraviolet visible radiation (TUV) model, which was constrained to observe aerosol optical properties. The calculated j(NO2) was intermediate between the results obtained with CA and SR, demonstrating the consistency of all the parameters observed at this site. The good agreement between the CA and SR data, and the consistency with the TUV model results, demonstrate the good performance of the installed SR instrument. Since a drift of the SR sensitivity is expected by the manufacturer, we propose a regular check of the data acquired via SR against those obtained by CA for long-term delivery of a high quality series of j(NO2) data. Establishing such a time series will be invaluable for analyzing the long-term atmospheric oxidation capacity trends as well as O3 pollution for urban Beijing.
|
| Keywords
Photolysis frequency of nitrogen dioxide
Chemical actinometer
Spectroradiometer
Tropospheric ultraviolet visible radiation model
|
|
Corresponding Author(s):
Keding Lu
|
|
Issue Date: 14 November 2016
|
|
| 1 |
Dickerson R R, Stedman D H, Delany A C. Direct measurements of ozone and nitrogen dioxide photolysis rates in the troposphere. Journal of Geophysical Research, 1982, 87(C7): 4933–4946
|
| 2 |
Hofzumahaus A, Kraus A, Muller M. Solar actinic flux spectroradiometry: a technique for measuring photolysis frequencies in the atmosphere. Applied Optics, 1999, 38(21): 4443–4460
|
| 3 |
Hofzumahaus A. Measurement of photolysis frequencies in the atmosphere. In: Heard D, ed. Analytical Techniques for Atmospheric Measurement. Oxford: Blackwell,2006, 421
|
| 4 |
Jackson J O, Stedman D H, Smith R G, Hecker L H, Warner P O. Direct NO2 photolysis rate monitor. Review of Scientific Instruments, 1975, 46(4): 376–378
|
| 5 |
Lantz K O, Shetter R E, Cantrell C A, Flocke S J, Calvert J G, Madronich S. Theoretical, actinometric, and radiometric determinations of the photolysis rate coefficient of NO2 during the Mauna Loa Observatory Photochemistry Experiment 2. Journal of Geophysical Research, D, Atmospheres, 1996, 101(D9): 14613–14630
|
| 6 |
Harvey R B, Stedman D H, Chameides W. Determination of the absolute rate of solar photolysis of NO2. Journal of the Air Pollution Control Association, 1977, 27(7): 663–666
|
| 7 |
Madronich S.Intercomparison of NO2 photodissociation and U.V. radiometer measurements. Atmospheric Environment, 1987, 21(3): 569–578
|
| 8 |
Shetter R E,MaDaniel A H, Cantrell C A, Madronich S, Calvert J G. Actinometer and eppley radiometer measurements of the NO2 photolysis rate coefficient during the Mauna Loa Observatory Photochemistry Experiment. Journal of Geophysical Research, 1992, 97(D10): 10349–10359
|
| 9 |
Brauers T, Hofzumahaus A. Latitudinal variation of measured NO2 photolysis frequencies over the Atlantic Ocean between 50°N and 30°S. Journal of Atmospheric Chemistry, 1992, 15(3–4): 269–282
|
| 10 |
Kelley P, Dickerson R R. Rate of NO2 photolysis from the surface to 7.6 km altitude in clear-sky and clouds. Geophysical Research Letters, 1995, 22(19): 2621–2624
|
| 11 |
Madronich S, Hastie D R, Ridley B A, Schiff H I. Measurement of the photodissociation coefficient of NO2 in the atmosphere: I. Method and surface measurements. Journal of Atmospheric Chemistry, 1983, 3(25): 3–25
|
| 12 |
Madronich S, Hastie D R, Schiff H I, Ridley B A. Measurement of the photodissociation coefficient of NO2 in the atmosphere: II. Stratospheric measurements. Journal of Atmospheric Chemistry, 1985, 3(2): 233–245
|
| 13 |
Zafonte L, Rieger P L, Holmes J R. Nitrogen dioxide photolysis in the Los Angeles atmosphere. Environmental Science & Technology, 1977, 11(5): 483–487
|
| 14 |
Parrish D D, Murphy D M, Albritton D L, Fehsenfeld F C. The measurement of the photodissociation rate of NO2 in the atmosphere. Atmospheric Environment, 1983, 17(7): 1365–1379
|
| 15 |
Kraus A, Rohrer F, Hofzumahaus A. Intercomparison of NO2 photolysis frequency measurements by actinic flux spectroradiometry and chemical actinometry during JCOM97. Geophysical Research Letters, 2000, 27(8): 1115–1118
|
| 16 |
Trebs I, Bohn B, Ammann C, Rummel U, Blumthaler M, Konigstedt R, Meixner F X, Fan S, Andreae M O. Relationship between the NO2 photolysis frequency and the solar global irradiance. Atmospheric Measurement Techniques, 2009, 2(2): 725–739
|
| 17 |
Shetter R E, Junkermann W, Swartz W H, Frost G J, Crawford J H, Lefer B L, Barrick J D, Hall S R, Hofzumahaus A, Bais A, Calvert J G, Cantrell C A, Madronich S, Muller M, Kraus A, Monks P S, Edwards G D, McKenzie R, Johnston P, Schmitt R, Griffioen E, Krol M, Kylling A, Dickerson R R, Lloyd S A, Martin T, Gardiner B, Mayer B, Pfister G, Roth E P, Koepke P, Ruggaber A, Schwander H, van Weele M. Photolysis frequency of NO2: measurement and modeling during the international photolysis frequency measurement and modeling intercomparison (IPMMI). Journal of Geophysical Research, D, Atmospheres, 2003, 108(D16): 1–13
|
| 18 |
Fan Z H, Mao J T. The measurement of solar UV spectrum and NO2 photolysis rate. Scientia Atmospherica Sinica, 1991, 15(4): 109–115 (in Chinese)
|
| 19 |
Su H, Cheng Y F, Shao M, Gao D F, Yu Z Y, Zeng L M, Slanina J, Zhang Y H, Wiedensohler A. Nitrous acid (HONO) and its daytime sources at a rural site during the 2004 PRIDE-PRD experiment in China. Journal of Geophysical Research, D, Atmospheres, 2008, 113(D14312): 1–9
|
| 20 |
Su H. HONO: a study to its sources and impacts from field measurements at the sub-urban areas of PRD region. Dissertation for the Doctoral Degree. Beijing: Peking University, 2008 (in Chinese)
|
| 21 |
Tao J C, Zhao C S, Ma N, Liu P F. The impact of aerosol hygroscopic growth on the single-scattering albedo and its application on the NO2 photolysis rate coefficient. Atmospheric Chemistry and Physics, 2014, 14(22): 12055–12067
|
| 22 |
Xue L K, Gu R R, Wang T, Wang X F, Saunders S, Blake D, Louie P K K, Luk C W Y, Simpson I, Xu Z, Wang Z, Gao Y, Lee S C, Mellouki A, Wang W X. Oxidative capacity and radical chemistry in the polluted atmosphere of Hong Kong and Pearl River Delta region: analysis of a severe photochemical smog episode. Atmospheric Chemistry and Physics, 2016, 16(15): 9891–9903
|
| 23 |
Lu K D, Zhang Y H, Su H, Shao M, Zeng L M, Zhong L J, Xiang Y R, Chang C C, Charles C K C, Wahner A. Regional ozone pollution and key controlling factors of photochemical ozone production in Pearl River Delta during summer time. Science China. Chemistry, 2010, 53(3): 651–663
|
| 24 |
Lu K D, Zhang Y H, Su H, Brauers T, Chou C C, Hofzumahaus A, Liu S C, Kita K, Kondo Y, Shao M, Wahner A, Wang J L, Wang X S, Zhu T. Oxidant (O-3 + NO2) production processes and formation regimes in Beijing. Journal of Geophysical Research, D, Atmospheres, 2014, 115(D7): D07303
|
| 25 |
Xue L K, Wang T, Louie P K K, Luk C W Y, Blake D R, Xu Z. Increasing external effects negate local efforts to control ozone air pollution: a case study of Hong Kong and implications for other Chinese cities. Environmental Science & Technology, 2014, 48(18): 10769–10775
|
| 26 |
Xue L K, Wang T, Gao J, Ding A J, Zhou X H, Blake D R, Wang X F, Saunders S M, Fan S J, Zuo H C, Zhang Q Z, Wang W X. Ground-level ozone in four Chinese cities: precursors, regional transport and heterogeneous processes. Atmospheric Chemistry and Physics, 2014, 14(23): 13175–13188
|
| 27 |
Li J F, Lu K D, Lv W, Li J, Zhong L J, Ou Y B, Chen D H, Huang X, Zhang Y H. Fast increasing of surface ozone concentrations in Pearl River Delta characterized by a regional air quality monitoring network during 2006–2011. Journal of Environmental Sciences-China, 2014, 26(1): 23–36
|
| 28 |
Zhang Q, Yuan B, Shao M, Wang X, Lu S, Lu K, Wang M, Chen L, Chang C C, Liu S C. Variations of ground-level O3 and its precursors in Beijing in summertime between 2005 and 2011. Atmospheric Chemistry and Physics, 2014, 14(12): 6089–6101
|
| 29 |
Wang T, Ding A J, Gao J, Wu W S. Strong ozone production in urban plumes from Beijing, China. Geophysical Research Letters, 2006, 33(21): L21806
|
| 30 |
Merienne M F, Jenouvrier A, Coquart B. The NO2 absorption spectrum 1 absorption cross sections at ambient temperature in the 300–500nm region. Journal of Atmospheric Chemistry, 1995, 20(3): 281–297
|
| 31 |
Troe J. Are primary quantum yields of NO2 photolysis at l≤398 nm smaller than unity? International Journal of Research in Physical Chemistry & Chemical Physics, 2000, 214(5): 573–581
|
| 32 |
Atkinson R, Baulch D L, Cox R A, Crowley J N, Hampson R F, Hynes R G, Jenkin M E, Rossi M J, Troe J. Evaluated kinetic and photochemical data for atmospheric chemistry: Volume I- gas phase reactions of Ox, HOx, NOx and SOx species. Atmospheric Chemistry and Physics, 2004, 7(4): 1461–1738
|
| 33 |
National Aeronautics and Space Administration Aerosol robotic network Aerosol optical depth. 2014. Available online at (<Date>accessed March27, 2016</Date>) (in Chinese)
|
| 34 |
Press W H, Teukolsky S A, Vetterling W T, Flannery B P. Modeling of data. In: Press W H, Teukolsky S A, Vetterling W T, Flannery B P, eds. Numerical Recipes in C the Art of Scientific Computing, 2nd ed. Cambridge: Cambridge University, 1992, 694
|
| 35 |
Cantrell C. A technical note: review of methods for linear least-squares fitting of data and application to atmospheric chemistry problems. Atmospheric Chemistry and Physics, 2008, 8(17): 5477–5487
|
|
Viewed |
|
|
|
Full text
|
|
|
|
|
Abstract
|
|
|
|
|
Cited |
|
|
|
|
| |
Shared |
|
|
|
|
| |
Discussed |
|
|
|
|