|
|
|
Social media and mobility landscape: Uncovering spatial patterns of urban human mobility with multi source data |
Yilan Cui1, Xing Xie2, Yi Liu1( ) ) |
1. School of Environment, Tsinghua University, Beijing 100084, China
2. Microsoft Research Asia, Microsoft Corporation, Beijing 100080, China |
|
|
|
|
Abstract Check-in and survey data are explored to identify personal activity-specific places. Ways for detecting and moderating sample bias of Weibo check-in data is proposed. A graphic representation of urban activity intensity in Beijing, China is presented. The potential application of Weibo check-in data for urban analysis is introduced.
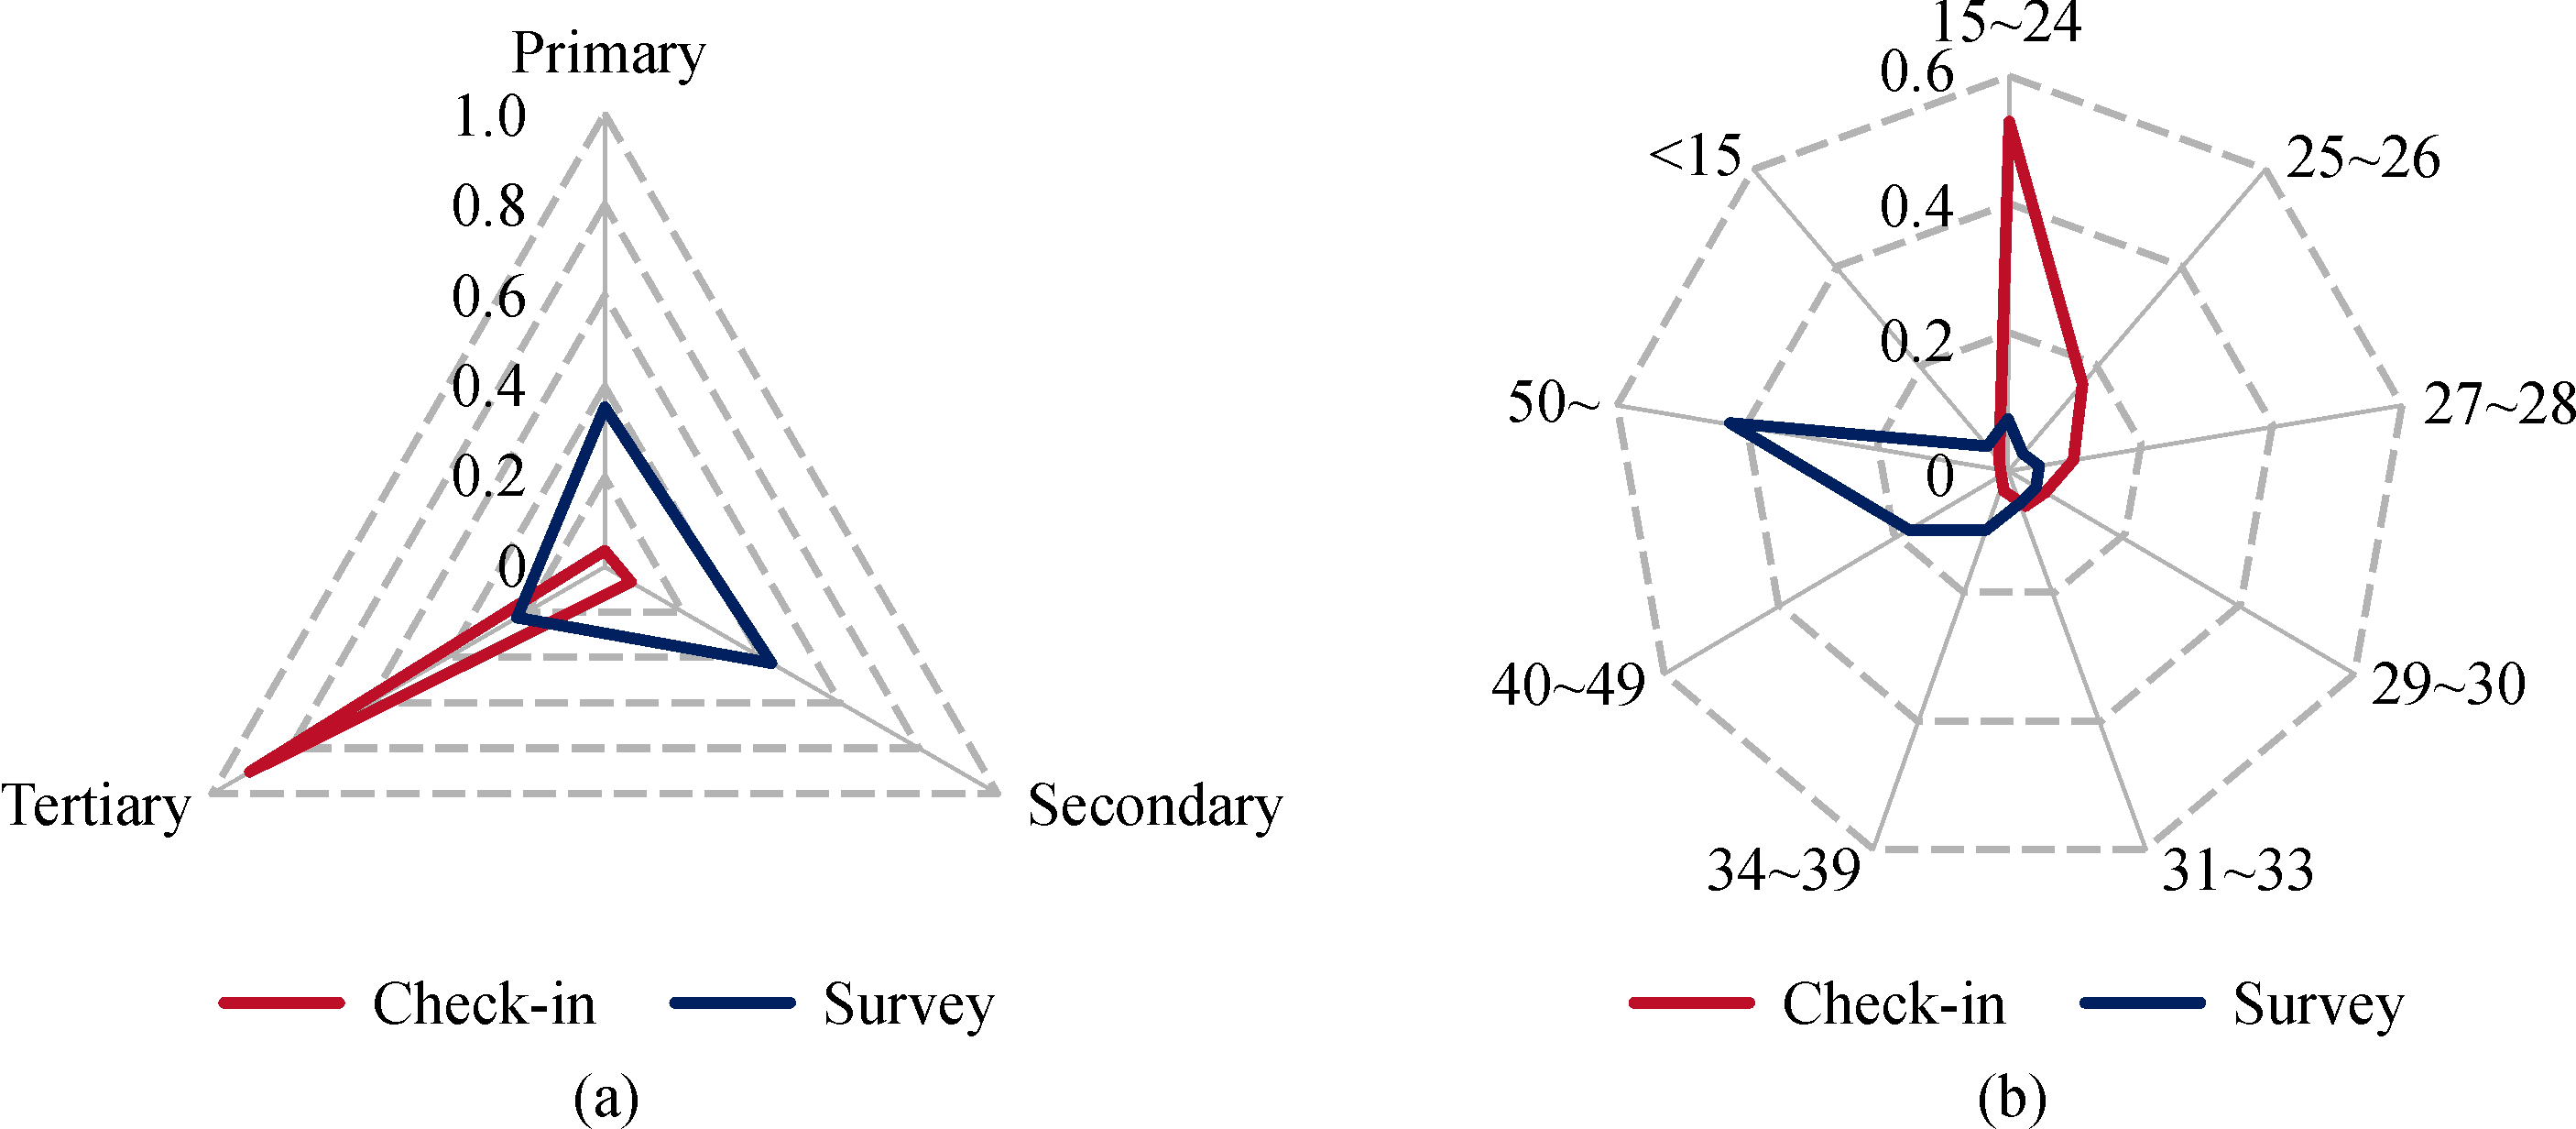
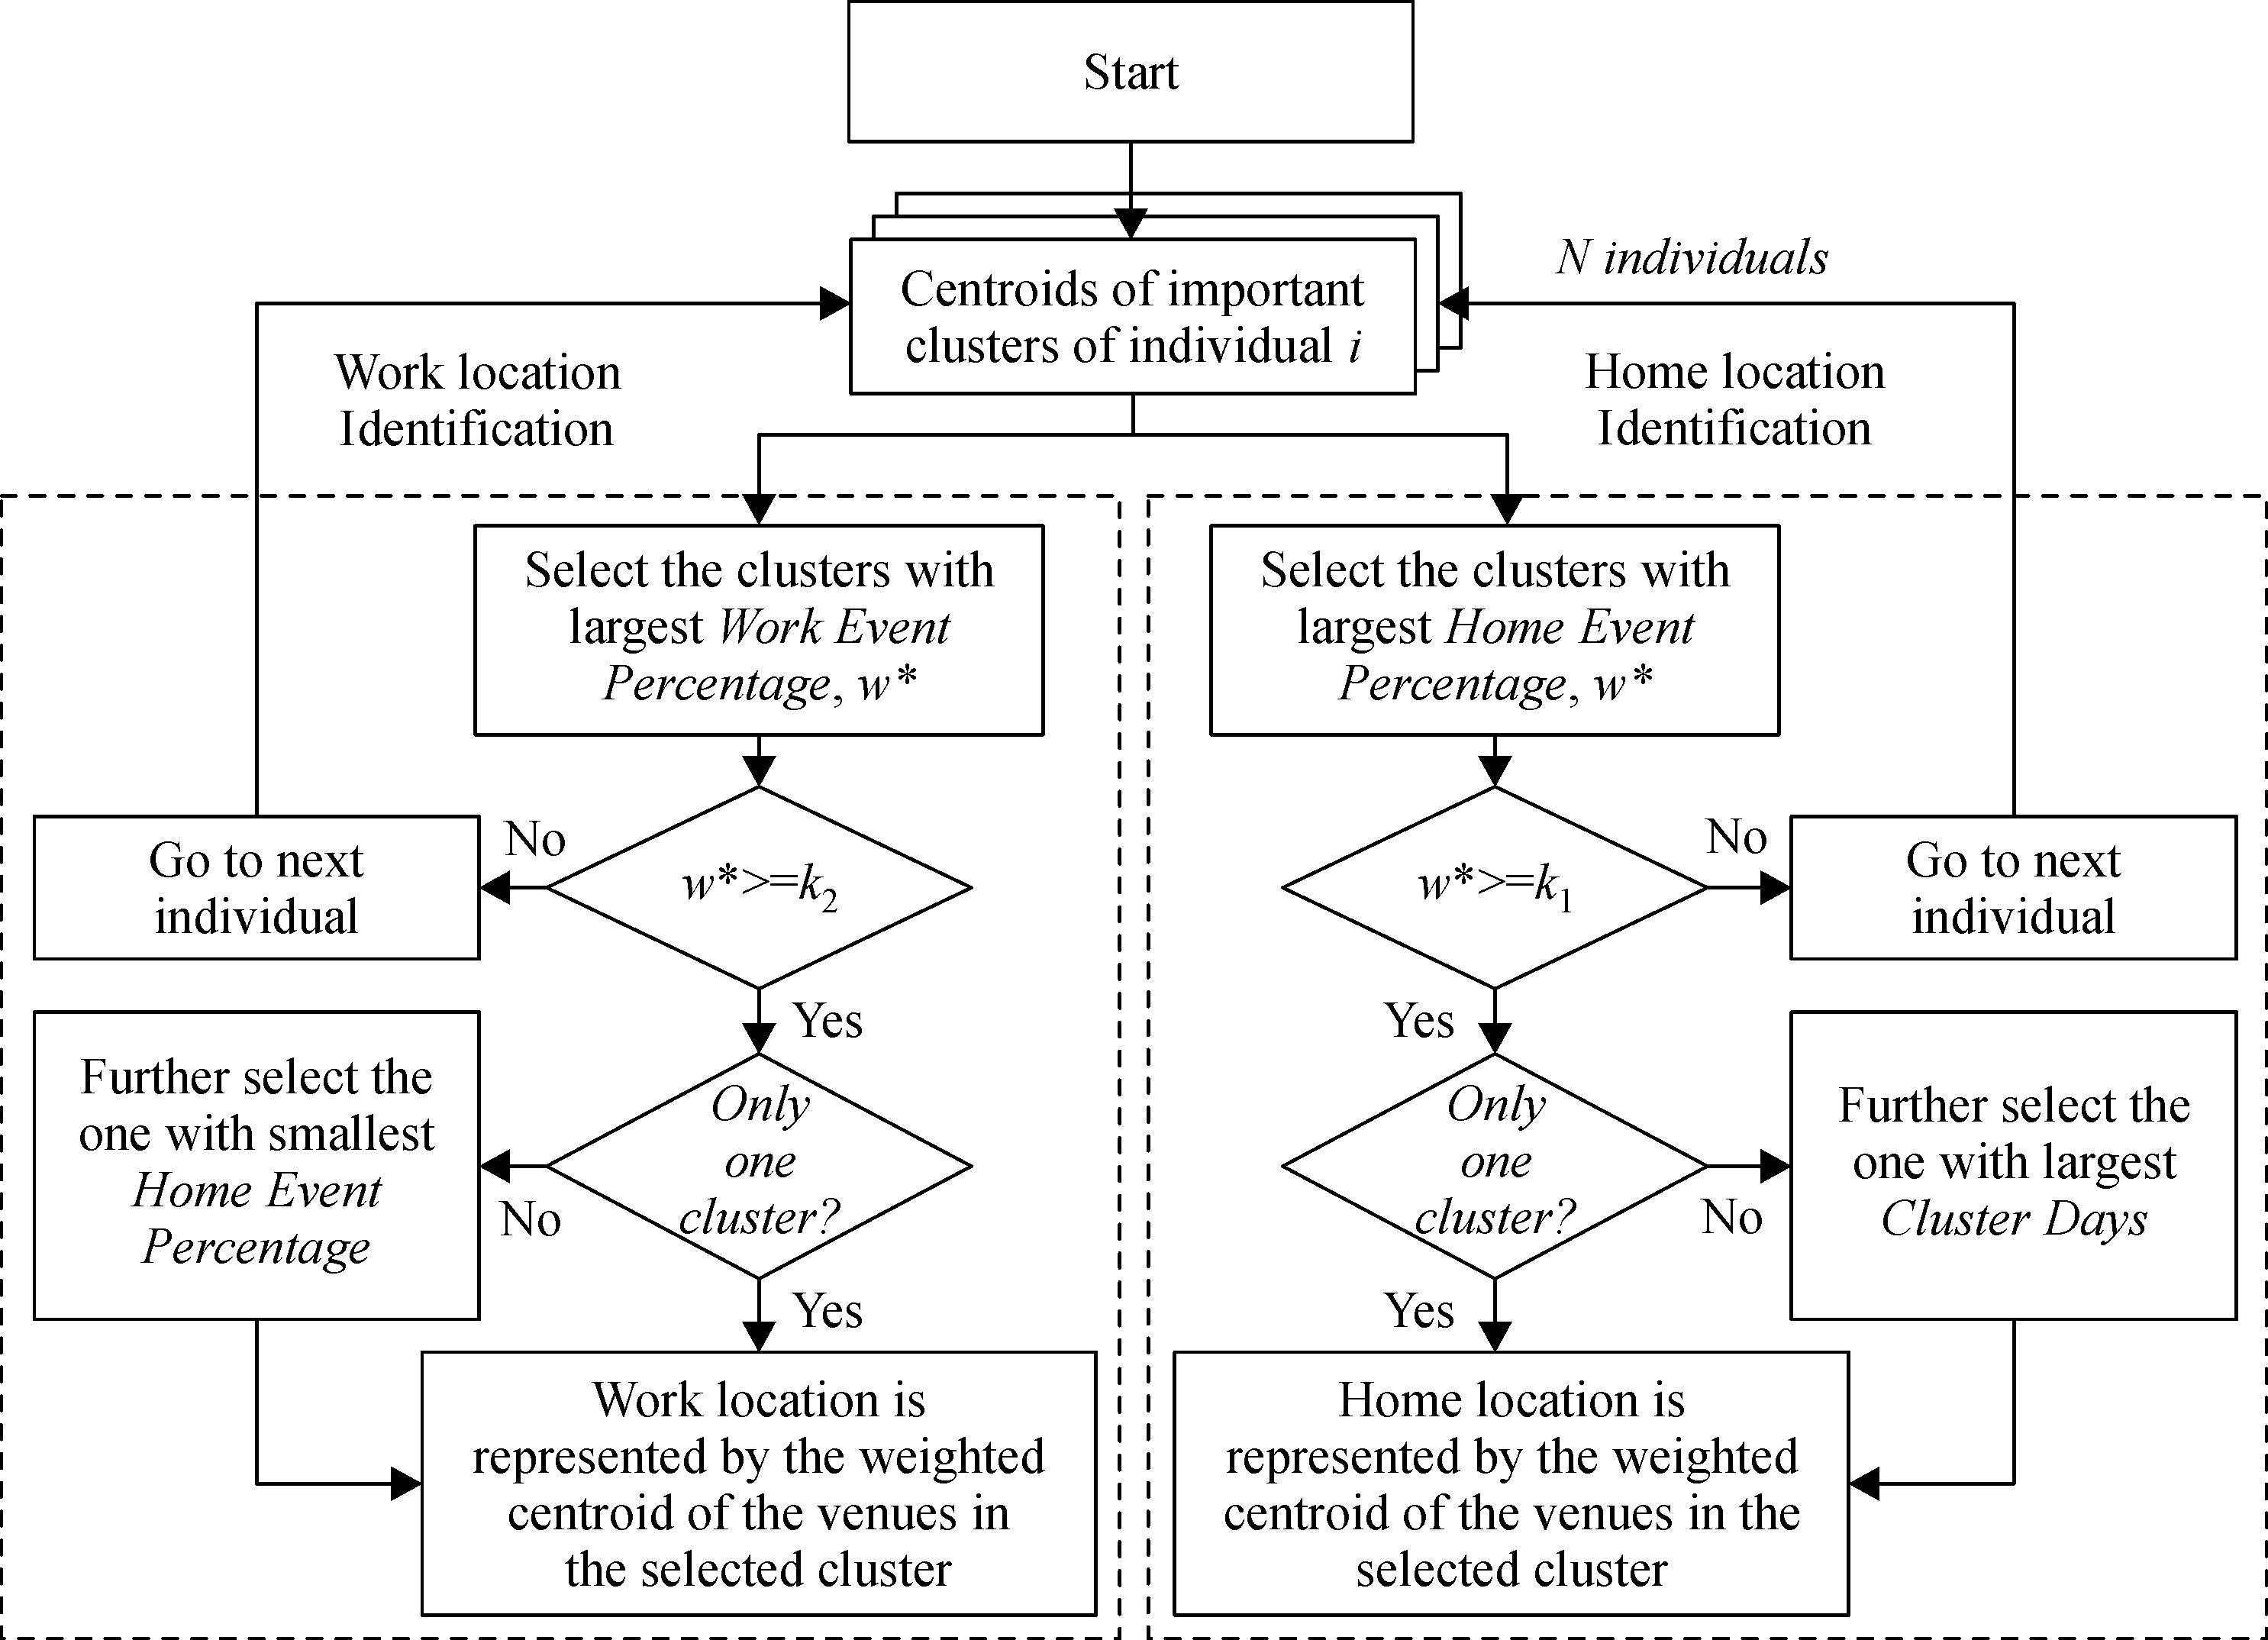
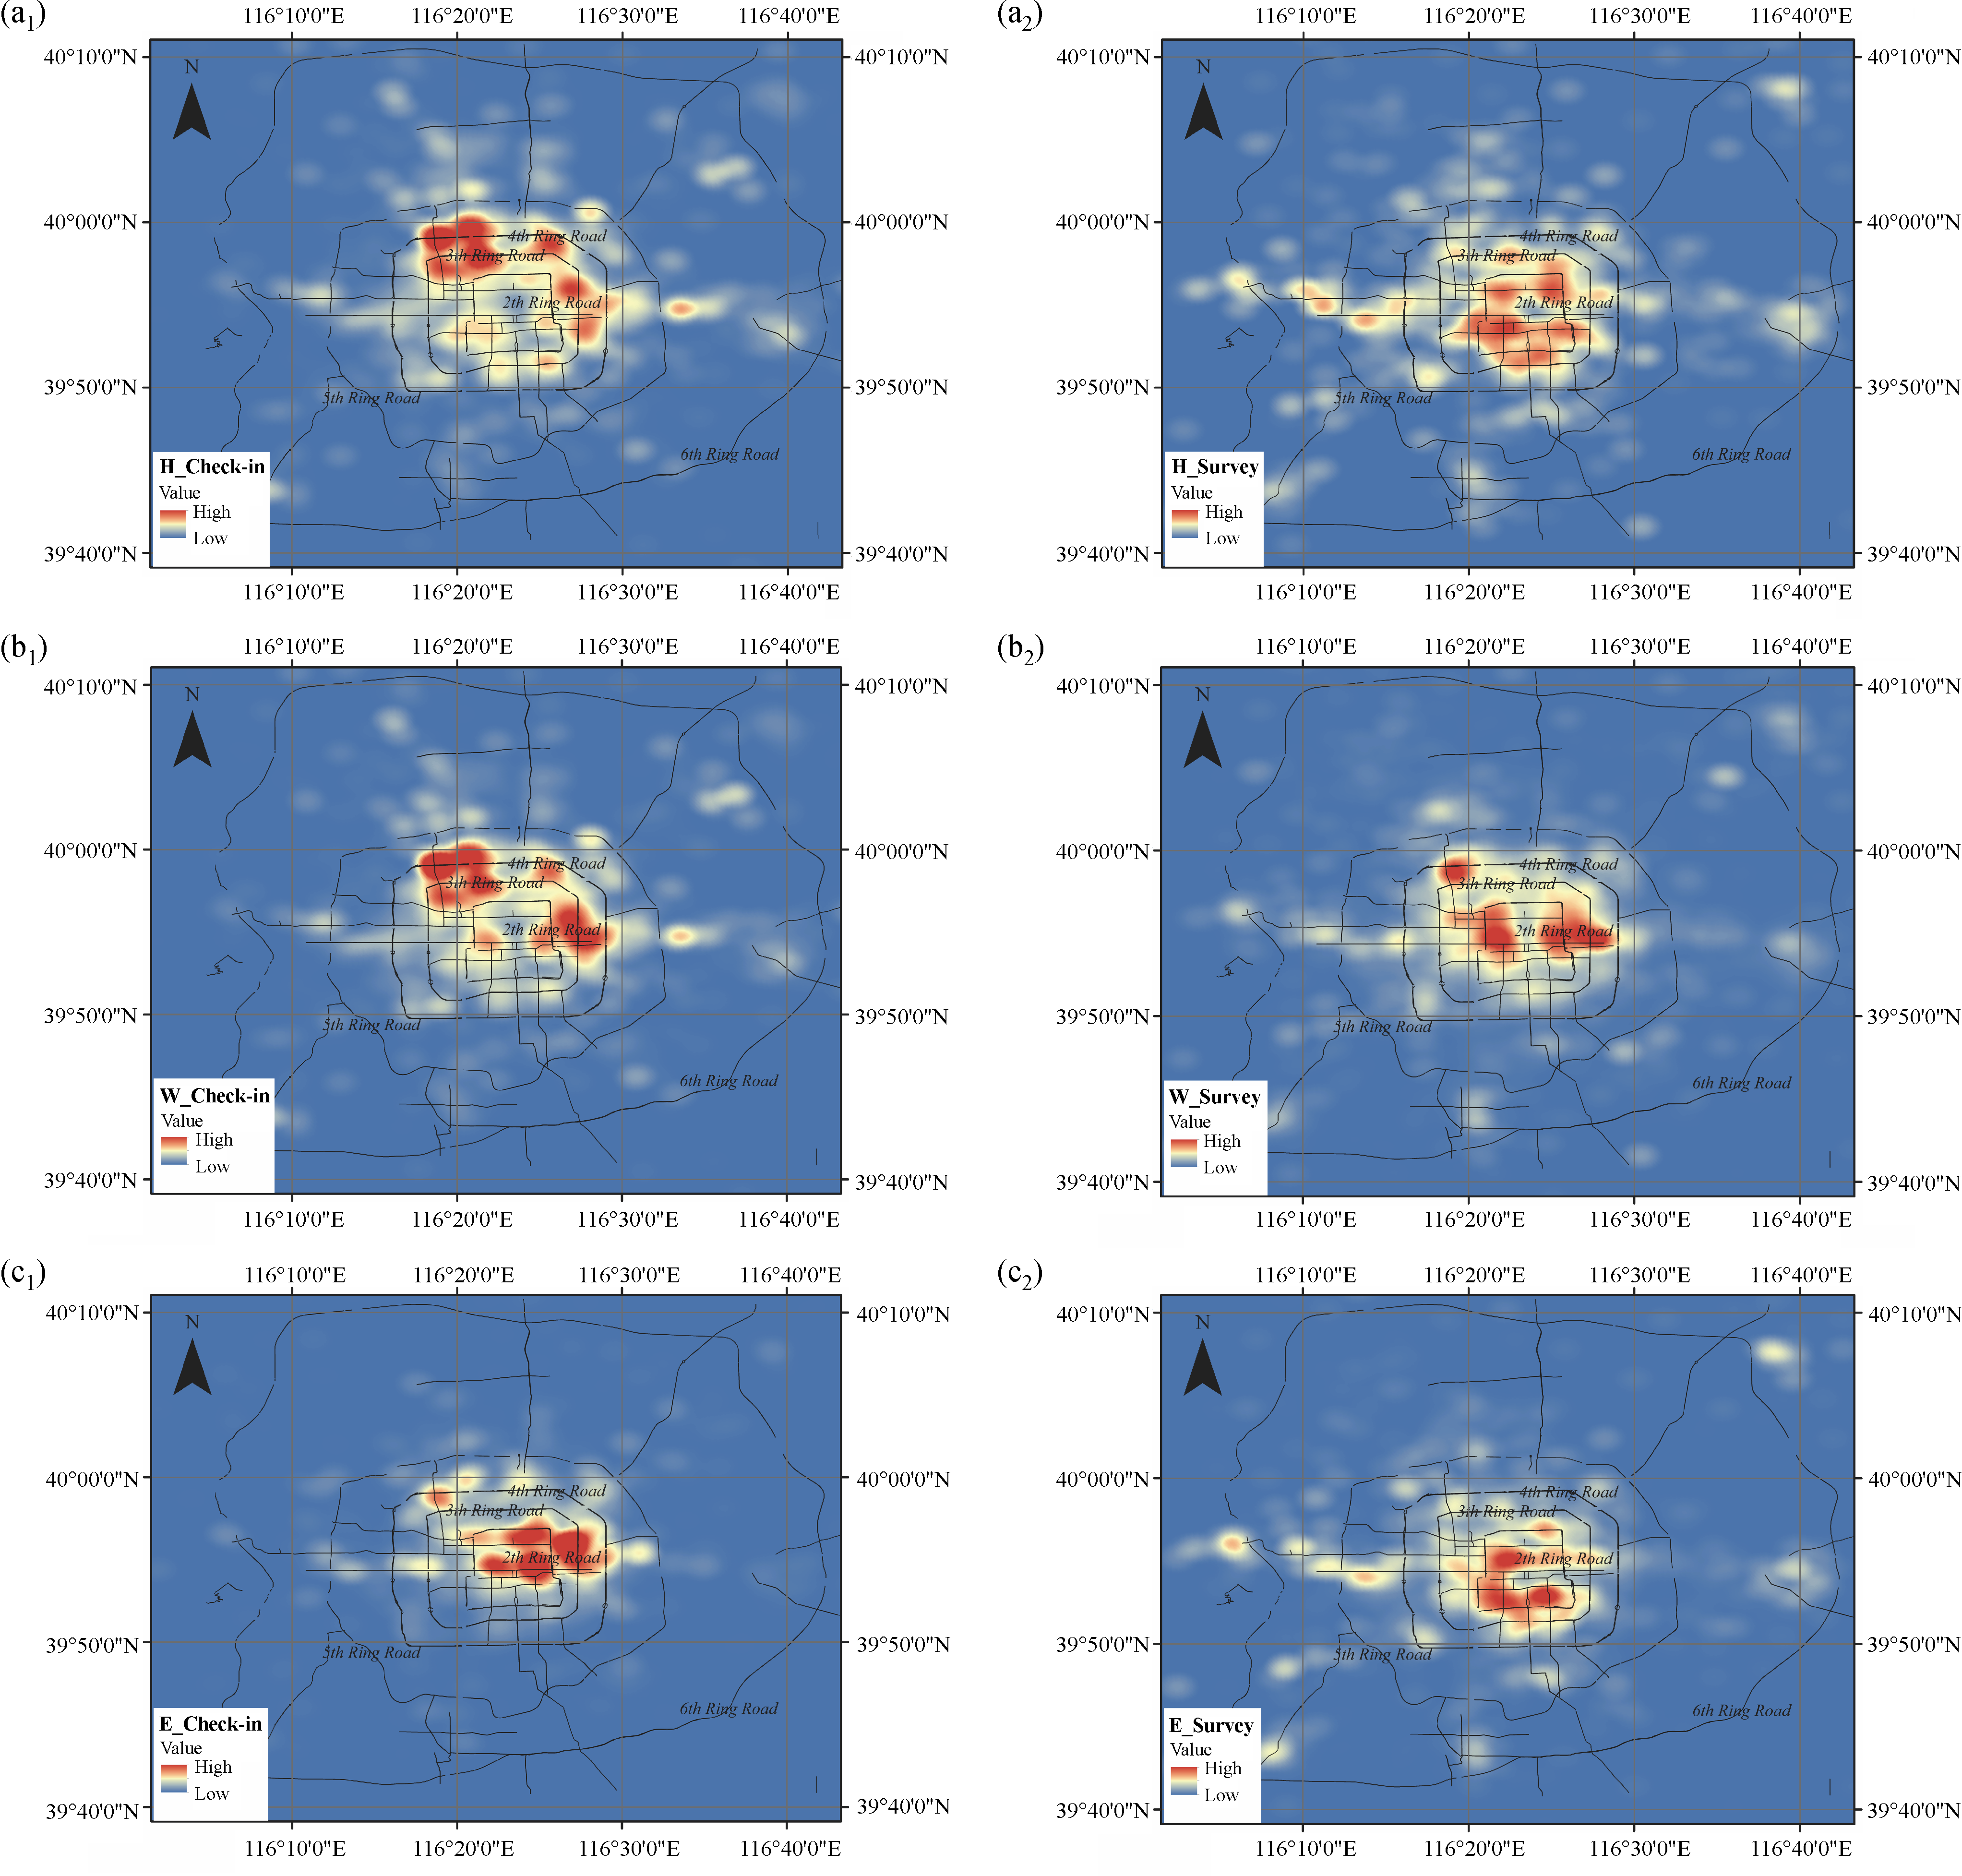
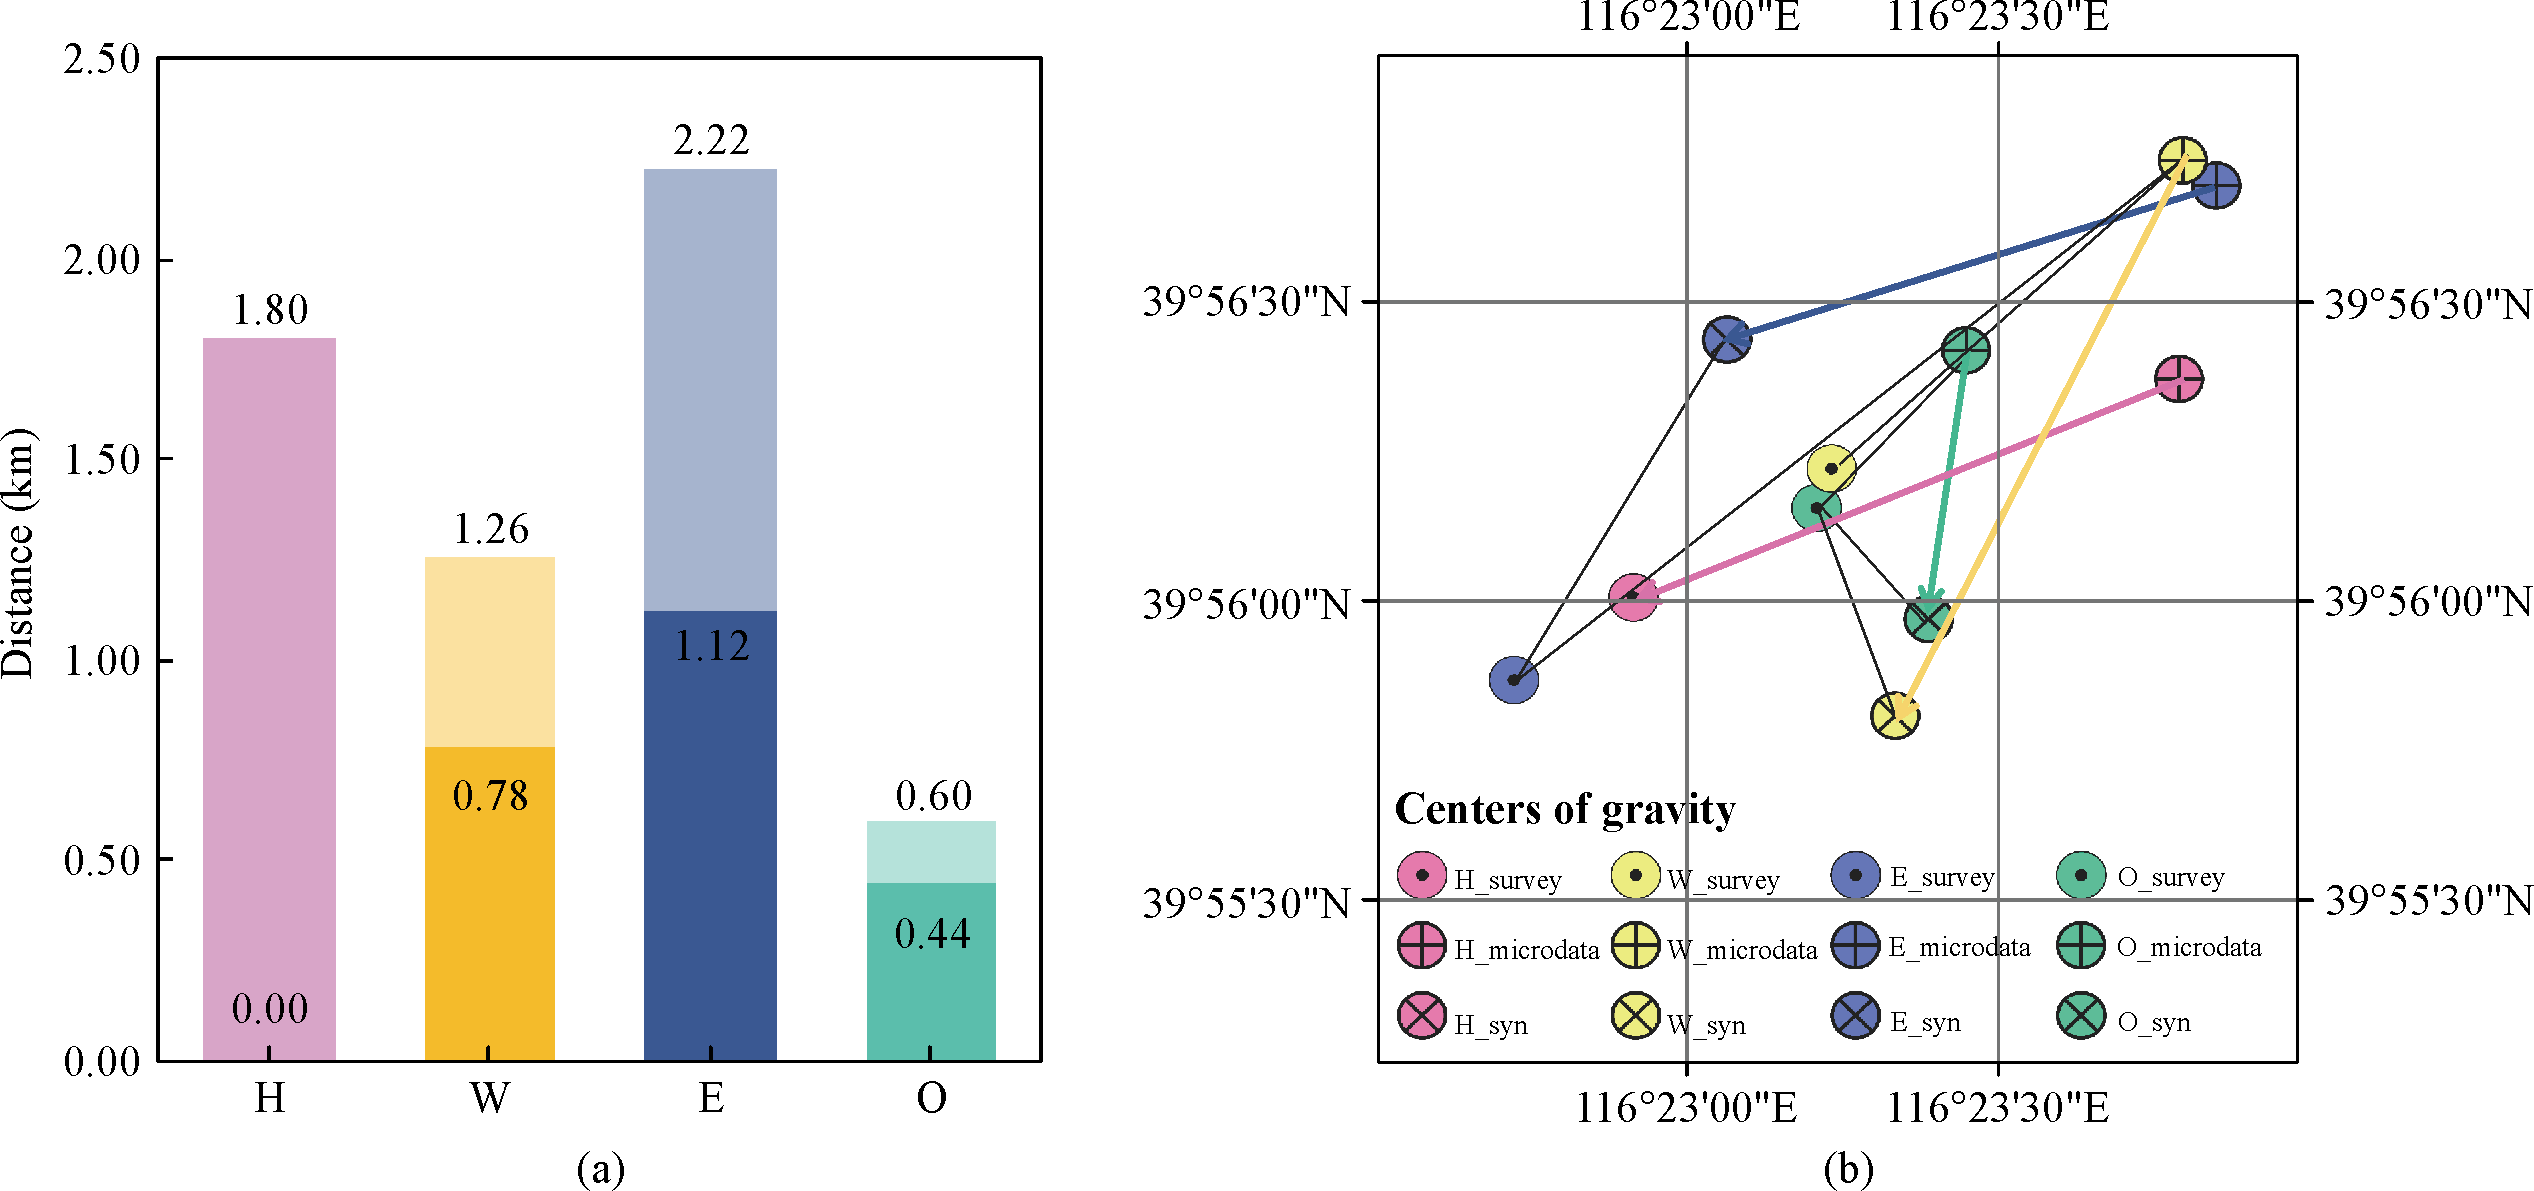
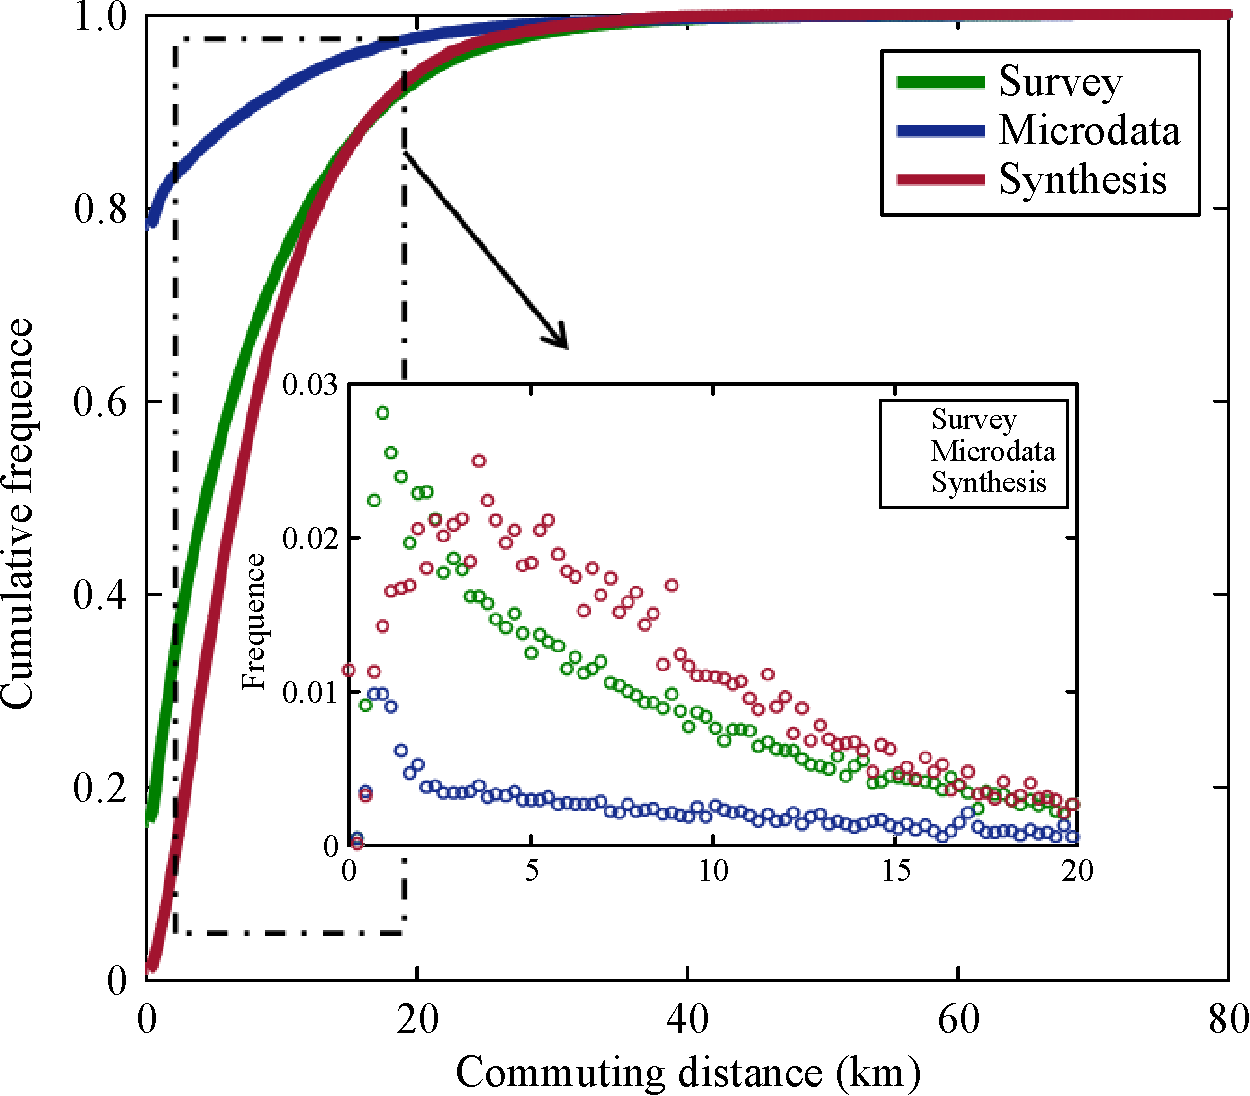
![]() In this paper, we present a three-step methodological framework, including location identification, bias modification, and out-of-sample validation, so as to promote human mobility analysis with social media data. More specifically, we propose ways of identifying personal activity-specific places and commuting patterns in Beijing, China, based on Weibo (China’s Twitter) check-in records, as well as modifying sample bias of check-in data with population synthesis technique. An independent citywide travel logistic survey is used as the benchmark for validating the results. Obvious differences are discerned from Weibo users’ and survey respondents’ activity-mobility patterns, while there is a large variation of population representativeness between data from the two sources. After bias modification, the similarity coefficient between commuting distance distributions of Weibo data and survey observations increases substantially from 23% to 63%. Synthetic data proves to be a satisfactory cost-effective alternative source of mobility information. The proposed framework can inform many applications related to human mobility, ranging from transportation, through urban planning to transport emission modeling.
|
| Keywords
Social media
Human mobility
Population bias
Sample reconstruction
Data integration
|
|
Corresponding Author(s):
Yi Liu
|
|
Issue Date: 25 September 2018
|
|
| 1 |
Beckman R J, Baggerly K A, Mckay M D (1996). Creating synthetic baseline populations. Transportation Research Part A: Policy and Practice, 30(6): 415–429
https://doi.org/10.1016/0965-8564(96)00004-3
|
| 2 |
Bojic I, Massaro E, Alexander B (2015). Choosing the right home location definition method for the given data set. In: International Conference on Social Informatics. Cham: Springer, 194–208
|
| 3 |
Chen C, Ma J, Susilo Y, Liu Y, Wang M (2016). The promises of big data and small data for travel behavior (aka human mobility) analysis. Transportation Research Part C, Emerging Technologies, 68: 285–299
https://doi.org/10.1016/j.trc.2016.04.005
pmid: 27182125
|
| 4 |
Cho E, Myers S A, Leskovec J (2011). Friendship and mobility: user movement in location-based social networks. In: Proceedings of the 17th ACM SIGKDD International Conference on Knowledge Discovery and Data Mining. New York: ACM, 1082–1090
|
| 5 |
Ghauche A(2010).Integrated transportation and energy activity-based model. Dissertation for the Master Degree. Cambridge: Massachusetts Institute of Technology
|
| 6 |
Haase D, Lautenbach S, Seppelt R (2010). Modeling and simulating residential mobility in a shrinking city using an agent-based approach. Environmental Modelling & Software, 25(10): 1225–1240
https://doi.org/10.1016/j.envsoft.2010.04.009
|
| 7 |
Hasan S, Ukkusuri S V (2014). Urban activity pattern classification using topic models from online geo-location data. Transportation Research Part C: Emerging Technologies, 44: 363–381
https://doi.org/10.1016/j.trc.2014.04.003
|
| 8 |
Hasan S, Ukkusuri S V (2018). Reconstructing activity location sequences from incomplete check-in data: A semi-markov continuous-time Bayesian network model. IEEE Transactions on Intelligent Transportation Systems, 19(3): 687–698
https://doi.org/10.1109/TITS.2017.2700481
|
| 9 |
Hasan S, Zhan X, Ukkusuri S V (2013). Understanding urban human activity and mobility patterns using large-scale location-based data from online social media. In: Proceedings of the 2nd ACM SIGKDD International Workshop on Urban Computing. New York: ACM, 6
|
| 10 |
Hendrix E M T, Ortigosa P M, García I (2002). On the efficiency and effectiveness of controlled random search. In: Stochastic and Global Optimization. Boston: Springer, 129–145
|
| 11 |
Hermes K, Poulsen M (2012). A review of current methods to generate synthetic spatial microdata using reweighting and future directions. Computers, Environment and Urban Systems, 36(4): 281–290
https://doi.org/10.1016/j.compenvurbsys.2012.03.005
|
| 12 |
Hossain N, Hu T, White A M, Luo J, Kautz H (2016). Inferring fine-grained details on user activities and home location from social media: Detecting drinking-while-tweeting patterns in communities. arXiv preprint arXiv, 1603.03181
|
| 13 |
Isaacman S, Becker R, Caceres R, Kobourov S, Martonosi M, Rowland J, Varshavsky A (2011). Identifying important places in people’s lives from cellular network data. In: International Conference on Pervasive Computing. Berlin: Springer, 133–151
|
| 14 |
Kirk H (2013). Microsimulation Model User Guide (flexible modeling framework). Leeds: School of Geography, University of Leeds
|
| 15 |
Lenormand M, Picornell M, Cantú-Ros O G, Tugores A, Louail T, Herranz R, Barthelemy M, Frías-Martínez E, Ramasco J J (2014). Cross-checking different sources of mobility information. PLoS One, 9(8): e105184
https://doi.org/10.1371/journal.pone.0105184
pmid: 25133549
|
| 16 |
Ma J, Heppenstall A, Harland K, Mitchell G (2014). Synthesising carbon emission for mega-cities: A static spatial microsimulation of transport CO2 from urban travel in Beijing. Computers, Environment and Urban Systems, 45: 78–88
https://doi.org/10.1016/j.compenvurbsys.2014.02.006
|
| 17 |
Müller K, Axhausen K W (2010). Population synthesis for microsimulation: State of the art. Arbeitsberichte Verkehrs- und Raumplanung, 638doi: 10.3929/ethz-a-006127782
|
| 18 |
Pontes T, Magno G, Vasconcelos M, Gupta A, Almeida J, Kumaraguru P, et al. (2012). Beware of what you share: Inferring home location in social networks. In: 2012 IEEE 12th International Conference on Data Mining Workshops. Piscataway: IEEE, 571–578
|
| 19 |
Rashidi T H, Abbasi A, Maghrebi M, Hasan S, Waller T S (2017). Exploring the capacity of social media data for modeling travel behavior: Opportunities and challenges. Transportation Research Part C: Emerging Technologies, 75: 197–211
https://doi.org/10.1016/j.trc.2016.12.008
|
| 20 |
Rieser M, Dobler C, Dubernet T, Grether D, Horni A, Lammel G, Waraich, R, Zilske M, Axhausen K W, Nagel K(2014). MATSim User Guide.Zurich: MATSim
|
| 21 |
Subbiah R, Lum K, Marathe A, Marathe M (2013). Activity based energy demand modeling for residential buildings. In: Innovative Smart Grid Technologies (ISGT), 2013 IEEE PES. Piscataway: IEEE, 1–6
|
| 22 |
Toole J L, Colak S, Sturt B, Alexander L P, Evsukoff A, González M C (2015). The path most traveled: travel demand estimation using big data resources. Transportation Research Part C: Emerging Technologies, 58: 162–177
https://doi.org/10.1016/j.trc.2015.04.022
|
| 23 |
Wang Y, Yuan N J, Lian D, Xu L, Xie X,Chen E, Rui Y (2015). Regularity and conformity: location prediction using heterogeneous mobility data. In: Proceedings of the 21th ACM SIGKDD International Conference on Knowledge Discovery and Data Mining. New York: ACM, 1275–1284
|
| 24 |
Wikipedia contributors (2017). Cosine similarity. Available online at (accessed March 7, 2017)
|
| 25 |
Wu L, Zhi Y, Sui Z, Liu Y (2014). Intra-urban human mobility and activity transition: evidence from social media check-in data. PLoS One, 9(5): e97010
https://doi.org/10.1371/journal.pone.0097010
pmid: 24824892
|
| 26 |
Yang F, Jin P J, Cheng Y, Zhang J, Ran B (2015). Origin-destination estimation for non-commuting trips using location-based social networking data. International Journal of Sustainable Transportation, 9(8): 551–564
https://doi.org/10.1080/15568318.2013.826312
|
| 27 |
Yuan N J, Wang Y, Zhang F, Xie X, Sun G (2013). Reconstructing individual mobility from smart card transactions: a space alignment approach. In: ICDM. Piscataway: IEEE, 877–886
|
| 28 |
Zhang F, Yuan N J, Xie X (2012). Data from ‘LifeSpec: Learning the spectrum of urban lifestyles’. Available online at (accessed March 7, 2017)
|
| 29 |
Zhang L, Yang W, Wang J, Rao Q (2013). Large-scale agent-based transport simulation in Shanghai, China. Transportation Research Record: Journal of the Transportation Research Board, 2399(1): 34–43
https://doi.org/10.3141/2399-04
|
| 30 |
Zhou J, Long Y (2014). Jobs-housing balance of bus commuters in Beijing. Transportation Research Record: Journal of the Transportation Research Board, 2418(1): 1–10
https://doi.org/10.3141/2418-01
|
|
Viewed |
|
|
|
Full text
|
|
|
|
|
Abstract
|
|
|
|
|
Cited |
|
|
|
|
| |
Shared |
|
|
|
|
| |
Discussed |
|
|
|
|