Computational investigation on hydrodynamic and sediment transport responses influenced by reclamation projects in the Meizhou Bay, China
Gefei DENG2, Yongming SHEN1,2(), Changping LI3, Jun TANG2
1. Institute of Environmental and Ecological Engineering, Guangdong University of Technology, Guangzhou 510006, China 2. State Key Laboratory of Coastal and Offshore Engineering, Dalian University of Technology, Dalian 116024, China 3. Research Center for Eco-Environmental Engineering, Dongguan University of Technology, Dongguan 523808, China
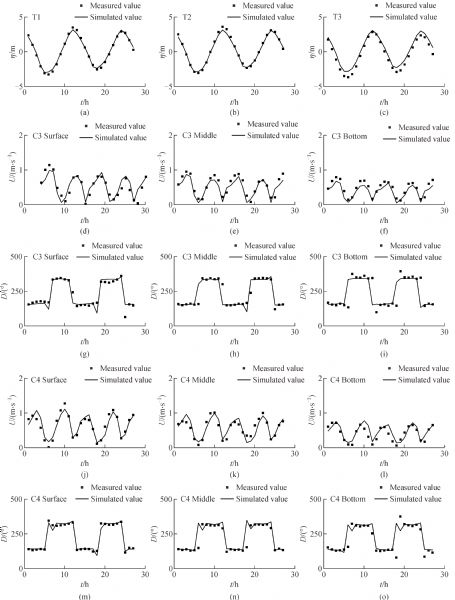
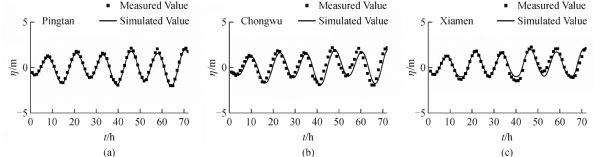
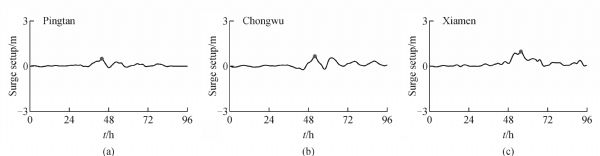
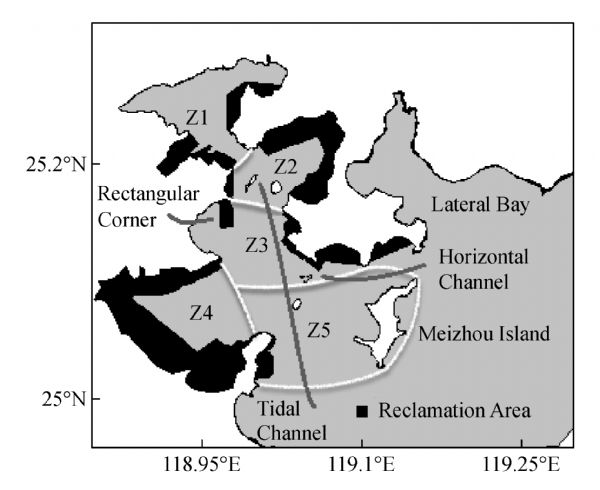
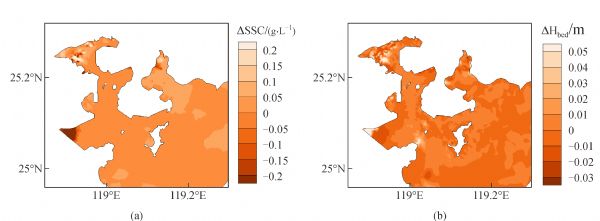
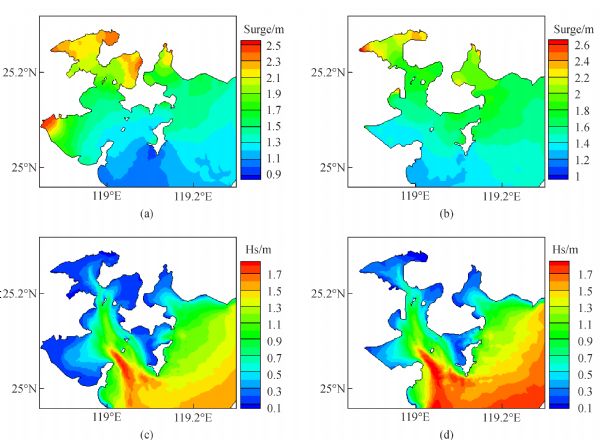
Reclamation projects are the main method of coastal exploitation, and the hydrodynamic environmental effect, together with the sediment transport response of the reclamation project, is important to the project’s site selection and environmental protection. Herein, a 3D numerical model based on the finite volume community ocean model (FVCOM) is applied to simulate the changes in the Meizhou Bay’s hydrodynamic environment and sediment transport after a reclamation project. The reclamation project greatly alters the shape of the shoreline and narrows the bay, leading to a significant change in its hydrodynamic environment and sediment transport. After the project, the clockwise coastal residual current in the corner above the Meizhou Island gradually disappears. An obvious counter-clockwise coastal residual current emerges around the rectangular corner. The tidal prism decreases by 0.65 × 10⁹ and 0.44 × 10⁹ m3 in the spring and neap tides, respectively. The residence time presents a major increase. These changes lead to the weakening of the water exchange capacity and the reduction of the self-purification capacity of the bay. Currents in the tidal channel weaken, whilst currents in the horizontal channel strengthen. The strength and scope of particle trajectories around the horizontal channel and the Meizhou Island enhance. The suspended sediment concentration (SSC) increases in the majority of the Meizhou Bay but decreases in the lateral bay. The eastern corner of Z2 shows a tendency to erode. The western region of the Meizhou Island, the upper portion of the rectangular corner and the western corner of Z4 show a tendency to deposit. The reclamation project increases the maximum storm surges by 0.06 m and decreases the maximum significant wave heights by 0.09 m.
. [J]. Frontiers of Earth Science, 2020, 14(3): 493-511.
Gefei DENG, Yongming SHEN, Changping LI, Jun TANG. Computational investigation on hydrodynamic and sediment transport responses influenced by reclamation projects in the Meizhou Bay, China. Front. Earth Sci., 2020, 14(3): 493-511.
J C Chen (1988). A primary study on sedimental resource in Meizhou Bay. J Fujian Normal U (Natural Science), 4(3): 104–111
2
C Chen, H Liu, R C Beardsley (2003). An unstructured, finite-volume, three-dimensional, primitive equation ocean model: application to coastal ocean and estuaries. J Atmos Ocean Technol, 20(1): 159–186 https://doi.org/10.1175/1520-0426(2003)020<0159:AUGFVT>2.0.CO;2
3
C Chen, H Huang, R C Beardsley, H Liu, Q Xu, G Cowles (2007). A finite volume numerical approach for coastal ocean circulation studies: comparisons with finite difference models. J Geophys Res, 112(C3): C03018 https://doi.org/10.1029/2006JC003485
4
W B Chen, W C Liu, M H Hsu (2012). Computational investigation of typhoon-induced storm surges along the coast of Taiwan. Nat Hazards, 64(2): 1161–1185 https://doi.org/10.1007/s11069-012-0287-1
5
T Fujita (1952). Pressure distribution within typhoon. Geophys Mag, 23(4): 437–451
6
Y K Guo, J S Zhang, L X Zhang, Y M Shen (2009). Computational investigation of typhoon-induced storm surge in Hangzhou Bay, China. Estuar Coast Shelf Sci, 85(4): 530–536 https://doi.org/10.1016/j.ecss.2009.09.021
7
Y K Guo, X G Wu, C H Pan, J S Zhang (2012). Numerical Simulation of the Tidal Flow and Suspended Sediment Transport in the Qiantang Estuary. J Waterw Port Coast Ocean Eng, 138(3): 192–202 https://doi.org/10.1061/(ASCE)WW.1943-5460.0000118
8
X F Guo, C Wang, C H Chen, J J Tang (2014). Numerical simulation of the transport diffusion of suspended matter during the construction of Fengwei reclamation project at Meizhou Bay. J Appl Oceanography, 33(1): 125–132 (in Chinese)
9
K Hasselmann, T P Barnett, E Bouws, H Carlson, D E Cartwright, K Enke, J A Ewing, H Gienapp, D E Hasselmann, P Kruseman, A Meerburg, P Müller, D J Olbers, K Richter, W Sell, H Walden (1973). Measurements of Wind-Wave Growth and Swell Decay during the Joint North Sea Wave Project (JONSWAP). Deutches Hydrographisches Institut
Q Z Hou, L Q Zuo, Y J Lu, Z L Wang, S P Mo, X J She (2017). Hydrodynamic environment response to human interventions in a Macro Tidal Bay: the example of the Quanzhou Bay. J Basic Sci Eng S, 25(6): 1124–1138 (in Chinese)
H Jia, Y M Shen, M R Su, C X Yu (2018). Numerical simulation of hydrodynamic and water quality effects of shoreline changes in Bohai Bay. Front Earth Sci, 12(3): 625–639 https://doi.org/10.1007/s11707-018-0688-x
15
X H Liu, W R Huang (2009). Modeling sediment resuspension and transport induced by storm wind in Apalachicola Bay, USA. Environ Model Softw, 24(11): 1302–1313 https://doi.org/10.1016/j.envsoft.2009.04.006
16
H Liu, W R Pan, Z B Luo, X F Shi (2009). Numerical study on the tidal regime in Meizhou Bay. J Oceanogr Taiwan, 28: 118–122 (in Chinese)
17
Z B Luo, W R Pan, G R Zhang (2007). The sediment properties and transportation rules of the Xiuyu Sea-route in Meizhou Bay. J Xiamen U Natural S, 46(3): 382–385
18
V A Myers (1957). Maximum hurricane winds. Bull Am Meteorol Soc, 38(4): 227–228
19
G L Mellor, T Yamada (1982). Development of a turbulence closure model for geophysical fluid problems. Rev Geophys Space Phys, 20(4): 851–875 https://doi.org/10.1029/RG020i004p00851
20
H E Pelling, J A Mattias Green (2013). Sea level rise and tidal power plants in the Gulf of Maine. J Geophys Res Oceans, 118(6): 2863–2873 https://doi.org/10.1002/jgrc.20221
21
Y M Shen, H Jia, C P Li, J Tang (2018). Numerical simulation of saltwater intrusion and storm surge effects of reclamation in Pearl River Estuary, China. Appl Ocean Res, 79: 101–112 https://doi.org/10.1016/j.apor.2018.07.013
H E Willoughby, M E Rahn (2004). Parametric representation of the primary hurricane vortex. Part I: Observations and evaluation of the Holland (1980) model. Mon Weather Rev, 132(12): 3033–3048 https://doi.org/10.1175/MWR2831.1
24
Y Xu, D W Chen, L Li, P L Li (2015). Numerical modeling of strom surge in Taiwan Strait caused by Typhoon FANAPI. Periodical Ocean U C, 45(2): 008–017 (in Chinese)
25
Z C Zhu, Z J Hu, Y Q Zhang, W Q Chi, J Q Liu, S H Bian, C B Xiong (2014). Numerical simulation and observations of vertical non-uniform of water temperature in the Meizhou Bay influenced by warm water discharge. Adv Marine Sci, 32(2): 230–238 (in Chinese)