A practical multi-lane factor model of bridges based on multi-truck presence considering lane load disparities
Junyong ZHOU1(), Colin C. CAPRANI2
1. School of Civil Engineering, Guangzhou University, Guangzhou 510006, China 2. Department of Civil Engineering, Monash University, Melbourne 3800, Australia
Many bridge design specifications consider multi-lane factors (MLFs) a critical component of the traffic load model. Measured multi-lane traffic data generally exhibit significant lane disparities in traffic loads over multiple lanes. However, these disparities are not considered in current specifications. To address this drawback, a multi-coefficient MLF model was developed based on an improved probabilistic statistical approach that considers the presence of multiple trucks. The proposed MLF model and approach were calibrated and demonstrated through an example site. The model sensitivity analysis demonstrated the significant influence of lane disparity of truck traffic volume and truck weight distribution on the MLF. Using the proposed approach, the experimental site study yielded MLFs comparable with those directly calculated using traffic load effects. The exclusion of overloaded trucks caused the proposed approach, existing design specifications, and conventional approach of ignoring lane load disparity to generate comparable MLFs, while the MLFs based on the proposed approach were the most comprehensive. The inclusion of overloaded trucks caused the conventional approach and design specifications to overestimate the MLFs significantly. Finally, the benefits of the research results to bridge practitioners were discussed.
. [J]. Frontiers of Structural and Civil Engineering, 2021, 15(4): 877-894.
Junyong ZHOU, Colin C. CAPRANI. A practical multi-lane factor model of bridges based on multi-truck presence considering lane load disparities. Front. Struct. Civ. Eng., 2021, 15(4): 877-894.
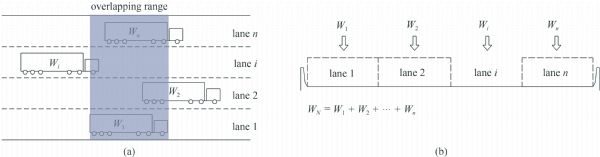
the ratio of average truck weight to maximum truck weight in the multi-truck presence events
the ratio of additional (multi-lane) to reference-lane LEs in multi-truck presence events
the ratio of multi-lane to reference-lane LEs (divided by lane number) in multi-lane traffic simulations
the ratio of multi-lane to reference-lane LEs (divided by lane number) in extreme coincident lane LEs events
MLF form
single coefficient
single coefficient
single coefficient
multiple coefficients
assumptions
① Normal truck weight distribution; ② maximum weight being 3.5 standard deviations above the mean; ③ identical independent lane loads
① Truck weight correlations; ② side-by-side or staggered trucks governing LEs; ③ identical independent lane loads
traffic behavior over multiple lanes
none
application scope
short and medium spans
short and medium spans
long spans
any bridge spans
required skills
statistics of truck loads
① Statistics of truck loads and multi-truck presence probability; ② univariate extreme value extrapolation
① Statistics of truck loads; ② traffic simulation; ③ univariate extreme value extrapolation
① Statistics of truck loads; ② traffic simulation; ③ univariate and multivariate extreme value extrapolation
degree of difficulty in application
*
**
***
****
Tab.1
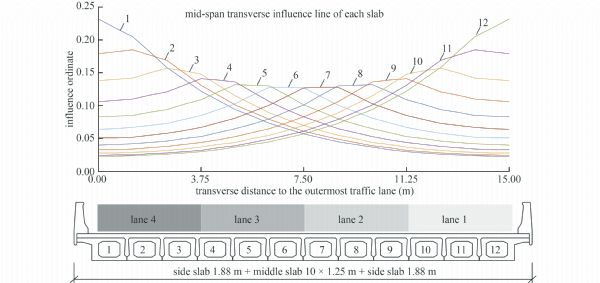
Fig.1
Fig.2
Fig.3
Fig.4
content
lane 1
lane 2
lane 3
lane 4
average daily traffic volume (veh/d/lane)
6736
6699
4414
2303
average daily truck volume (veh/d/lane)
202
1159
2652
1655
average truck weight (t)
5.9
12.0
16.1
20.2
maximum truck weight (t)
26.0
101.8
113.5
108.1
No. of trucks over 55 t
0
728
8745
11112
No. of trucks over 80 t
0
38
624
318
No. of trucks over 100 t
0
2
22
5
Tab.2
Fig.5
Fig.6
No. of loaded lanes
combination
ri
η
MLF
numerical solution
conventional approach
r1
r2
r3
r4
1
1
0.21
–
–
–
1.00
0.20
0.29
1.00
2
–
1.00
–
–
1.00
1.00
1.00
3
–
–
0.97
–
1.00
0.97
1.03
4
–
–
–
0.87
1.00
0.87
0.96
2
1 + 2
0.21
1.00
–
–
0.52
0.31
0.30
0.52
1 + 3
0.21
–
0.97
–
0.59
0.35
0.38
1 + 4
0.21
–
–
0.87
0.61
0.33
0.34
2 + 3
–
1.00
0.97
–
0.57
0.56
0.55
2 + 4
–
1.00
–
0.87
0.58
0.54
0.52
3 + 4
–
–
0.97
0.87
0.64
0.59
0.58
3
1 + 2 + 3
0.21
1.00
0.97
–
0.31
0.22
0.25
0.28
1 + 2 + 4
0.21
1.00
–
0.87
0.33
0.23
0.23
1 + 3 + 4
0.21
–
0.97
0.87
0.40
0.27
0.27
2 + 3 + 4
–
1.00
0.97
0.87
0.39
0.37
0.36
4
1 + 2 + 3 + 4
0.21
1.00
0.97
0.87
0.17
0.13
0.17
0.12
Tab.3
Fig.7
Fig.8
No. of loaded lanes
combination
ri
η
MLF
numerical solution
conventional approach
r1
r2
r3
r4
1
1
0.58
–
–
–
1.00
0.58
0.59
1.00
2
–
1.00
–
–
1.00
1.00
1.00
3
–
–
1.00
–
1.00
1.00
1.04
4
–
–
–
1.00
1.00
1.00
1.06
2
1 + 2
0.58
1.00
–
–
0.77
0.61
0.61
1.00
1 + 3
0.58
–
1.00
–
0.86
0.68
0.71
1 + 4
0.58
–
–
1.00
0.87
0.69
0.68
2 + 3
–
1.00
1.00
–
1.00
1.00
1.02
2 + 4
–
1.00
–
1.00
1.00
1.00
1.02
3 + 4
–
–
1.00
1.00
1.00
1.00
1.04
3
1 + 2 + 3
0.58
1.00
1.00
–
0.49
0.42
0.44
0.88
1 + 2 + 4
0.58
1.00
–
1.00
0.50
0.43
0.46
1 + 3 + 4
0.58
–
1.00
1.00
0.58
0.50
0.46
2 + 3 + 4
–
1.00
1.00
1.00
0.87
0.87
0.84
4
1 + 2 + 3 + 4
0.58
1.00
1.00
1.00
0.36
0.32
0.37
0.32
Tab.4
approaches/design codes
most adverse MLFs of different number of traffic lanes
total LE a)
1
2
3
4
D60-2004
1
1
0.78
0.67
2.68
D60-2015
1.2
1
0.78
0.67
2.68
AASHTO
1.2
1
0.85
0.65
2.6
CSA
1
0.9
0.8
0.7
2.8
conventional approach
with overloaded trucks
1
0.52
0.28
0.13
1.04
without overloaded trucks
1
1
0.88
0.32
2.64
proposed approach
with overloaded trucks
1
0.59
0.37
0.13
1.18
without overloaded trucks
1
1
0.87
0.32
2.61
Tab.5
Fig.9
Fig.10
1
J Y Zhou, X F Shi, C C Caprani, X Ruan. Multi-lane factor for bridge traffic load from extreme events of coincident lane load effects. Structural Safety, 2018, 72 : 17– 29 https://doi.org/10.1016/j.strusafe.2017.12.002
J Y Zhou, T Li, X J Ye, X F Shi. Safety assessment of widened bridges considering uneven multilane traffic-load modeling: Case study in China. Journal of Bridge Engineering, 2020, 25( 9): 05020008– https://doi.org/10.1061/(ASCE)BE.1943-5592.0001610
4
J Y Zhou, C C Caprani, L W Zhang. On the structural safety of long-span bridges under traffic loadings caused by maintenance works. Engineering Structures, 2021, 240 : 112407– https://doi.org/10.1016/j.engstruct.2021.112407
5
H Wu, H Zhao, J Liu, Z Hu. A filtering-based bridge weigh-in-motion system on a continuous multi-girder bridge considering the influence lines of different lanes. Frontiers of Structural and Civil Engineering, 2020, 14( 1): 1– 15 https://doi.org/10.1007/s11709-019-0541-7
6
Algohi B, Bakht B, Khalid H, Mufti A. Design loading for bridges with traffic flowing in multiple lanes in the same direction. In: The 10th International Conference on Short and Medium Span Bridges. Quebec: Curran Associates, Inc., 2018
7
P van der Spuy, R Lenner, T de Wet, C C Caprani. Multiple lane reduction factors based on multiple lane weigh in motion data. Structure (London, England), 2019, 20 : 543– 549
8
J Y Zhou, Z X Chen, J Yi, H Y Ma. Investigation of multi-lane factor models for bridge traffic load effects using multiple lane traffic data. Structure (London, England), 2020, 24 : 444– 455
9
J Y Zhou, C M Hu, Z X Chen, X M Wang, T Wang. Extreme value modeling of coincident lane load effects for multi-lane factors of bridges using peaks-over-threshold method. Advances in Structural Engineering, 2021, 24( 3): 539– 555 https://doi.org/10.1177/1369433220960275
Jaeger L G, Bakht B. Bridges and Transmission Line Structures. New York: ASCE, 1987, 47–59
12
W G Bao, Y H Li, S T Zhang, B Q Zheng, P H Ning. On the reduction coefficients of traffic loading laterally and longitudinally on bridges. China Journal of Highway and Transport, 1995, 8( 1): 80– 86
13
Nowak A S. Calibration of LRFD Bridge Design Code. NCHRP Report 368. 1999
14
M Gindy, H H Nassif. Multiple presence statistics for bridge live load based on weigh-in-motion data. Transportation Research Record: Journal of the Transportation Research Board, 2007, 2028( 1): 125– 135 https://doi.org/10.3141/2028-14
15
on Loads Committee, on Bridges of the Committee on Bridges of the Structural Division Forces. Recommended design loads for bridges. Journal of the Structural Division, 1981, 107( 7): 1161– 1213 https://doi.org/10.1061/JSDEAG.0005727
16
M Prat. Traffic load models for bridge design: Recent developments and research. Progress in Structural Engineering and Materials, 2001, 3( 4): 326– 334 https://doi.org/10.1002/pse.91
17
E J OBrien, B Enright, A Getachew. Importance of the tail in truck weight modeling for bridge assessment. Journal of Bridge Engineering, 2010, 15( 2): 210– 213 https://doi.org/10.1061/(ASCE)BE.1943-5592.0000043
18
G Anitori, J R Casas, M Ghosn. Methodology for development of live load models for refined analysis of short and medium-span highway bridges. Structure and Infrastructure Engineering, 2018, 14( 4): 477– 490 https://doi.org/10.1080/15732479.2017.1406961
19
J Y Zhou, Y Y Liu, J Yi. Effect of uneven multilane truck loading of multigirder bridges on component reliability. Structural Concrete, 2020, 21( 4): 1644– 1661 https://doi.org/10.1002/suco.201900475
20
Kwon O S, Kim E, Orton S, Salim H, Hazlett T. Calibration of the live load factor in LRFD design guidelines. Report No. OR 11–003. 2010
21
C C Caprani. Lifetime highway bridge traffic load effect from a combination of traffic states allowing for dynamic amplification. Journal of Bridge Engineering, 2013, 18( 9): 901– 909 https://doi.org/10.1061/(ASCE)BE.1943-5592.0000427
Ministry of Transport of China. General Code for Design of Highway Bridges and Culverts, JTG D60–2004. Beijing: China Communications Press, 2004 (in Chinese)
24
Ministry of Transport of China. General Code for Design of Highway Bridges and Culverts, JTG D60–2015. Beijing: China Communications Press, 2015 (in Chinese)
25
American Association of State Highway and Transportation Officials. AASHTO LRFD Bridge Design Specifications. 3rd ed. Washington, D.C.: American Association of State Highway and Transportation Officials, 2004
26
CAN/CSA-S6–06. Canadian Highway Bridge Design Code. Toronto: Canadian Standards Association (CSA), 2006