Please wait a minute...
Frontiers of Environmental Science & Engineering

ISSN 2095-2201

ISSN 2095-221X(Online)

CN 10-1013/X

Postal Subscription Code 80-973

2018 Impact Factor: 3.883

Front. Environ. Sci. Eng.    2016, Vol. 10 Issue (5) : 17    https://doi.org/10.1007/s11783-016-0879-1
RESEARCH ARTICLE
Development of source profiles and their application in source apportionment of PM2.5 in Xiamen, China
Ningning Zhang1(),Mazhan Zhuang2,Jie Tian1,Pengshan Tian1,3,Jieru Zhang2,Qiyuan Wang1,Yaqing Zhou1,Rujin Huang1,4,5,Chongshu Zhu1,Xuemin Zhang2,Junji Cao1,6
1. Key Laboratory of Aerosol Chemistry and Physics, Institute of Earth Environment, Chinese Academy of Sciences, Xi’an 710061, China
2. Xiamen Environmental Monitoring Central Station, Xiamen 361012, China
3. IER Environmental Protection Engineering Technique, Co., Ltd., Shenzhen 518055, China
4. Laboratory of Atmospheric Chemistry, Paul Scherrer Institute (PSI), 5232 Villigen, Switzerland
5. Centre for Atmospheric and Environmental Studies, Xiamen Huaxia University, Xiamen 361024, China
6. Institute of Global Environmental Change, Xi’an Jiaotong University, Xi’an 710049, China
 Download: PDF(497 KB)   HTML
 Export: BibTeX | EndNote | Reference Manager | ProCite | RefWorks
Abstract

Seasonal and spatial distribution of PM2.5 and its component were shown.

Local source profiles of major PM2.5 sources were developed.

Source apportionment was conducted using CMB model.

Inorganic secondary components is the biggest contribution at Xiamen.

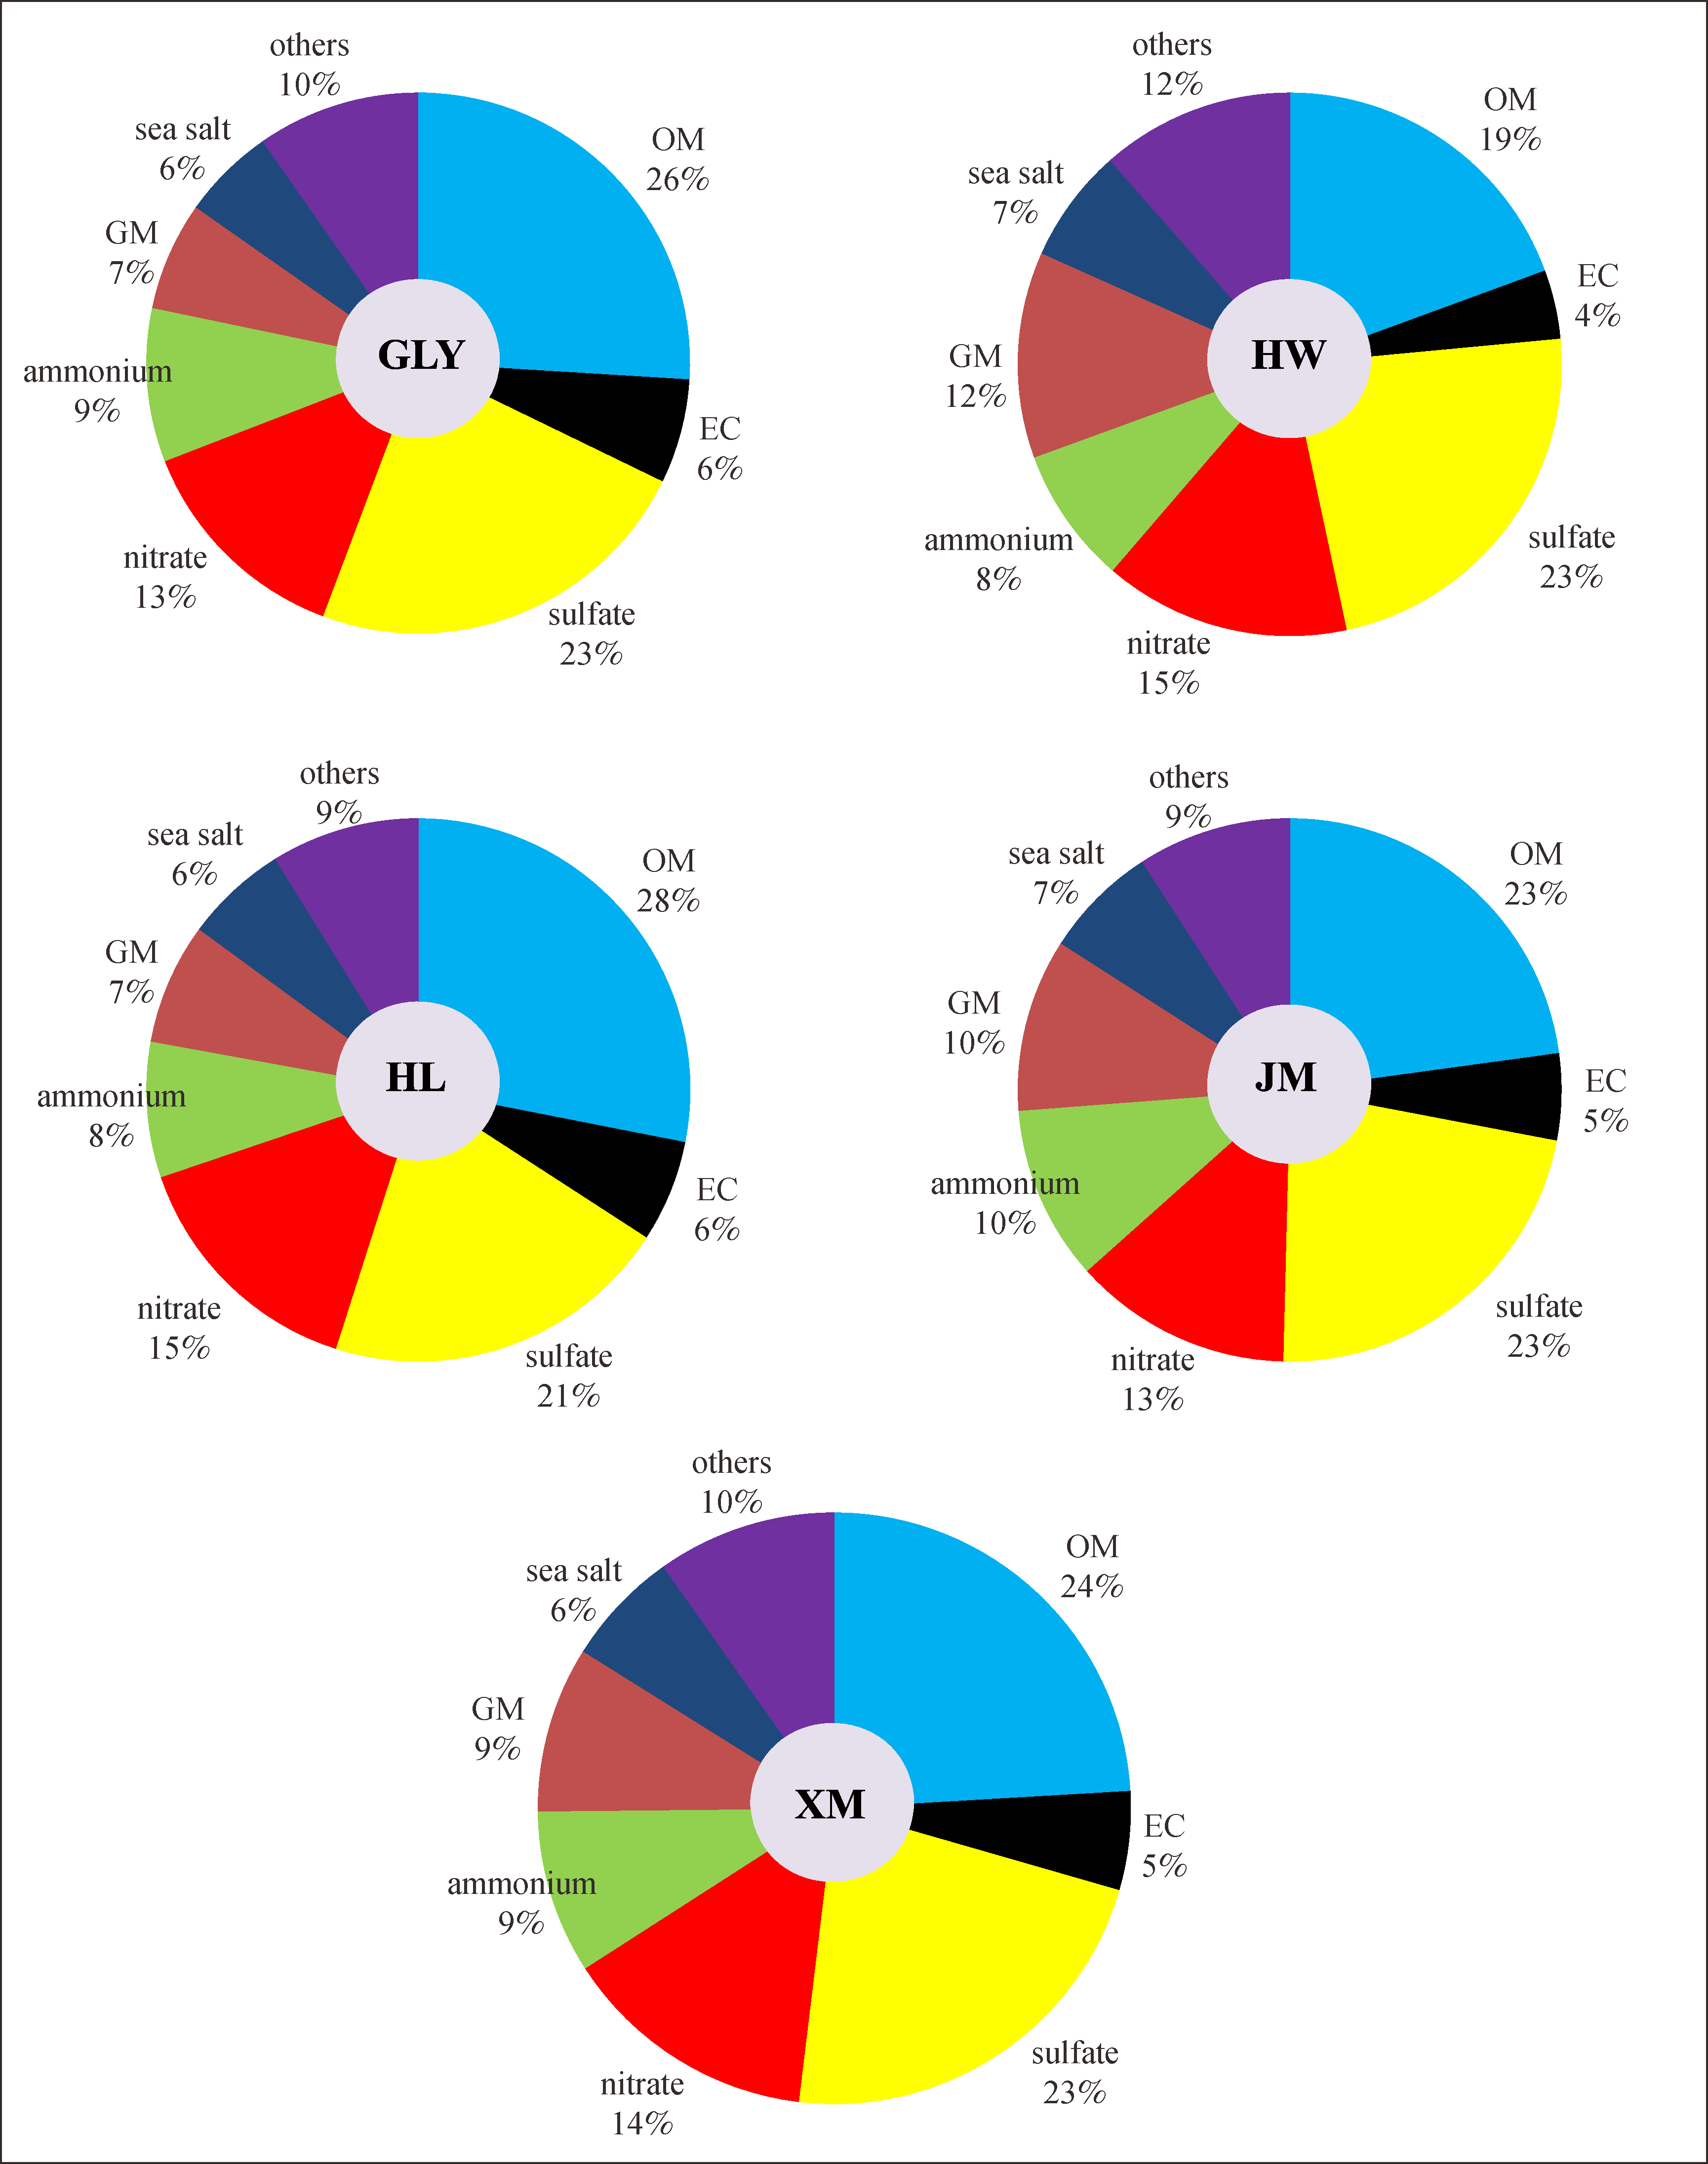
Ambient PM2.5 samples were collected at four sites in Xiamen, including Gulangyu (GLY), Hongwen (HW), Huli (HL) and Jimei (JM) during January, April, July and October 2013. Local source samples were obtained from coal burning power plants, industries, motor vehicles, biomass burning, fugitive dust, and sea salt for the source apportionment studies. The highest value of PM2.5 mass concentration and species related to human activities (SO42–, NO3, Pb, Ni, V, Cu, Cd, organic carbon (OC) and elemental carbon (EC)) were found in the ambient samples from HL, and the highest and lowest loadings of PM2.5 and its components occurred in winter and summer, respectively. The reconstructed mass balance indicated that ambient PM2.5 consisted of 24% OM (organic matter), 23% sulfate, 14% nitrate, 9% ammonium, 9% geological material, 6% sea salt, 5% EC and 10% others. For the source profiles, the dominant components were OC for coal burning, motor vehicle, biomass burning and sea salt; SO42– for industry; and crustal elements for fugitive dust. Source contributions were calculated using a chemical mass balance (CMB) model based on ambient PM2.5 concentrations and the source profiles. GLY was characterized by high contributions from secondary sulfate and cooking, while HL and JM were most strongly affected by motor vehicle emissions, and biomass burning and fugitive dust, respectively. The CMB results indicated that PM2.5 from Xiamen is composed of 27.4% secondary inorganic components, 20.8% motor vehicle emissions, 11.7% fugitive dust, 9.9% sea salt, 9.3% coal burning, 5.0% biomass burning, 3.1% industry and 6.8% others.

Keywords PM2.5      Source profile      Source apportionment      CMB      Xiamen     
PACS:     
Fund: 
Corresponding Author(s): Ningning Zhang,Mazhan Zhuang   
Issue Date: 19 October 2016
 Cite this article:   
Ningning Zhang,Mazhan Zhuang,Jie Tian, et al. Development of source profiles and their application in source apportionment of PM2.5 in Xiamen, China[J]. Front. Environ. Sci. Eng., 2016, 10(5): 17.
 URL:  
https://academic.hep.com.cn/fese/EN/10.1007/s11783-016-0879-1
https://academic.hep.com.cn/fese/EN/Y2016/V10/I5/17
Fig.1  Location of ambient and source sampling sites at Xiamen
sources type sampler group number description
coal burning Songyu power plant model 18, Baldwin Environmental, Inc. USA three groups, each with two 47 mm Quartz filters and one 47 mm Teflon™ filter Songyu power plant belongs to the Xiamen Huaxia International Power Development Co., Ltd. It is located in Haicang, Xiamen. It used subcritical coal-fired generating units, and its total installed capacity is 1200,000 kW.
Houshi power plant model 18, Baldwin Environmental, Inc. USA three groups, each with two 47 mm Quartz filters and one 47 mm Teflon™ filter Houshi power plant is located in Zhanghou, south-west of Xiamen. It is mainly used for thermal power by coal, and its total installed capacity is 4200,000 kW. It used supercritical coal-fired units which is have obvious benefits in terms of energy savings and environmental improvement.
Jinjiang power plant model 18, Baldwin Environmental, Inc. USA three groups, each with two 47 mm Quartz filters and one 47 mm Teflon™ filter Jinjiang Power plants is located in Jinjiang, Quanzhou, north-east of Xiamen. It is mainly used for thermal power by coal, and its total installed capacity is 200,000 kW.
industry Mingda glass plant model 18, Baldwin Environmental, Inc. USA three groups, each with two 47 mm Quartz filters and one 47 mm Teflon™ filter Mingda glass plant has five high-quality float glass production lines and three glass deep processing bases; its main fuel is heavy oil.
vehicle diesel model 18, Baldwin Environmental, Inc. USA three groups, each with two 47 mm Quartz filters and one 47 mm Teflon™ filter bench tests were used for testing the emission profile of diesel vehicles (buses and trucks). Testing was simulated for the conditions of acceleration, climbing, and idling, each of which was tested for 3 min.
gasoline model 18, Baldwin Environmental, Inc. USA three groups, each with two 47 mm Quartz filters and one 47 mm Teflon™ filter bench tests also were used for testing the emission profile sof gasoline vehicles (gasoline powered trucks and cars). Testing was simulated for acceleration, climbing, and idling, each was tested for 3 min.
natural gas model 18, Baldwin Environmental, Inc. U.S.A three groups, each with two 47 mm Quartz filters and one 47 mm Teflon™ filter bench test was used for testing the emission profile of natural gas vehicles (taxis). Testing was simulated for acceleration, climbing, and idling, each was tested for 3 min.
biomass burning straw large cuboid container 1.8 L × 1.8 W × 2.2 H (m) volume ~8 m3 nine groups, each with two 47 mm Quartz filters and one 47 mm Teflon™ filter straw samples were collected at three sites in Xiamen, and each straw sample test was repeated three times. During the test, every group were collected from three parallel channels located downstream of the residence chamber of the dilution sampler; the flow rates were 5 L?min-1 per channel (Ni et al., 2015).
fugitive dust road dust two Mini Vol samplers ten groups, each with one 47 mm Quartz filter and one 47 mm Teflon™ filter road dust was collected at 10 sites, including 5 sites on Xiamen island and 5 sites off the island. Resuspended dust particles were raised by sweeping the paved-roads and immediately sampling with a Mini Vol sampler.
sea salt offshore site, 20 nautical miles south-eastern Xiamen island two Mini Vol samplers and a High Vol sampler, Sampling time>8 h three groups, each with one 47 mm Quartz filter, one 47 mm Teflon™ filter and one A4 Quartz filter samples were collected on a boat about 20 nautical miles away Xiamen island. Electronic power was supplied by diesel generator. To avoid the influences from the generator, the samplers were set on the head of the boat which was always oriented upwind.
Tab.1  Summary of the PM2.5 source sampling of coal burning, industry, motor vehicle, biomass, fugitive dust and sea salt
Fig.2  Chemical composition of PM2.5 at GLY (Gulangyu), HW (Hongwen), HL (Huli) and JM (Jimei) sites
Fig.3  Mass balance of ambient PM2.5 at Xiamen
Jinjiang Songyu Houshi Mingda diesel gasoline natural gas biomass burning fugitive dust sea salt
average SD average SD average SD average SD average SD average SD average SD average SD average SD average SD
OC 44.3770 15.2028 27.1022 6.4803 16.1792 2.2737 6.1657 0.7362 54.4152 6.9922 54.3602 18.7262 35.2620 7.8148 39.9967 4.1139 5.3496 1.3833 31.4801 5.9993
EC 9.1460 1.3995 3.8402 1.1641 2.9594 0.6545 1.0131 0.1653 19.3908 6.2283 6.2881 4.2922 7.3390 2.5331 3.0285 1.2127 0.2660 0.1926 3.8620 1.3433
Na+ 2.2343 1.7760 8.8289 5.4513 1.0972 0.2933 20.6049 1.9423 0.8752 1.1169 3.2590 4.3186 4.7640 6.1173 1.0246 0.6695 0.3823 0.3783 3.2177 0.8770
NH4+ 1.2325 0.4365 1.2289 0.9441 0.3582 0.2527 1.4275 0.7747 0.2799 0.1829 N.D. N.D. N.D. N.D. 0.9732 0.8523 0.0196 0.0335 N.D. N.D.
K+ N.D. N.D. N.D. N.D. N.D. N.D. 0.3838 0.3237 N.D. N.D. N.D. N.D. N.D. N.D. 9.9722 4.5171 0.3550 0.3239 0.4021 0.4794
Mg2+ 0.3193 0.0637 1.2024 0.5984 0.3470 0.1006 0.0436 0.0390 0.1480 0.1492 0.3961 0.2975 0.3022 0.0215 0.0218 0.0293 0.1140 0.0421 N.D. N.D.
Ca2+ 1.1116 5.0848 2.4986 1.1363 3.0814 0.8157 1.1002 0.2787 0.5145 0.2715 2.4782 3.2210 6.3670 1.0846 N.D. N.D. 3.5508 1.4443 3.5378 3.4832
Cl 7.1852 2.2284 12.9768 5.4167 2.3402 0.4432 2.2402 0.3285 1.1734 1.2921 5.4054 6.0583 3.1986 0.4892 17.0959 6.8571 0.1975 0.1276 5.3986 2.3150
NO3 1.8808 1.1805 0.8273 0.5959 0.7564 0.7507 1.0622 0.3434 1.4281 0.7780 1.4739 1.2772 4.8542 3.2221 0.3170 0.1956 0.1086 0.0610 4.7640 1.8793
SO42– 16.9903 10.9941 12.9718 5.4118 14.0376 1.8554 59.2852 7.1773 0.5433 0.4602 N.D. N.D. N.D. N.D. 2.1867 0.2285 0.4438 0.3590 6.2607 5.1564
Al N.D. N.D. 4.9008 1.6750 3.4830 6.0321 0.1151 0.0537 0.0159 0.0276 0.5113 0.6077 0.0000 0.0000 N.D. N.D. 2.7185 1.4694 N.D. N.D.
Si 0.7854 2.1096 2.4015 0.3034 2.8027 1.7676 N.D. 0.0053 0.7385 1.2791 0.0000 0.0000 0.9923 1.4033 N.D. N.D. 4.5315 1.2549 N.D. N.D.
S 1.5492 0.3139 2.6955 0.9926 3.6372 2.0079 15.0819 0.4442 0.0000 0.0000 0.0000 0.0000 0.0000 0.0000 0.1838 0.3675 0.1797 0.1125 9.4488 1.4408
Cl 0.1616 0.1251 13.3945 5.7249 1.2852 0.5817 1.5777 0.6243 0.3360 0.0889 0.0781 0.1105 0.1215 0.1718 19.2887 6.3561 0.0646 0.0845 5.5553 1.3657
K 0.2391 0.3578 0.3296 0.0423 0.3847 0.2156 1.1524 0.0299 0.0432 0.0437 0.0552 0.0269 0.0888 0.0462 15.4796 4.0136 1.1239 0.3644 0.4889 0.0108
Ca 0.6874 0.4059 5.6966 1.8543 9.8282 3.9971 1.5328 0.1393 0.0062 0.0079 0.0238 0.0337 0.0000 0.0000 N.D. N.D. 8.1701 4.8579 N.D. N.D.
Sc 0.0000 0.0000 0.0046 0.0092 0.0000 0.0000 0.0000 0.0000 0.1161 0.0765 0.4822 0.3066 2.1337 2.3664 0.0000 0.0000 0.0005 0.0015 0.0000 0.0000
Ti 0.0998 0.0589 0.3497 0.1091 0.8947 0.6741 0.0010 0.0007 0.0000 0.0000 0.0000 0.0000 0.0000 0.0000 0.0001 0.0002 0.2084 0.0653 0.1142 0.0381
V N.D. N.D. 0.0144 0.0045 0.1102 0.0564 0.1607 0.0030 0.0036 0.0036 0.0235 0.0009 0.0810 0.1146 N.D. N.D. 0.0039 0.0026 0.0368 0.0297
Cr 0.7076 0.0124 0.0364 0.0440 N.D. 0.7558 0.5746 0.0098 0.0001 0.0001 0.0000 0.0000 0.0000 0.0000 N.D. N.D. 0.0046 0.0036 N.D. N.D.
Mn 0.0875 0.0080 0.1052 0.0373 0.0918 0.6174 N.D. N.D. 0.0172 0.0141 0.0454 0.0211 0.1349 0.0956 0.0043 0.0069 0.0691 0.0263 N.D. N.D.
Fe 2.3919 0.0020 4.1725 1.0228 3.7739 2.7364 0.1066 0.0038 0.0206 0.0203 0.5603 0.0606 0.2789 0.2356 0.0001 0.0002 2.7181 1.5708 0.6923 0.6394
Co 0.0046 0.0003 0.0134 0.0053 0.0112 0.0969 N.D. N.D. 0.0997 0.0542 0.2698 0.0109 0.7825 0.4398 0.0009 0.0001 0.0063 0.0040 0.0133 0.0068
Ni 0.1375 0.0009 0.0077 0.0053 N.D. 0.1644 0.0245 0.0002 0.0006 0.0005 0.0060 0.0085 0.0259 0.0207 0.0006 0.0005 0.0014 0.0010 0.0362 0.0281
Cu 0.0115 0.0015 N.D. N.D. 0.0123 0.8128 0.0023 0.0009 0.0032 0.0045 0.0182 0.0083 0.0000 0.0000 0.0020 0.0020 0.0056 0.0046 N.D. N.D.
Zn 0.0392 0.0028 0.0120 0.0064 0.0157 0.7957 0.0183 0.0023 0.0165 0.0147 0.0673 0.0071 0.1608 0.1163 0.0082 0.0045 0.0352 0.0245 0.1846 0.1927
As 0.0299 0.0018 N.D. N.D. N.D. 0.0000 0.0067 0.0025 0.1887 0.2101 0.1226 0.1051 0.5275 0.5713 0.0007 0.0013 0.0005 0.0010 N.D. N.D.
Br 0.0368 0.0008 0.4368 0.0557 0.2624 0.1731 0.0024 0.0012 0.0266 0.0355 0.1136 0.0440 0.0337 0.0476 0.0406 0.0228 0.0005 0.0009 0.0578 0.0745
Rb N.D. N.D. N.D. N.D. N.D. N.D. 0.0100 0.0032 0.0000 0.0000 0.0065 0.0092 0.0000 0.0000 0.0305 0.0262 0.0073 0.0026 N.D. N.D.
Sr 0.0251 0.0012 0.1047 0.0216 0.3332 0.2892 0.0032 0.0020 0.0114 0.0103 0.0194 0.0274 0.2125 0.1576 N.D. N.D. 0.0419 0.0254 0.0297 0.0101
Mo 0.0507 0.0057 0.0191 0.0161 0.0092 0.6517 N.D. N.D. 0.0007 0.0007 0.0021 0.0030 0.0461 0.0493 N.D. N.D. 0.0003 0.0008 N.D. N.D.
Cd N.D. N.D. 0.0544 0.0187 0.0567 1.3278 0.0110 0.0057 0.0009 0.0008 0.0038 0.0053 0.0405 0.0573 0.0128 0.0092 0.0002 0.0020 0.0249 0.0036
Sn 0.0699 0.0272 0.0368 0.0433 0.0702 0.0312 0.0138 0.0096 0.0038 0.0032 0.0388 0.0305 0.0000 0.0000 N.D. N.D. 0.0024 0.0043 N.D. N.D.
Sb 0.0210 0.0145 N.D. N.D. 0.0368 0.0154 0.0280 0.0057 0.0003 0.0006 0.0126 0.0163 0.0405 0.0573 0.0073 0.0002 0.0018 0.0048 0.3276 0.0870
Ba 0.1298 0.0252 0.1908 0.0490 1.4081 0.7832 0.0254 0.0106 0.0352 0.0375 0.1289 0.0737 0.4892 0.4537 0.0001 0.0003 0.0350 0.0151 N.D. N.D.
Pb 0.0091 0.0088 N.D. N.D. N.D. N.D. 0.0652 0.0073 0.0246 0.0232 0.0313 0.0101 0.2001 0.0607 0.0068 0.0025 0.0118 0.0064 0.0501 0.0401
Tab.2  Source profiles composition (% of mass)
Fig.4  Source appointment results of PM2.5 with CMB model at Xiamen
components coal burning industry diesel gasoline natural gas biomass burning fugitive dust sea salt NH4NO3 (NH4)2SO4 cooking
OC 29.22 6.17 54.42 54.36 35.26 40.00 5.35 31.48 0.00 0.00 74.20
EC 5.32 1.01 19.39 6.29 7.34 3.03 0.27 3.86 0.00 0.00 0.99
SO42- 14.67 59.29 0.54 0.00 0.00 2.19 0.44 6.26 0.00 72.73 0.46
NO3- 1.16 1.06 1.43 1.47 4.85 0.32 0.11 4.76 77.50 0.00 0.24
Cl- 7.50 2.24 1.17 5.41 3.20 17.10 0.20 5.40 0.00 0.00 0.64
NH4+ 0.94 1.43 0.28 0.00 0.00 0.97 0.02 0.00 22.50 27.27 0.15
K+ 0.00 0.38 0.00 0.00 0.00 9.97 0.36 0.40 0.00 0.00 0.10
Na+ 4.05 20.60 0.88 3.26 4.76 1.02 0.38 3.22 0.00 0.00 0.47
Mg2+ 0.62 0.04 0.15 0.40 0.30 0.02 0.11 0.00 0.00 0.00 0.01
Ca2+ 2.23 1.10 0.51 2.48 6.37 0.00 3.55 3.54 0.00 0.00 0.01
Al 5.04 0.12 0.02 0.51 0.00 0.00 2.72 0.00 0.00 0.00 0.00
Si 2.00 0.00 0.74 0.00 0.99 0.00 4.53 0.00 0.00 0.00 0.01
Ti 0.45 0.00 0.00 0.00 0.00 0.00 0.21 0.11 0.00 0.00 0.00
V 0.04 0.16 0.00 0.02 0.08 0.00 0.00 0.04 0.00 0.00 0.00
Cr 0.25 0.57 0.00 0.00 0.00 0.00 0.01 0.00 0.00 0.00 0.00
Mn 0.10 0.00. 0.02 0.05 0.14 0.00 0.07 0.00 0.00 0.00 0.00
Fe 3.45 0.11 0.02 0.56 0.28 0.00 2.72 0.69 0.00 0.00 0.02
Ni 0.05 0.02 0.00 0.01 0.03 0.00 0.00 0.04 0.00 0.00 0.00
Cu 0.01 0.00 0.00 0.02 0.00 0.00 0.01 0.00 0.00 0.00 0.00
Zn 0.02 0.02 0.02 0.07 0.16 0.01 0.04 0.19 0.00 0.00 0.01
Br 0.25 0.00 0.03 0.11 0.03 0.04 0.00 0.06 0.00 0.00 0.00
Pb 0.00 0.07 0.02 0.03 0.20 0.01 0.01 0.05 0.00 0.00 0.00
Tab.3  Source profiles input into the CMB model (% of mass)
1 Cao J J, Wang Q Y, Chow J C, Watson J G, Tie X X, Shen Z X, Wang P, An Z S. Impacts of aerosol compositions on visibility impairment in Xi’an, China. Atmospheric Environment, 2012, 59: 559–566
https://doi.org/10.1016/j.atmosenv.2012.05.036
2 Wang Q, Cao J, Tao J, Li N, Su X, Chen L W A, Wang P, Shen Z, Liu S, Dai W. Long-term trends in visibility and at Chengdu, China. PLoS ONE, 2013, 8(7): e68894
https://doi.org/10.1371/journal.pone.0068894 pmid: 23874802
3 Dockery D W, Pope C A3rd, Xu X, Spengler J D, Ware J H, Fay M E, Ferris B GJr, Speizer F E. An association between air pollution and mortality in six U.S. cities. New England Journal of Medicine, 1993, 329(24): 1753–1759
https://doi.org/10.1056/NEJM199312093292401 pmid: 8179653
4 Cao J, Xu H, Xu Q, Chen B, Kan H. Fine particulate matter constituents and cardiopulmonary mortality in a heavily polluted Chinese city. Environmental Health Perspectives, 2012, 120(3): 373–378
https://doi.org/10.1289/ehp.1103671 pmid: 22389181
5 IPCC. Climate Change 2013: The Physical Science Basis. Contribution of Working Group I to the Fifth Assessment Report of the Intergovernmental Panel on Climate Change . Cambridge: Cambridge University Press, 2013
6 Matson P, Lohse K A, Hall S J. The globalization of nitrogen deposition: consequences for terrestrial ecosystems. Ambio, 2002, 31(2): 113–119
https://doi.org/10.1579/0044-7447-31.2.113 pmid: 12077999
7 Cao J J. PM2.5 and the Environment in China. Beijing: Science Press, 2014, 4–5
8 Canonaco F, Crippa M, Slowik J G, Baltensperger U, Prévôt A S H. SoFi, an IGOR-based interface for the efficient use of the generalized multilinear engine (ME-2) for the source apportionment: ME-2 application to aerosol mass spectrometer data. Atmospheric Measurement Techniques, 2013, 6(12): 3649–3661
https://doi.org/10.5194/amt-6-3649-2013
9 Wen W, Cheng S Y, Liu L, Wang G, Wang X Q. Source apportionment of PM2.5 in Tangshan, China—Hybrid approaches for primary and secondary species apportionment. Frontiers of Environmental Science & Engineering, 2016, 10(5): 6
https://doi.org/10.1007/s11783-016-0839-9
10 Guo H, Wang T, Louie P K K. Source apportionment of ambient non-methane hydrocarbons in Hong Kong: application of a principal component analysis/absolute principal component scores (PCA/APCS) receptor model. Environmental Pollution, 2004, 129(3): 489–498
https://doi.org/10.1016/j.envpol.2003.11.006 pmid: 15016469
11 Paatero P, Tapper U. Analysis of different modes of factor analysis as least squares fit Problem. Chemo metries and Intelligent Laboratory Systems, 1993, 18, 183–194
12 Hidy G M, Friedlander S K. The Nature of the Los Angeles Aerosol. In: Proceedings of the Second International Clean Air Congress. New York: Academic Press, 1971, 391–404
13 Henry R C. History and fundamentals of multivariate air quality receptor models. Chemometrics and Intelligent Laboratory Systems, 1997, 37(1): 37–42
https://doi.org/10.1016/S0169-7439(96)00048-2
14 Banerjee T, Murari V, Kumar M, Raju M P. Source apportionment of airborne particulates through receptor modeling: Indian scenario. Atmospheric Research, 2015, 164–165: 167–187
https://doi.org/10.1016/j.atmosres.2015.04.017
15 Samara C, Kouimtzis T, Tsitouridou R, Kanias G, Simeonov V. Chemical mass balance source apportionment of PM10 in an industrialized urban area of Northern Greece. Atmospheric Environment, 2003, 37(1): 41–54
https://doi.org/10.1016/S1352-2310(02)00772-0
16 Yin J X, Harrison R M, Chen Q, Rutter A, Schauer J J. Source apportionment of fine particles at urban background and rural sites in the UK atmosphere. Atmospheric Environment, 2010, 44(6): 841–851
https://doi.org/10.1016/j.atmosenv.2009.11.026
17 Zheng M, Zhang Y J, Yan C Q, Fu H Y, Niu H Y, Huang K, Hu M, Zeng L M, Liu Q Z, Pei B, Fu Q Y. Establishing PM2.5 industrial source profiles in Shanghai. China. Environmental Sciences, 2013, 33(8): 1354–1359(in Chinese)
18 Li T C, Chen W H, Yuan C S, Wu S P, Wang X H. Physicochemical characteristics and source apportionment of atmospheric aerosol particles in Kinmen-Xiamen Airshed. Aerosol and Air Quality Research, 2013, 13: 308–323
19 Zhang F W, Xu L L, Chen J S, Yu Y K, Niu Z C, Yin L Q. Chemical compositions and extinction coefficients of PM2.5 in peri-urban of Xiamen, China, during June 2009–May 2010. Atmospheric Research, 2012, 106: 150–158
https://doi.org/10.1016/j.atmosres.2011.12.005
20 Zhao J P, Zhang F W, Xu Y, Chen J S, Yin L Q, Shang X S, Xu L L. Chemical characteristics of particulate matter during a heavy dust episode in a coastal city, Xiamen. Aerosol and Air Quality Research, 2011, 11: 299–308
21 Zhang X M. Source apportionment of inhalable particulates in air of Xiamen City. Environmental Science & Technology, 2007, 30(11): 51–69
22 Chen Y. Characterization of Cooking Fumes in Hong Kong. Dissertation for the Doctoral Degree. Hong Kong: The Hong Kong Polytechnic University, 2007, 49–60
23 Huang R J, Zhang Y, Bozzetti C, Ho K F, Cao J J, Han Y, Daellenbach K R, Slowik J G, Platt S M, Canonaco F, Zotter P, Wolf R, Pieber S M, Bruns E A, Crippa M, Ciarelli G, Piazzalunga A, Schwikowski M, Abbaszade G, Schnelle-Kreis J, Zimmermann R, An Z, Szidat S, Baltensperger U, El Haddad I, Prévôt A S H. High secondary aerosol contribution to particulate pollution during haze events in China. Nature, 2014, 514(7521): 218–222
pmid: 25231863
24 Zhuang M Z. Research on chemical characteristics of Xiamen fine air particles. Modern Scientific Instruments, 2007, 5: 113–115(in Chinese)
25 Xiao Z M, Bi X H, Feng Y C, Wang Y Q, Zhou J, Fu X Q, Weng Y B. Source apportionment of ambient PM10 and PM2.5 in urban area of Ningbo City. Recearch of Environmental Science, 2012, 25(5): 549–555(in Chinese)
26 Chow J C, Watson J G, Kuhns H, Etyemezian V, Lowenthal D H, Crow D, Kohl S D, Engelbrecht J P, Green M C. Source profiles for industrial, mobile, and area sources in the Big Bend Regional Aerosol Visibility and Observational study. Chemosphere, 2004, 54(2): 185–208
https://doi.org/10.1016/j.chemosphere.2003.07.004 pmid: 14559270
27 Watson J G, Chow J C, Houck J E. PM2.5 chemical source profiles for vehicle exhaust, vegetative burning, geological material, and coal burning in Northwestern Colorado during 1995. Chemsphere, 2001, 43(8): 1141–1151
https://doi.org/10.1016/S0045-6535(00)00171-5 pmid: 11368231
28 Yatkin S, Bayram A. Determination of major natural and anthropogenic source profiles for particulate matter and trace elements in Izmir, Turkey. Chemosphere, 2008, 71(4): 685–696
https://doi.org/10.1016/j.chemosphere.2007.10.070 pmid: 18078978
29 Watson J G, Chow J C, Lowenthal D H, Pritchett L C, Frazier C A, Neuroth G R, Robbins R. Differences in the carbon composition of source profiles for diesel- and gasoline-powered vehicles. Atmospheric Environment, 1994 b, 28(15): 2493–2505
https://doi.org/10.1016/1352-2310(94)90400-6
30 Demirbas A. Potential applications of renewable energy sources biomass combustion problem in boiler power systerm and combustion related environmental issues. Progress in Energy and Combustion Science, 2005, 31(2): 171–192
https://doi.org/10.1016/j.pecs.2005.02.002
31 Ni H Y, Han Y M, Cao J J, Chen A C, Tian J, Wang X L, Chow J C, Watson J G, Wang Q Y, Wang P, Li H, Huang R J. Emission characteristics of carbonaceous particles and trace gases from open burning of crop residues in China. Atomospheric Environment, 2015, 123(B): 399–406
32 Cao J J, Chow J C, Waston J G, Wu F, Han Y M, Jin Z D, Shen Z X, An Z S. Size-differentiated source profiles for fugitive dust in the Chinese Loess Plateau. Atmospheric Environment, 2008, 42(10): 2261–2275
https://doi.org/10.1016/j.atmosenv.2007.12.041
33 Ho K F, Lee S C, Chow J C, Waston J G. Characterization of PM10 and PM2.5 source profiles for fugitive dust in Hong Kong. Atmospheric Environment, 2003, 37(8): 1023–1032
https://doi.org/10.1016/S1352-2310(02)01028-2
34 Zheng M, Salmon L G, Schauer J J, Zeng L M, Kiang C S, Zhang Y H, Cass G R. Seasonal trends in PM2.5 source contributions in Beijing, China. Atmospheric Environment, 2005, 39(22): 3967–3976
https://doi.org/10.1016/j.atmosenv.2005.03.036
35 Yu L D, Wang G F, Zhang R J, Zhang L M, Song Y, Wu B B, Li X F, An K, Chu J H. Characterization and source apportionment of PM2.5 in an urban environment in Beijing. Aerosol and Air Quality Research, 2013, 13: 574–583
[1] Yueqi Jiang, Jia Xing, Shuxiao Wang, Xing Chang, Shuchang Liu, Aijun Shi, Baoxian Liu, Shovan Kumar Sahu. Understand the local and regional contributions on air pollution from the view of human health impacts[J]. Front. Environ. Sci. Eng., 2021, 15(5): 88-.
[2] Aifang Gao, Junyi Wang, Jianfei Luo, Aiguo Li, Kaiyu Chen, Pengfei Wang, Yiyi Wang, Jingyi Li, Jianlin Hu, Hongliang Zhang. Temporal variation of PM2.5-associated health effects in Shijiazhuang, Hebei[J]. Front. Environ. Sci. Eng., 2021, 15(5): 82-.
[3] Caihong Xu, Jianmin Chen, Zhikai Wang, Hui Chen, Hao Feng, Lujun Wang, Yuning Xie, Zhenzhen Wang, Xingnan Ye, Haidong Kan, Zhuohui Zhao, Abdelwahid Mellouki. Diverse bacterial populations of PM2.5 in urban and suburb Shanghai, China[J]. Front. Environ. Sci. Eng., 2021, 15(3): 37-.
[4] Youfang Chen, Yimin Zhou, Xinyi Zhao. PM2.5 over North China based on MODIS AOD and effect of meteorological elements during 2003‒2015[J]. Front. Environ. Sci. Eng., 2020, 14(2): 23-.
[5] Litao Wang, Joshua S. Fu, Wei Wei, Zhe Wei, Chenchen Meng, Simeng Ma, Jiandong Wang. How aerosol direct effects influence the source contributions to PM2.5 concentrations over Southern Hebei, China in severe winter haze episodes[J]. Front. Environ. Sci. Eng., 2018, 12(3): 13-.
[6] Cesunica E. Ivey, Heather A. Holmes, Yongtao Hu, James A. Mulholland, Armistead G. Russell. A method for quantifying bias in modeled concentrations and source impacts for secondary particulate matter[J]. Front. Environ. Sci. Eng., 2016, 10(5): 14-.
[7] Wei WEN,Shuiyuan CHENG,Lei LIU,Gang WANG,Xiaoqi WANG. Source apportionment of PM2.5 in Tangshan, China—Hybrid approaches for primary and secondary species apportionment[J]. Front. Environ. Sci. Eng., 2016, 10(5): 6-.
[8] Jianwu SHI,Xiang DING,Yue ZHOU,Ran YOU,Lu HUANG,Jiming HAO,Feng XIANG,Jian YANG,Ze SHI,Xinyu HAN,Ping NING. Characteristics of chemical components in PM2.5 at a plateau city, South-west China[J]. Front. Environ. Sci. Eng., 2016, 10(5): 4-.
[9] Bing PEI,Hongyang CUI,Huan LIU,Naiqiang YAN. Chemical characteristics of fine particulate matter emitted from commercial cooking[J]. Front. Environ. Sci. Eng., 2016, 10(3): 559-568.
[10] Can DONG, Lingxiao YANG, Chao YAN, Qi YUAN, Yangchun YU, Wenxing WANG. Particle size distributions, PM2.5 concentrations and water-soluble inorganic ions in different public indoor environments: a case study in Jinan, China[J]. Front Envir Sci Eng, 2013, 7(1): 55-65.
[11] Lihui ZHANG, Guomin CAO, Yulei FEI, Hong DING, Mei SHENG, Yongdi LIU. Preliminary study of groundwater denitrification using a composite membrane bioreactor[J]. Front Envir Sci Eng Chin, 2011, 5(4): 604-609.
[12] Bo HAN, Xiaohui BI, Yonghua XUE, Jianhui WU, Tan ZHU, Baogui ZHANG, Jianqing DING, Yuanxin DU. Source apportionment of ambient PM10 in urban areas of Wuxi, China[J]. Front Envir Sci Eng Chin, 2011, 5(4): 552-563.
[13] Liu YANG, Ye WU, Jerry M. DAVIS, Jiming HAO. Estimating the effects of meteorology on PM2.5 reduction during the 2008 Summer Olympic Games in Beijing, China[J]. Front Envir Sci Eng Chin, 2011, 5(3): 331-341.
Viewed
Full text


Abstract

Cited

  Shared   
  Discussed