|
|
|
Factors influencing near infrared spectroscopy analysis of agro-products: a review |
Xiao XU, Lijuan XIE, Yibin YING( ) ) |
| College of Biosystems Engineering and Food Science, Zhejiang University, Hangzhou 310058, China |
|
|
|
|
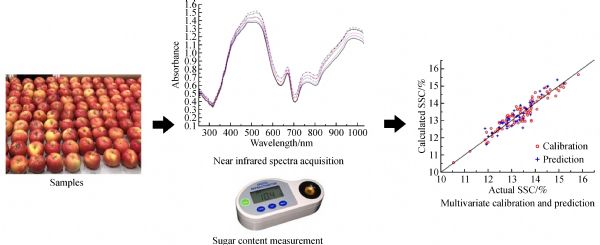
Abstract The near infrared (NIR) spectroscopy technique has wide applications in agriculture with the advantages of being nondestructive, sensitive, safe and rapid. However, there are still more than 40 error sources influencing the robustness and accuracy of its calibration and operation. Environmental, sample and instrument factors that influence the analysis are discussed in this review, including temperature, humidity and other factors that introduce uncertainty. Error sources from livestock products, fruit and vegetables, which are the most common objects in the field of NIR analysis, are also emphasized in the second part. In addition, studies utilizing different instruments, spectral pretreatments, variable selection methods, wavelength ranges, detection modes and calibration methods are tabulated to illustrate the complications they introduce and how they influence NIR analysis. It is suggested that large scale of data with abundant varieties can be used to build a more robust calibration model, in order to improve the robustness and accuracy of the NIR analytical model, and overcome problems caused by confining analysis to too many uniform samples.
|
| Keywords
agro-product
error source
influence factor
near infrared spectroscopy
|
|
Corresponding Author(s):
Yibin YING
|
|
Just Accepted Date: 07 March 2019
Online First Date: 01 April 2019
Issue Date: 22 May 2019
|
|
| 1 |
P CWilliams, D C Sobering. Comparison of commercial near infrared transmittance and reflectance instruments for analysis of whole grains and seeds. Journal of Near Infrared Spectroscopy, 1993, 1(1): 25–32
https://doi.org/10.1255/jnirs.3
|
| 2 |
HSun, Y Peng. A portable nondestructive real-time detection system for inspection of pork quality attributes using Vis/NIR spectral technique. In: SPIE Commercial+Scientific Sensing and Imaging 2016, Maryland. San Francisco: International Society for Optics and Photonics, 2016, 9864
|
| 3 |
JCai, Q Chen, XWan, JZhao. Determination of total volatile basic nitrogen (TVB-N) content and Warner-Bratzler shear force (WBSF) in pork using Fourier transform near infrared (FT-NIR) spectroscopy. Food Chemistry, 2011, 126(3): 1354–1360
https://doi.org/10.1016/j.foodchem.2010.11.098
|
| 4 |
WWang, Y Peng, XZheng, FTian, W Wei. A non-destructive detection system for determination of multi-quality parameters of meat. In: ASABE Annual International Meeting 2016, Orlando. Orlando: American Society of Agricultural and Biological Engineers, 2016, 1
|
| 5 |
MPrevolnik, M Čandek-Potokar, DŠkorjanc, ŠVelikonja-Bolta, MŠkrlep, TZnidaršič, DBabnik. Predicting intramuscular fat content in pork and beef by near infrared spectroscopy. Journal of Near Infrared Spectroscopy, 2005, 13(2): 77–85
https://doi.org/10.1255/jnirs.460
|
| 6 |
DCozzolino, N Barlocco, AVadell, FBallesteros, GGallieta. The use of visible and near-infrared reflectance spectroscopy to predict colour on both intact and homogenised pork muscle. LWT-Food Science and Technology, 2003, 36(2): 195–202
https://doi.org/10.1016/S0023-6438(02)00199-8
|
| 7 |
ZGuo, W Huang, YPeng, QChen, Q Ouyang, JZhao. Color compensation and comparison of shortwave near infrared and long wave near infrared spectroscopy for determination of soluble solids content of ‘Fuji’ apple. Postharvest Biology and Technology, 2016, 2015(115): 81–90
https://doi.org/10.1016/j.postharvbio.2015.12.027
|
| 8 |
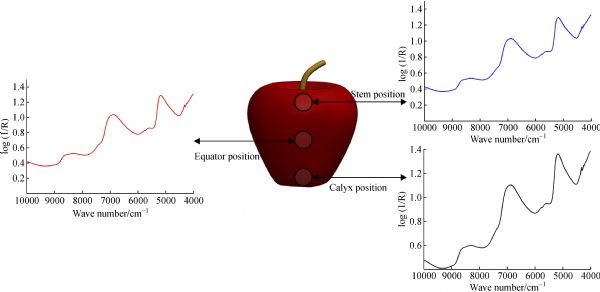
AWang, D Hu, LXie. Comparison of detection modes in terms of the necessity of visible region (VIS) and influence of the peel on soluble solids content (SSC) determination of navel orange using VIS-SWNIR spectroscopy. Journal of Food Engineering, 2013, 2014(126): 126–132
|
| 9 |
JWang, K Nakano, SOhashi, KTakizawa, JHe. Comparison of different modes of visible and near-infrared spectroscopy for detecting internal insect infestation in jujubes. Journal of Food Engineering, 2010, 101(1): 78–84
https://doi.org/10.1016/j.jfoodeng.2010.06.011
|
| 10 |
YShao, Y Bao, YHe. Visible/near-infrared spectra for linear and nonlinear calibrations: a case to predict soluble solids contents and pH value in peach. Food and Bioprocess Technology, 2011, 4(8): 1376–1383
https://doi.org/10.1007/s11947-009-0227-6
|
| 11 |
V AMcGlone, P J Martinsen, C J Clark, R B Jordan. On-line detection of brownheart in Braeburn apples using near infrared transmission measurements. Postharvest Biology and Technology, 2005, 37(2): 142–151
https://doi.org/10.1016/j.postharvbio.2005.04.011
|
| 12 |
STravers, M G Bertelsen, K K Petersen, S V Kucheryavskiy. Predicting pear (cv. Clara Frijs) dry matter and soluble solids content with near infrared spectroscopy. LWT-Food Science and Technology, 2014, 59(2): 1107–1113
https://doi.org/10.1016/j.lwt.2014.04.048
|
| 13 |
B NPeshlov, F E Dowell, F A Drummond, D W Donahue. Comparison of three near infrared spectrophotometers for infestation detection in wild blueberries using multivariate calibration models. Journal of Near Infrared Spectroscopy, 2009, 17(4): 203–212
https://doi.org/10.1255/jnirs.842
|
| 14 |
A M KPedro, M M CFerreira. Nondestructive determination of solids and carotenoids in tomato products by near-infrared spectroscopy and multivariate calibration. Analytical Chemistry, 2005, 77(8): 2505–2511
https://doi.org/10.1021/ac048651r
|
| 15 |
ZSchmilovitch, A Mizrach, AHoffman, HEgozi, YFuchs. Determination of mango physiological indices by near-infrared spectrometry. Postharvest Biology and Technology, 2000, 19(3): 245–252
https://doi.org/10.1016/S0925-5214(00)00102-2
|
| 16 |
MUddin, S Ishizaki, EOkazaki, MTanaka. Near-infrared reflectance spectroscopy for determining end-point temperature of heated fish and shellfish meats. Journal of the Science of Food and Agriculture, 2002, 82(3): 286–292
https://doi.org/10.1002/jsfa.1032
|
| 17 |
FCao, D Wu, YHe. Soluble solids content and pH prediction and varieties discrimination of grapes based on visible-near infrared spectroscopy. Computers and Electronics in Agriculture, 2010, 71(S1): S15–S18
https://doi.org/10.1016/j.compag.2009.05.011
|
| 18 |
APeirs, J Tirry, BVerlinden, PDarius, B MNicolaï. Effect of biological variability on the robustness of NIR models for soluble solids content of apples. Postharvest Biology and Technology, 2003, 28(2): 269–280
https://doi.org/10.1016/S0925-5214(02)00196-5
|
| 19 |
EBobelyn, A S Serban, M Nicu, JLammertyn, B MNicolai, WSaeys. Postharvest quality of apple predicted by NIR-spectroscopy: study of the effect of biological variability on spectra and model performance. Postharvest Biology and Technology, 2010, 55(3): 133–143
https://doi.org/10.1016/j.postharvbio.2009.09.006
|
| 20 |
JGuthrie, B Wedding, KWalsh. Robustness of NIR calibrations for soluble solids in intact melon and pineapple. Journal of Near Infrared Spectroscopy, 1998, 6(1): 259–266
https://doi.org/10.1255/jnirs.145
|
| 21 |
LLeón, A Garrido-Varo, GDowney. Parent and harvest year effects on near-infrared reflectance spectroscopic analysis of olive (Olea europaea L.) fruit traits. Journal of Agricultural and Food Chemistry, 2004, 52(16): 4957–4962
https://doi.org/10.1021/jf0496853
|
| 22 |
H BDing, R J Xu. Near-infrared spectroscopic technique for detection of beef hamburger adulteration. Journal of Agricultural and Food Chemistry, 2000, 48(6): 2193–2198
https://doi.org/10.1021/jf9907182
|
| 23 |
AGracia, L León. Non-destructive assessment of olive fruit ripening by portable near infrared spectroscopy. Grasas y Aceites, 2011, 62(3): 268–274
https://doi.org/10.3989/gya.089610
|
| 24 |
LLeónmoreno. Usefulness of portable near infrared spectroscopy in olive breeding programs. Spanish Journal of Agricultural Research, 2012, 10(1): 141
https://doi.org/10.5424/sjar/2012101-184-11
|
| 25 |
HBessho, K Kudo, JOmori, YInomata, MWada, T Masuda, YNakamoto, HFujisawa, YSuzuki. A portable non-destructive quality meter for understanding fruit soluble solids in apple canopies. Acta Horticulturae, 2007, 2007(732): 593–597
https://doi.org/10.17660/ActaHortic.2007.732.88
|
| 26 |
ABellincontro, A Taticchi, MServili, SEsposto, DFarinelli, FMencarelli. Feasible application of a portable NIR-AOTF tool for on-field prediction of phenolic compounds during the ripening of olives for oil production. Journal of Agricultural and Food Chemistry, 2012, 60(10): 2665–2673
https://doi.org/10.1021/jf203925a
|
| 27 |
SSaranwong, J Sornsrivichai, SKawano. Prediction of ripe-stage eating quality of mango fruit from its harvest quality measured nondestructively by near infrared spectroscopy. Postharvest Biology and Technology, 2004, 31(2): 137–145
https://doi.org/10.1016/j.postharvbio.2003.08.007
|
| 28 |
CCamps, D Christen. Non-destructive assessment of apricot fruit quality by portable visible-near infrared spectroscopy. LWT-Food Science and Technology, 2009, 42(6): 1125–1131
https://doi.org/10.1016/j.lwt.2009.01.015
|
| 29 |
TSun, H Lin, HXu, YYing. Effect of fruit moving speed on predicting soluble solids content of ‘Cuiguan’ pears (Pomaceae pyrifolia Nakai cv. Cuiguan) using PLS and LS-SVM regression. Postharvest Biology and Technology, 2009, 51(1): 86–90
https://doi.org/10.1016/j.postharvbio.2008.06.003
|
| 30 |
YYan, L Zhao, DHan. Analytical basis and application of near infrared spectroscopy. Beijing: China Light Industry Press, 2005 (in Chinese)
|
| 31 |
HMaeda, Y Ozaki, MTanaka, NHayashi, TKojima. Near infrared spectroscopy and chemometrics studies of temperature-dependent spectral variations of water: relationship between spectral changes and hydrogen bonds. Journal of Near Infrared Spectroscopy, 1995, 3(4): 191–202
https://doi.org/10.1255/jnirs.69
|
| 32 |
K BWalsh, J A Guthrie, J W Burney. Application of commercially available, low-cost, miniaturised NIR spectrometers to the assessment of the sugar content of intact fruit. Functional Plant Biology, 2000, 27(12): 1175–1186
https://doi.org/10.1071/PP99111
|
| 33 |
C VGreensill. Non-invasive assessment of fruit quality by near-infrared spectroscopy for fruit grading in an in-line setting. Dissertation for the Doctoral Degree. Australia: Central Queensland University, 2000
|
| 34 |
C JHayes, C V Greensill, K B Walsh. Temporal and environmental sensitivity of a photodiode array spectrophometric system. Journal of Near Infrared Spectroscopy, 2014, 22(4): 297–304
https://doi.org/10.1255/jnirs.1112
|
| 35 |
PMartinsen, V A McGlone, R B Jordan, P Gaastra. Temporal sensitivity of the wavelength calibration of a photodiode array spectrometer. Applied Spectroscopy, 2010, 64(12): 1325–1329
https://doi.org/10.1366/000370210793561727
|
| 36 |
P CWilliams, K H Norris, W S Zarowski. Influence of temperature on estimation of protein and moisture in wheat by near-infrared reflectance. Cereal Chemistry, 1982, 59(6): 473–477
|
| 37 |
YYao, H Chen, LXie, XRao. Assessing the temperature influence on the soluble solids content of watermelon juice as measured by visible and near-infrared spectroscopy and chemometrics. Journal of Food Engineering, 2013, 119(1): 22–27
https://doi.org/10.1016/j.jfoodeng.2013.04.033
|
| 38 |
XZhang, M Chang, LXing, JHu. Influence and correction of temperature on optical measurement for fat and protein contents in a complex food model system. Infrared Physics & Technology, 2010, 53(3): 177–181
https://doi.org/10.1016/j.infrared.2009.11.003
|
| 39 |
APeirs, N Scheerlinck, B MNicolaï. Temperature compensation for near infrared reflectance measurement of apple fruit soluble solids contents. Postharvest Biology and Technology, 2003, 30(3): 233–248
https://doi.org/10.1016/S0925-5214(03)00118-2
|
| 40 |
U KAcharya, K B Walsh, P P Subedi. Robustness of partial least-squares models to change in sample temperature: I. A comparison of methods for sucrose in aqueous solution. Journal of Near Infrared Spectroscopy, 2014, 22(4): 279–286
https://doi.org/10.1255/jnirs.1113
|
| 41 |
U KAcharya, K B Walsh, P P Subedi. Robustness of partial least-squares models to change in sample temperature: II. Application to fruit attributes. Journal of Near Infrared Spectroscopy, 2014, 22(4): 287–295
https://doi.org/10.1255/jnirs.1119
|
| 42 |
FChauchard, J M Roger, V Bellon-Maurel. Correction of the temperature effect on near infrared calibration-application to soluble solid content prediction. Journal of Near Infrared Spectroscopy, 2004, 12(1): 199–205
https://doi.org/10.1255/jnirs.427
|
| 43 |
J MRoger, F Chauchard, VBellon-Maurel. EPO-PLS external parameter orthogonalisation of PLS application to temperature-independent measurement of sugar content of intact fruits. Chemometrics and Intelligent Laboratory Systems, 2003, 66(2): 191–204
https://doi.org/10.1016/S0169-7439(03)00051-0
|
| 44 |
LDe Benedictis, CHuck. New approach to optimize near-infrared spectra with design of experiments and determination of milk compounds as influence factors for changing milk over time. Food Chemistry, 2016, 212: 552–560
https://doi.org/10.1016/j.foodchem.2016.06.012
|
| 45 |
YZhou, X P Fu, Y B Ying. Effect of humidity on detection of near-infrared spectra. Spectroscopy and Spectral Analysis, 2007, 27(11): 2197–2199
|
| 46 |
R JHill, S F Clifford, R S Lawrence. Refractive-index and absorption fluctuations in the infrared caused by temperature, humidity, and pressure fluctuations. Journal of Science and Arts, 1980, 70(10): 1192–1205
https://doi.org/10.1364/JOSA.70.001192
|
| 47 |
DCozzolino, I Murray. Effect of sample presentation and animal muscle species on the analysis of meat by near infrared reflectance spectroscopy. Journal of Near Infrared Spectroscopy, 2002, 10(1): 37–44
https://doi.org/10.1255/jnirs.319
|
| 48 |
R MMcdevitt, A J Gavin, S Andrés, IMurray. The ability of visible and near infrared reflectance spectroscopy to predict the chemical composition of ground chicken carcasses and to discriminate between carcasses from different genotypes. Hispania, 2005, 13(3): 109–117
|
| 49 |
K MNunes, M V Andrade, A M Santos Filho, M C Lasmar, M M Sena. Detection and characterisation of frauds in bovine meat in natura by non-meat ingredient additions using data fusion of chemical parameters and ATR-FTIR spectroscopy. Food Chemistry, 2016, 205: 14–22
https://doi.org/10.1016/j.foodchem.2016.02.158
|
| 50 |
A AArgyri, E Z Panagou, P A Tarantilis, M Polysiou, G J ENychas. Rapid qualitative and quantitative detection of beef fillets spoilage based on Fourier transform infrared spectroscopy data and artificial neural networks. Sensors and Actuators B: Chemical, 2010, 145(1): 146–154
https://doi.org/10.1016/j.snb.2009.11.052
|
| 51 |
QChen, J Cai, XWan, JZhao. Application of linear/non-linear classification algorithms in discrimination of pork storage time using Fourier transform near infrared (FT-NIR) spectroscopy. LWT- Food Science and Technology, 2011, 44(10): 2053–2058
https://doi.org/10.1016/j.lwt.2011.05.015
|
| 52 |
SBureau, D Ruiz, MReich, BGouble, DBertrand, J MAudergon, C M G CRenard. Rapid and non-destructive analysis of apricot fruit quality using FT-near-infrared spectroscopy. Food Chemistry, 2009, 113(4): 1323–1328
https://doi.org/10.1016/j.foodchem.2008.08.066
|
| 53 |
PMartinsen, P Schaare. Measuring soluble solids distribution in kiwifruit using near-infrared imaging spectroscopy. Postharvest Biology and Technology, 1998, 14(3): 271–281
https://doi.org/10.1016/S0925-5214(98)00051-9
|
| 54 |
D CSlaughter, DBarrett, MBoersig. Nondestructive determination of soluble solids in tomatoes using near infrared spectroscopy. Journal of Food Science, 1996, 61(4): 695–697
https://doi.org/10.1111/j.1365-2621.1996.tb12183.x
|
| 55 |
SFan, B Zhang, JLi, WHuang, CWang. Effect of spectrum measurement position variation on the robustness of NIR spectroscopy models for soluble solids content of apple. Biosystems Engineering, 2016, 143(3): 9–19
https://doi.org/10.1016/j.biosystemseng.2015.12.012
|
| 56 |
GRipoll, P Albertí, BPanea, J LOlleta, CSanudo. Near-infrared reflectance spectroscopy for predicting chemical, instrumental and sensory quality of beef. Meat Science, 2008, 80(3): 697–702
https://doi.org/10.1016/j.meatsci.2008.03.009
|
| 57 |
L JZhou, H Wu, J TLi, Z YWang, L YZhang. Determination of fatty acids in broiler breast meat by near-infrared reflectance spectroscopy. Meat Science, 2012, 90(3): 658–664
https://doi.org/10.1016/j.meatsci.2011.10.010
|
| 58 |
M MDe, R Riovanto, MPenasa, MCassandro. At-line prediction of fatty acid profile in chicken breast using near infrared reflectance spectroscopy. Meat Science, 2012, 90(3): 653–657
https://doi.org/10.1016/j.meatsci.2011.10.009
|
| 59 |
LXie, A Wang, HXu, YYing. Applications of near-infrared systems for quality evaluation of fruits: a review. Transactions of the ASABE, 2016, 59(2): 399–419
https://doi.org/10.13031/trans.59.10655
|
| 60 |
X LChu, H F Yuan, W Z Lu. Progress and application of spectral data pretreatment and wavelength selection methods in NIR analytical technique. Progress in Chemistry, 2004, 16(4): 528– 542
|
| 61 |
V MFernández-Cabanás, AGarrido-Varo, J GOlmo, E DPedro, PDardenne. Optimisation of the spectral pre-treatments used for Iberian pig fat NIR calibrations. Chemometrics and Intelligent Laboratory Systems, 2007, 87(1): 104–112
https://doi.org/10.1016/j.chemolab.2006.10.005
|
|
Viewed |
|
|
|
Full text
|
|
|
|
|
Abstract
|
|
|
|
|
Cited |
|
|
|
|
| |
Shared |
|
|
|
|
| |
Discussed |
|
|
|
|