| ENGINEERING MANAGEMENT REPORTS |
|
|
|
Spatial and Temporal Distribution of PM2.5 Pollution and Control Strategy in the Chang-Zhu-Tan City Cluster |
Xiao-hong Chen1( ),Xiang-bo Tang2 ),Xiang-bo Tang2 |
1. Collaborative Innovation Center of Resource-conserving & Environment-friendly Society and Ecological Civilization, Business School, Central South University, Changsha 410083, China; Institute of Big Data and Internet Innovation, Hunan University of Commerce, Changsha 410205, China
2. Collaborative Innovation Center of Resource-conserving & Environment-friendly Society and Ecological Civilization, Central South University, Changsha 410083, China |
|
|
|
|
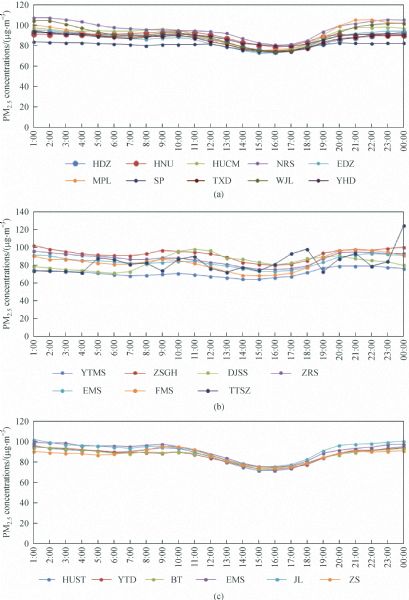
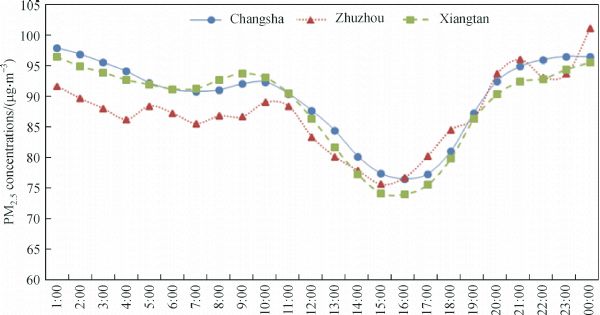
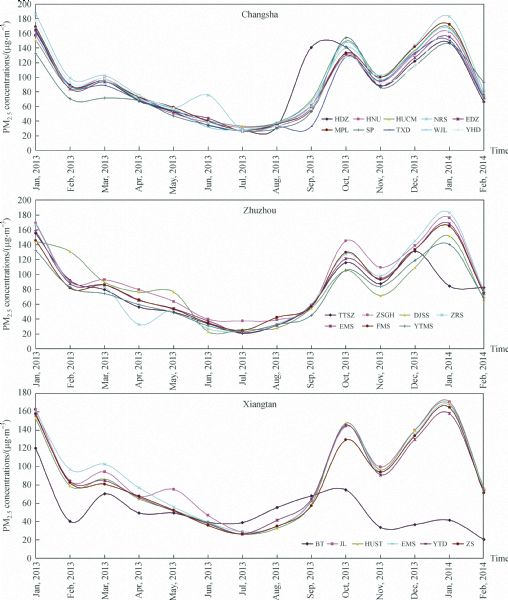
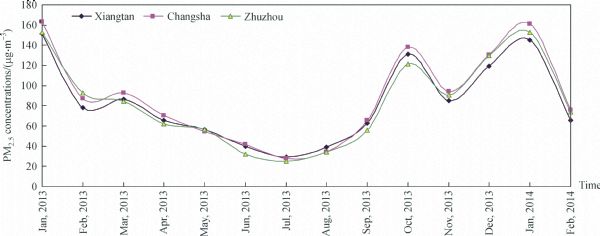
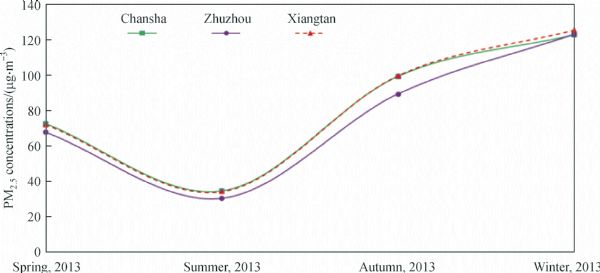
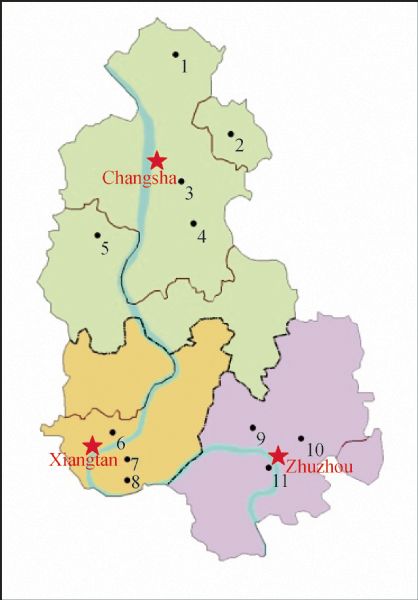
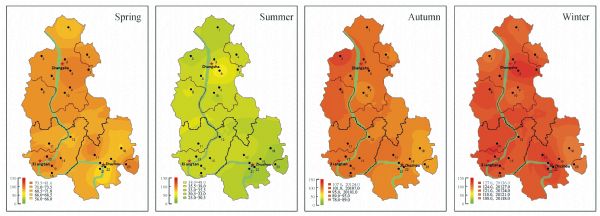
Abstract Utilizing the initial hourly monitoring data of PM2.5 concentrations at 23 monitoring sites across the Chang-Zhu-Tan city cluster between January 2013 and February 2014 that released in Real-time Air Quality Reporting System in Hunan Province, this paper draws diagrams and analyzes the change rule of the pollutants concentration over time. In addition, this paper studies the regional distribution of PM2.5 seasonal pollution in the vicinity of the monitoring sites using ArcGIS geographic information system with the Kriging interpolation method. On this basis, this paper puts forward some effective control strategies to cope with regional PM2.5 pollution combined with the information of industry distribution and development status in the Chang-Zhu-Tan city cluster.
|
| Keywords
PM2.5
spatial and temporal distribution
ArcGIS
the chang-Zhu-Tan city cluster
|
|
Corresponding Author(s):
Xiao-hong Chen
|
|
Online First Date: 21 June 2016
Issue Date: 22 September 2016
|
|
| 1 |
Chan, L., & Kwok, W. (2000). Vertical dispersion of suspended particulates in urban area of Hong Kong. Atmospheric Environment, 34, 4403–4412.
https://doi.org/10.1016/S1352-2310(00)00181-3
|
| 2 |
Feng, J., Li, M, Zhang, P., Gong, S., Zhong, M., Wu , M., .(2013). Investigation of the sources and seasonal variations of secondary organic aerosols in PM2.5 in Shanghai with organic tracers. Atmospheric Environment, 79, 614–622.
https://doi.org/10.1016/j.atmosenv.2013.07.022
|
| 3 |
He, K., Yang, F., Ma, Y., Zhang, Q., Yao, X., & Chan, C. (2001). The characteristics of PM2.5 in Beijing, China. Atmospheric Environment, 35(29), 4959–4970.
|
| 4 |
Hong, S., Jiao, L., & Ma, W. (2013). Variation of PM2.5 concentration in Hangzhou, China. Particuology, 11, 55–62.
https://doi.org/10.1016/j.partic.2012.04.008
|
| 5 |
Huang, K., Zhuang, G., Li, J., Wang, Q., Sun, Y., Lin, Y., (2010). Mixing Asian dust with pollution aerosol and the transformation of aerosol components during the dust storm over China in spring 2007. Journal of Geophys Res Atmos, 115(D7), 1307–1314.
https://doi.org/10.1016/j.atmosres.2010.03.013
|
| 6 |
Huang, W., Cao, J., Tao, Y., Dai, L., Lu, S.E., Hou, B., (2012). Seasonal variation of chemical species associated with short-term mortality effects of PM(2.5) in Xi’an, a Central City in China. American Journal of Epidemiology, 175, 556–566..
https://doi.org/10.1093/aje/kwr342
pmid: 22323403
|
| 7 |
Man, Y., Wang, Y., Lin, N., & Hong, Y. (2010). Analysis of inhalable particulate matter PM10 and PM2.5 pollution levels in grouped cities of central Liaoning Province. China Powder Science and Technology, 16, 9–13.
|
| 8 |
Pu, W., Zhao, X., Zhang, X., & Ma, Z. (2011). Effect of meteorological factors on PM2.5 during July to September of Beijing. Procedia Earth and Planetary Science, 2, 272–277.
https://doi.org/10.1016/j.proeps.2011.09.043
|
| 9 |
Yin, Y.Q., Shan, W.P., Ji, X., You, L.N., Su, Y.C. (2006). Characteristics of atmospheric ozone in the urban area of Ji’nan. Environmental Sciences, 27, 2299–2302..
pmid: 17326444
|
|
Viewed |
|
|
|
Full text
|
|
|
|
|
Abstract
|
|
|
|
|
Cited |
|
|
|
|
| |
Shared |
|
|
|
|
| |
Discussed |
|
|
|
|