|
|
|
A Bayesian method for comprehensive water quality evaluation of the Danjiangkou Reservoir water source area, for the middle route of the South-to-North Water Diversion Project in China |
Fangbing MA1,2,3,Chunhui LI1,Xuan WANG1,2,*( ),Zhifeng YANG1,2,Chengchun SUN2,Peiyu LIANG1,2 ),Zhifeng YANG1,2,Chengchun SUN2,Peiyu LIANG1,2 |
1. Key Laboratory for Water and Sediment Sciences of Ministry of Education, School of Environment, Beijing Normal University, Beijing 100875, China
2. State Key Laboratory for Water Environment Simulation, School of Environment, Beijing Normal University, Beijing 100875, China
3. Shidu Town People’s Government, Beijing 102411, China |
|
|
|
|
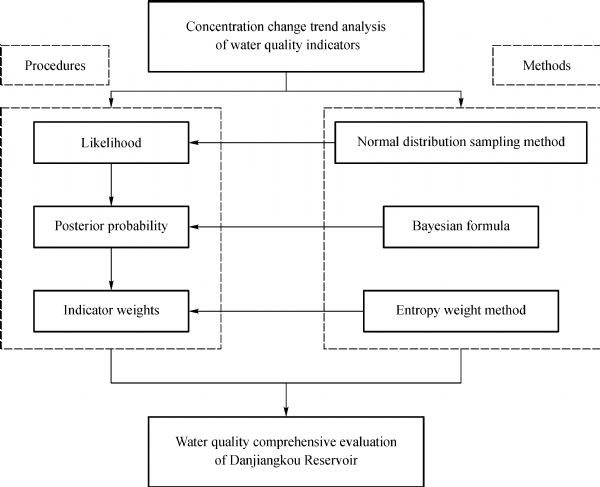
Abstract The Danjiangkou Reservoir is the water source for the middle route of the South-to-North Water Diversion Project in China. Thus, its water quality status is of great concern. Five water quality indicators (dissolved oxygen, permanganate index, ammonia nitrogen, total nitrogen, and total phosphorus), were measured at three monitoring sites (the Danjiangkou Reservoir dam, the Hejiawan and the Jiangbei bridge), to investigate changing trends, and spatiotemporal characteristics of water quality in the Danjiangkou Reservoir area from January 2006 to May 2012. We then applied a Bayesian statistical method to evaluate the water quality comprehensively. The normal distribution sampling method was used to calculate likelihood, and the entropy weight method was used to determine indicator weights for variables of interest in to the study. The results indicated that concentrations of all five indicators increased during the last six years. In addition, the water quality in the reservoir was worse during the wet season (from May to October), than during the dry season (from November to April of the next year). Overall, the probability of the water’s belonging to quality category of type Ⅱ, according to environmental quality standards for surface water in China, was 27.7%–33.7%, larger than that of its belonging to the other four water quality types. The increasing concentrations of nutrients could result in eutrophication of the Danjiangkou Reservoir. This method reduced the subjectivity that is commonly associated with determining indicator weights and artificial classifications, achieving more reliable results. These results indicate that it is important for the interbasin water diversion project to implement integrated water quality management in the Danjiangkou Reservoir area.
|
| Keywords
water quality evaluation
Danjiangkou Reservoir
Bayesian method
normal distribution sampling method
entropy weight method
|
|
Corresponding Author(s):
Xuan WANG
|
|
Issue Date: 24 June 2014
|
|
| 1 |
ChaY K, StowC A, ReckhowK H, DeMarchiC, JohengenT H (2010). Phosphorus load estimation in the Saginaw River, MI using a Bayesian hierarchical/multilevel model. Water Res, 44(10): 3270-3282
doi: 10.1016/j.watres.2010.03.008 pmid: 20382406
|
| 2 |
ChenS Z, WangX J, ZhaoX J (2008). An attribute recognition model based on entropy weight for evaluating the quality of groundwater sources. Journal of China University of Mining and Technology, 18(1): 72-75
doi: 10.1016/S1006-1266(08)60016-4
|
| 3 |
ChibS (1996). Calculating posterior distributions and modal estimates in Markov mixture models. J Econom, 75(1): 79-97
doi: 10.1016/0304-4076(95)01770-4
|
| 4 |
DebelsP, FigueroaR, UrrutiaR, BarraR, NiellX (2005). Evaluation of water quality in the Chillán River (Central Chile) using physicochemical parameters and a modified water quality index. Environ Monit Assess, 110(1-3): 301-322
doi: 10.1007/s10661-005-8064-1 pmid: 16308794
|
| 5 |
IpW C, HuB Q, WongH, XiaJ (2009). Applications of grey relational method to river environment quality evaluation in China. J Hydrol (Amst), 379(3-4): 284-290
doi: 10.1016/j.jhydrol.2009.10.013
|
| 6 |
JensenF V (1996). An Introduction to Bayesian Networks (Vol. 210). London: UCL press
|
| 7 |
JiangB Q, WangW S, WenX C (2007). An improved BP neural networks model on water quality evaluation. Computer Systems Applications, 9: 46-50
|
| 8 |
JinJ L, HuangH M, WeiY M (2004). Comprehensive evaluation model for water quality based on combined weights. Journal of Hydroelectric Engineering, 23(3): 13-19
|
| 9 |
JunK S, ChungE S, SungJ Y, LeeK S (2011). Development of spatial water resources vulnerability index considering climate change impacts. Sci Total Environ, 409(24): 5228-5242
doi: 10.1016/j.scitotenv.2011.08.027 pmid: 21940039
|
| 10 |
LiS Y, ChengX L, XuZ F, HanH Y, ZhangQ F(2009a). Spatial and temporal patterns of the water quality in the Danjiangkou Reservoir, China. Hydrol Sci J, 54(1): 124-134
doi: 10.1623/hysj.54.1.124
|
| 11 |
LiS Y, GuS, LiuW Z, HanH Y, ZhangQ F (2008). Water quality in relation to the land use and land cover in the Upper Han River basin, China. Catena, 75(2): 216-222
doi: 10.1016/j.catena.2008.06.005
|
| 12 |
LiS Y, LiuW Z, GuS, ChengX L, XuZ F, ZhangQ F (2009b). Spatio-temporal dynamics of nutrients in the upper Han River basin, China. J Hazard Mater, 162(2-3): 1340-1346
doi: 10.1016/j.jhazmat.2008.06.059 pmid: 18675508
|
| 13 |
LiaoJ, WangJ Y, DingJ (2009). Water quality assessment of main rivers in Sichuan based on improved Bayes model. Journal of Sichuan Normal University (Natural Science), 32(4): 518-521
|
| 14 |
LiuL, ZhouJ Z, AnX L, ZhangY C, YangL (2010). Using fuzzy theory and information entropy for water quality assessment in Three Gorges region, China. Expert Syst Appl, 37(3): 2517-2521
doi: 10.1016/j.eswa.2009.08.004
|
| 15 |
NiS H, BaiY H (2000). Application of BP neural network model in groundwater quality evaluation. Systems Engineering Theory and Practice, 20(8): 124-127
|
| 16 |
ParinetB, LhoteA, LegubeB (2004). Principal component analysis: an appropriate tool for water quality evaluation and management-application to a tropical lake system. Ecol Modell, 178(3-4): 295-311
doi: 10.1016/j.ecolmodel.2004.03.007
|
| 17 |
QianS S, ReckhowK H (2007). Combining model results and monitoring data for water quality assessment. Environ Sci Technol, 41(14): 5008-5013
doi: 10.1021/es062420f pmid: 17711216
|
| 18 |
QianS S, SchulmanA, KoplosJ, KotrosA, KellarP (2004). A hierarchical modeling approach for estimating national distributions of chemicals in public drinking water systems. Environ Sci Technol, 38(4): 1176-1182
doi: 10.1021/es020686q pmid: 14998034
|
| 19 |
SchoenM E, SmallM J, VanbriesenJ M (2010). Bayesian model for flow-class dependent distributions of fecal-indicator bacterial concentration in surface waters. Water Res, 44(3): 1006-1016
doi: 10.1016/j.watres.2009.10.016 pmid: 19931885
|
| 20 |
UnnikrishnanN K (2010). Bayesian analysis for outliers in survey sampling. Comput Stat Data Anal, 54(8): 1962-1974
doi: 10.1016/j.csda.2010.02.021
|
| 21 |
WuH Y, ChenK L, ChenZ H, ChenQ H, QiuY P, WuJ C, ZhangJ F (2012). Evaluation for the ecological quality status of coastal waters in East China Sea using fuzzy integrated assessment method. Mar Pollut Bull, 64(3): 546-555
doi: 10.1016/j.marpolbul.2011.12.022 pmid: 22245438
|
| 22 |
WuR, QianS S, HaoF H, ChengH G, ZhuD S, ZhangJ Y (2011). Modeling contaminant concentration distributions in China’s centralized source waters. Environ Sci Technol, 45(14): 6041-6048
doi: 10.1021/es1038563 pmid: 21692445
|
| 23 |
XingS L, ZhangZ F, TianR, YangL P (2011). Evaluation of underground water quality in QingShuihe District, Inner Mongolia Autonomous Region. Procedia Environmental Sciences, 11(Part C): 1434-1440
doi: 10.1016/j.proenv.2011.12.215
|
| 24 |
YinK H, YuanH R, RuanY, LiZ Y (2001). Variation and correlation of environmental parameters in the water of Danjiangkou Reservoir. Resources and Environment in the Yangtze Basin, 10(1): 81-87
|
| 25 |
ZhangQ F, XuZ F, ShenZ H, LiS Y, WangS S (2009). The Han River watershed management initiative for the South-to-North Water Transfer project (Middle Route) of China. Environ Monit Assess, 148(1-4): 369-377
doi: 10.1007/s10661-008-0167-z pmid: 18306047
|
| 26 |
ZhaoY, NanJ, CuiF Y, GuoL (2007). Water quality forecast through application of BP neural network at Yuqiao reservoir. Journal of Zhejiang University SCIENCE A, 8(9): 1482-1487
doi: 10.1631/jzus.2007.A1482
|
| 27 |
ZouZ H, YunY, SunJ N (2006). Entropy method for determination of weight of evaluating indicators in fuzzy synthetic evaluation for water quality assessment. J Environ Sci (China), 18(5): 1020-1023
doi: 10.1016/S1001-0742(06)60032-6 pmid: 17278765
|
|
Viewed |
|
|
|
Full text
|
|
|
|
|
Abstract
|
|
|
|
|
Cited |
|
|
|
|
| |
Shared |
|
|
|
|
| |
Discussed |
|
|
|
|