|
|
|
Multiple-scale temporal variations and fluxes near a hydrothermal vent over the Southwest Indian Ridge |
Xiaodan CHEN1,Chujin LIANG1,*( ),Changming DONG2,3,Beifeng ZHOU1,Guanghong LIAO1,Junde LI1 ),Changming DONG2,3,Beifeng ZHOU1,Guanghong LIAO1,Junde LI1 |
1. State Key Lab of Satellite Ocean Environment Dynamics, Second Institute of Oceanography, Hangzhou 310012, China
2. School of Marine Sciences, Nanjing University of Information Science and Technology, Nanjing 210044, China
3. Department of Atmospheric and Oceanic Sciences, University of California, Los Angeles, CA 90001, USA |
|
|
|
|
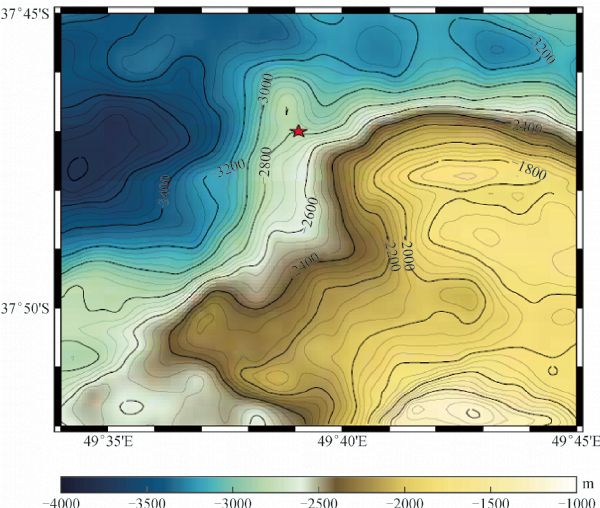
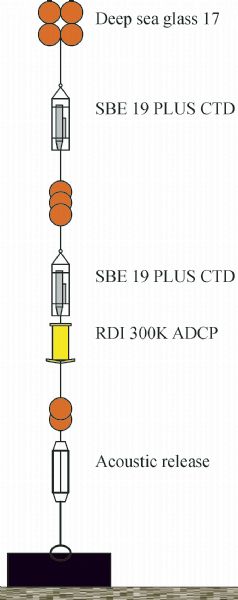
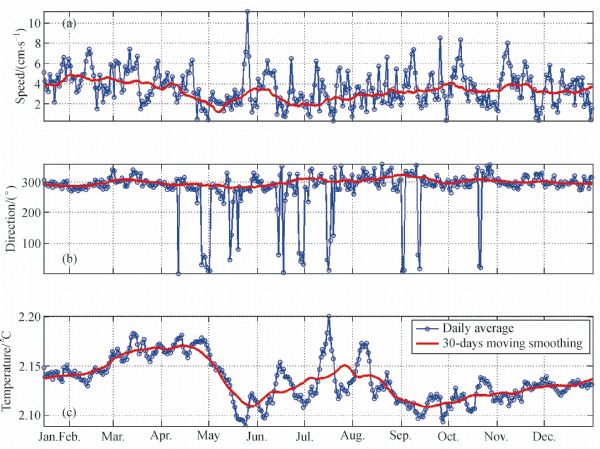
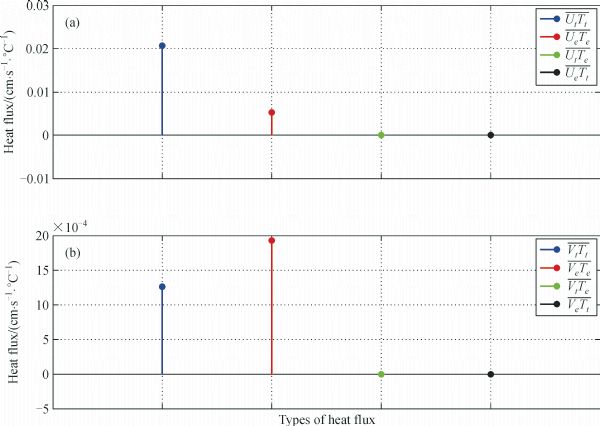
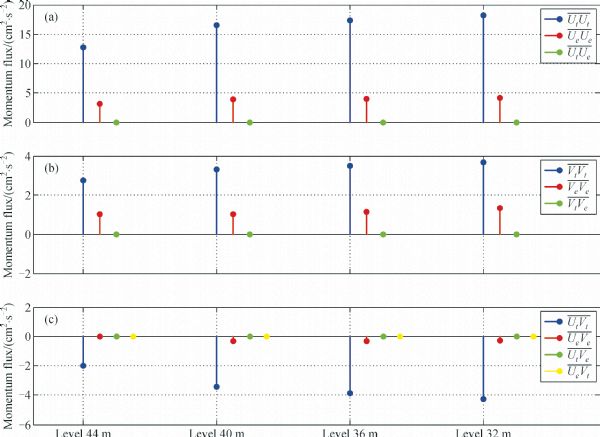
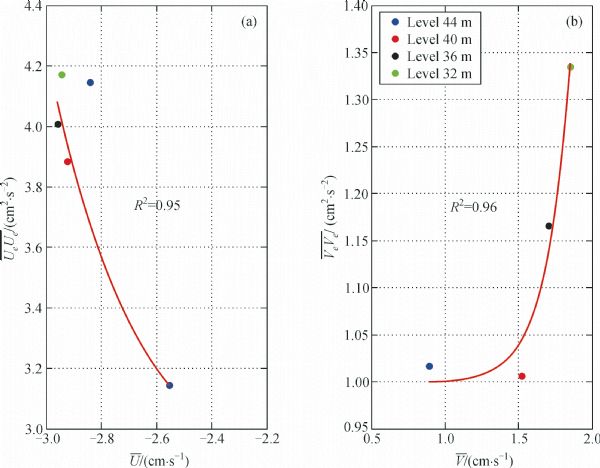
Abstract A deep-ocean mooring system was deployed 100 m away from an active hydrothermal vent over the Southwest Indian Ridge (SWIR), where the water depth is about 2,800 m. One year of data on ocean temperature 50 m away from the ocean floor and on velocities at four levels (44 m, 40 m, 36 m, and 32 m away from the ocean floor) were collected by the mooring system. Multiple-scale variations were extracted from these data: seasonal, tidal, super-tidal, and eddy scales. The semidiurnal tide was the strongest tidal signal among all the tidal constituents in both currents and temperature. With the multiple-scale variation presented in the data, a new method was developed to decompose the data into five parts in terms of temporal scales: time-mean, seasonal, tidal, super-tidal, and eddy. It was shown that both eddy and tidal heat (momentum) fluxes were characterized by variation in the bottom topography: the tidal fluxes of heat and momentum in the along-isobath direction were much stronger than those in the cross-isobath direction. For the heat flux, eddy heat flux was stronger than tidal heat flux in the cross-isobath direction, while eddy heat flux was weaker in the along-isobath direction. For the momentum flux, the eddy momentum flux was weaker than tidal momentum flux in both directions. The eddy momentum fluxes at the four levels had a good relationship with the magnitude of mean currents: it increased with the mean current in an exponential relationship.
|
| Keywords
multiple-scale analysis
tidal flux
eddy flux
|
|
Corresponding Author(s):
Chujin LIANG
|
|
Just Accepted Date: 26 August 2015
Online First Date: 30 September 2015
Issue Date: 30 October 2015
|
|
| 1 |
Cao H, Cao Z (2011). Review of submarine hydrothermal activities in Southwest Indian Ridge. Marine Geology and Quaternary Geology, 31(1): 67–75(in Chinese)
|
| 2 |
Crone T J, Wilcock W S (2005). Modeling the effects of tidal loading on mid-ocean ridge hydrothermal systems. Geochem Geophys Geosyst, 6(7): n/a
https://doi.org/10.1029/2004GC000905
|
| 3 |
Dong C, Idica E Y, McWilliams J C (2009). Circulation and multiple-scale variability in the Southern California Bight. Prog Oceanogr, 82(3): 168–190
https://doi.org/10.1016/j.pocean.2009.07.005
|
| 4 |
Edmonds H N, Michael P J, Baker E T, Connelly D P, Snow J E, Langmuir C H, Dick J B, Mühe R, German C R, Graham D W (2003). Discovery of abundant hydrothermal venting on the ultraslow-spreading Gakkel ridge in the Arctic Ocean. Nature, 421(6920): 252–256
https://doi.org/10.1038/nature01351
|
| 5 |
Emery W J, Meincke J (1986). Global water masses-summary and review. Oceanol Acta, 9(4): 383–391
|
| 6 |
Faria A F, Thornton E B, Stanton T P, Soares C V, Lippmann T C (1998). Vertical profiles of longshore currents and related bed shear stress and bottom roughness. Journal of Geophysical Research: Oceans (1978−2012), 103(C2): 3217–3232
|
| 7 |
Feddersen F, Guza R T, Elgar S, Herbers T H C (2000). Velocity moments in alongshore bottom stress parameterizations. Journal of Geophysical Research: Oceans (1978−2012), 105(C4): 8673–8686
|
| 8 |
Huang W, Tao C, Deng X, Zhou J, Sun Y, Dou B, Liu W (2009). Discussion and the scientific significance of IODP drilling to study in the 49°39′E vent field in Southwest Indian Ridge. Journal of Marine Sciences, 27(02): 97–103 (in Chinese)
|
| 9 |
Kolla V, Henderson L, Biscaye P E (1976a). Clay mineralogy and sedimentation in the western Indian Ocean. Deep-Sea Res, 23(10): 949–961
|
| 10 |
Kolla V, Sullivan L, Streeter S S, Langseth M G (1976b). Spreading of Antarctic Bottom Water and its effects on the floor of the Indian Ocean inferred from bottom-water potential temperature, turbidity, and sea-floor photography. Mar Geol, 21(3): 171–189
https://doi.org/10.1016/0025-3227(76)90058-X
|
| 11 |
LeBlond P H (1976). Temperature-salinity analysis of world ocean waters. Journal of the Fisheries Board of Canada, 33(6): 1471
https://doi.org/10.1139/f76-190
|
| 12 |
Li X, Chu F, Lei J, Zhao J (2008). Advances in slow-ultraslow-spreading Southwest Indian Ridge. Advances in Earth Science, 23(6): 595–603 (in Chinese)
|
| 13 |
Middleton J M, Thomson R E (1986). Modelling the rise of hydrothermal plumes. Canadian Technical Report of Hydrography and Ocean Science, 69: 1–18
|
| 14 |
Minshull T A, Muller M R, White R S (2006). Crustal structure of the Southwest Indian Ridge at 66 E: seismic constraints. Geophys J Int, 166(1): 135–147
https://doi.org/10.1111/j.1365-246X.2006.03001.x
|
| 15 |
Morton B R, Taylor G, Turner J S (1956). Turbulent gravitational convection from maintained and instantaneous sources. Proc R Soc Lond A Math Phys Sci, 234(1196): 1–23
https://doi.org/10.1098/rspa.1956.0011
|
| 16 |
Muller M R, Minshull T A, White R S (2000). Crustal structure of the Southwest Indian Ridge at the Atlantis II fracture zone. Journal of Geophysical Research: Solid Earth (1978−2012), 105(B11): 25809–25828
|
| 17 |
Pawlowicz R, Beardsley B, Lentz S (2002). Classical tidal harmonic analysis including error estimates in MATLAB using T_TIDE. Comput Geosci, 28(8): 929–937
https://doi.org/10.1016/S0098-3004(02)00013-4
|
| 18 |
Reid J L (2003). On the total geostrophic circulation of the Indian Ocean: flow patterns, tracers, and transports. Prog Oceanogr, 56(1): 137–186
https://doi.org/10.1016/S0079-6611(02)00141-6
|
| 19 |
Rooth C (1972). A linearized bottom friction law for large-scale oceanic motions. J Phys Oceanogr, 2(4): 509–510
https://doi.org/10.1175/1520-0485(1972)002<0509:ALBFLF>2.0.CO;2
|
| 20 |
Santoso A, England M H, Hirst A C (2006). Circumpolar deep water circulation and variability in a coupled climate model. J Phys Oceanogr, 36(8): 1523–1552
https://doi.org/10.1175/JPO2930.1
|
| 21 |
Speer K G, Rona P A (1989). A model of an Atlantic and Pacific hydrothermal plume. Journal of Geophysical Research: Oceans (1978−2012), 94(C5): 6213–6220
|
| 22 |
Tao C, Li H, Huang W, Han X, Wu G, Su X, Zhou N, Lin J, He Y H, Zhou J P (2011). Mineralogical and geochemical features of sulfide chimneys from the 49 39′E hydrothermal field on the Southwest Indian Ridge and their geological inferences. Chin Sci Bull, 56(26): 2828–2838
https://doi.org/10.1007/s11434-011-4619-4
|
| 23 |
Tao C, Lin J, Guo S, Chen Y, Wu G, Han X, German C R, Yoerger D R, Zhou N, Li H, Su X, Zhu J (2012). First active hydrothermal vents on an ultraslow-spreading center: Southwest Indian Ridge. Geology, 40(1): 47–50
https://doi.org/10.1130/G32389.1
|
| 24 |
Warren B A (1974). Deep flow in the Madagascar and Mascarene basins. Deep-Sea Res, 21(1): 1–21
|
| 25 |
Warren B A (1978). Bottom water transport through the Southwest Indian Ridge. Deep-Sea Res, 25(3): 315–321
https://doi.org/10.1016/0146-6291(78)90596-9
|
| 26 |
Wichers S (2005). Verification of numerical models for hydrothermal plume water through field measurements at TAG. Dissertation for PhD Degree. Massachusetts Institute of Technology
|
| 27 |
Zhang T, Gao J (2011). Characters of magmatic activity and tectonics on the ultraslow spreading ridge in Southwest Indian ocean. Advances in Marine Science, 29(03): 314–322 (in Chinese)
|
|
Viewed |
|
|
|
Full text
|
|
|
|
|
Abstract
|
|
|
|
|
Cited |
|
|
|
|
| |
Shared |
|
|
|
|
| |
Discussed |
|
|
|
|