|
|
|
Carbon concentrations of components of trees in 10-year-old Populus davidiana stands within the Desertification Combating Program of Northern China |
Huitao SHEN1,2,Wanjun ZHANG2,Jiansheng CAO2( ),Xiang ZHANG3,Quanhong XU1,Xue YANG4,Dengpan XIAO1,Yanxia ZHAO1 ),Xiang ZHANG3,Quanhong XU1,Xue YANG4,Dengpan XIAO1,Yanxia ZHAO1 |
1. Institute of Geographical Sciences, Hebei Academy of Sciences, Shijiazhuang 050011, China
2. Key Laboratory for Agricultural Water Resources, Hebei Key Laboratory for Agricultural Water-Saving, Center for Agricultural Resources Research, Institute of Genetics and Developmental Biology, Chinese Academy of Sciences, Shijiazhuang 050021, China
3. Institute of Agro-food Science and Technology, Shandong Academy of Agricultural Sciences, Jinan 250100, China
4. College of Agriculture, Kunming University, Kunming 650214, China |
|
|
|
|
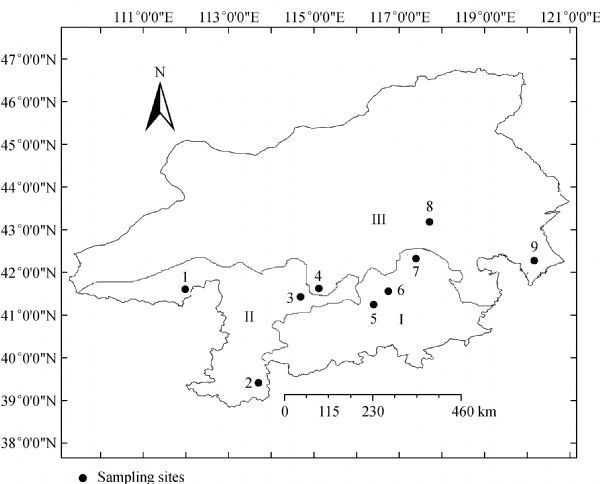
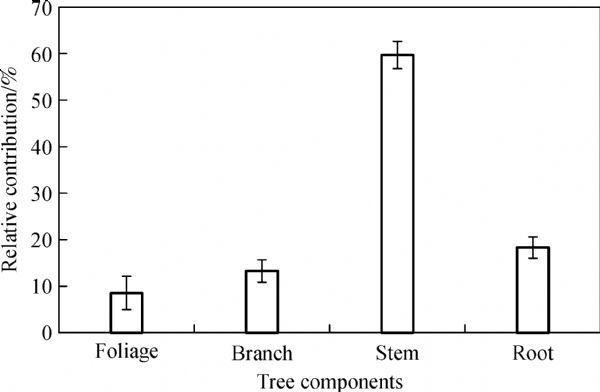
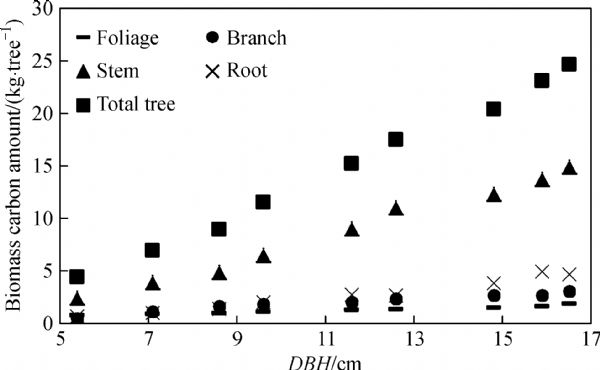
Abstract Most studies do not consider the potential variation in carbon concentration among the different tree components of the same species in regional scale. This study examined the carbon concentrations of the components (i.e., foliage, branch, stem, and root) in a 10-year-old poplar species (Populus davidiana Dode) from the Desertification Combating Program of Northern China. The highest and lowest carbon concentrations were found in the stem and foliage, respectively. There was a significant difference in carbon concentrations among the different tree components. All of the observed carbon concentrations of tree components were lower than those predicted using the conversion factor of 0.5 applied to component biomass. Stem carbon made up 59.7% of the total tree biomass carbon. The power equation estimating proportion of tree biomass carbon against the independent variable of diameter at breast height explained more than 90% of the variability in allocation of carbon among tree components. Tree height, as a second independent variable is also discussed. Our results suggest that the difference in organic carbon concentration among tree components should be incorporated into accurately develop forest carbon budget. Moreover, further investigations on how the diameter at breast height equation developed in the present study performs across broader scales are required.
|
| Keywords
biomass carbon equation
carbon content
destructive sampling
diameter at breast height
poplar
|
|
Corresponding Author(s):
Jiansheng CAO
|
|
Just Accepted Date: 25 February 2016
Online First Date: 24 March 2016
Issue Date: 04 November 2016
|
|
| 1 |
Bert D, Danjon F (2006). Carbon concentration variations in the roots, stem and crown of mature Pinus pinaster (Ait.). For Ecol Manag, 222(1‒3): 279–295
|
| 2 |
Buras A, Thevs N, Zerbe S, Wilmking M (2013). Productivity and carbon sequestration of Populus euphratica at the Amu River, Turkmenistan. Forestry, 86(4): 429–439
https://doi.org/10.1093/forestry/cpt014
|
| 3 |
Cao J, Wang X, Tian Y, Wen Z, Zha T (2012). Pattern of carbon allocation across three different stages of stand development of a Chinese pine (Pinus tabulaeformis) forest. Ecol Res, 27(5): 883–892
https://doi.org/10.1007/s11284-012-0965-1
|
| 4 |
Chen G Q, Han M Y (2015). Virtual land use change in China 2002–2010: internal transition and trade imbalance. Land Use Policy, 47: 55–65
https://doi.org/10.1016/j.landusepol.2015.03.017
|
| 5 |
Chen G Q, Zhang B (2010). Greenhouse gas emissions in China 2007: inventory and input–output analysis. Energy Policy, 38(10): 6180–6193
https://doi.org/10.1016/j.enpol.2010.06.004
|
| 6 |
Clifford D, Cressie N, England J R, Roxburgh S H, Paul K I (2013). Correction factors for unbiased, efficient estimation and prediction of biomass from log–log allometric models. For Ecol Manag, 310: 375–381
|
| 7 |
de Aza C H, Turrión M B, Pando V, Bravo F (2011). Carbon in heartwood, sapwood and bark along the stem profile in three Mediterranean Pinus species. Ann Sci, 68(6): 1067–1076
https://doi.org/10.1007/s13595-011-0122-y
|
| 8 |
Dorado F C, Diéguez-Aranda U, Barrio Anta M, Sánchez Rodríguez M, von Gadow K (2006). A generalized height–diameter model including random components for radiata pine plantations in northwestern Spain. For Ecol Manag, 229(1‒3): 202–213
|
| 9 |
Fang S, Xue J, Tang L (2007). Biomass production and carbon sequestration potential in poplar plantations with different management patterns. J Environ Manage, 85(3): 672–679
https://doi.org/10.1016/j.jenvman.2006.09.014
|
| 10 |
Fonseca W, Alice F E, Rey-Benayas J M (2012). Carbon accumulation in aboveground and belowground biomass and soil of different age native forest plantations in the humid tropical lowlands of Costa Rica. New For, 43(2): 197–211
https://doi.org/10.1007/s11056-011-9273-9
|
| 11 |
Gao S Y, Zhang C L, Zou X Y, Wu Y Q, Shi S, Li H D (2008). Benefits of Beijing-Tianjin Sand Source Control Engineering. Beijing: China Science Press
|
| 12 |
Gong J, Ge Z, An R, Duan Q, You X, Huang Y (2012). Soil respiration in poplar plantations in northern China at different forest ages. Plant Soil, 360(1‒2): 109–122
https://doi.org/10.1007/s11104-011-1121-3
|
| 13 |
Gower S T, Krankina O, Olson R J, Apps M, Linder S, Wang C (2001). Net primary production and carbon allocation patterns of boreal forest ecosystems. Ecol Appl, 11(5): 1395–1411
https://doi.org/10.1890/1051-0761(2001)011[1395:NPPACA]2.0.CO;2
|
| 14 |
Gower S T, Kucharik C J, Norman J M (1999). Direct and indirect estimation of leaf area index, fAPAR, and net primary production of terrestrial ecosystems. Remote Sens Environ, 70(1): 29–51
https://doi.org/10.1016/S0034-4257(99)00056-5
|
| 15 |
He Y, Qin L, Li Z, Liang X, Shao M, Tan L (2013). Carbon storage capacity of monoculture and mixed-species plantations in subtropical China. For Ecol Manag, 295: 193–198
|
| 16 |
Hu Y L, Zeng D H, Fan Z P, Chen G S, Zhao Q, Pepper D (2008). Changes in ecosystem carbon stocks following grassland afforestation of semiarid sandy soil in the southeastern Keerqin Sandy Lands, China. J Arid Environ, 72(12): 2193–2200
https://doi.org/10.1016/j.jaridenv.2008.07.007
|
| 17 |
Lamlom S H, Savidge R A (2003). A reassessment of carbon content in wood: variation within and between 41 North American species. Biomass Bioenergy, 25(4): 381–388
https://doi.org/10.1016/S0961-9534(03)00033-3
|
| 18 |
Li X, Yi M J, Son Y, Park P S, Lee K H, Son Y M, Kim R H, Jeong M J (2011). Biomass and carbon storage in an age-sequence of Korean pine (Pinus koraiensis) plantation forests in Central Korea. J Plant Biol, 54(1): 33–42
https://doi.org/10.1007/s12374-010-9140-9
|
| 19 |
Liang W J, Hu H Q, Liu F J, Zhang D M (2006). Research advance of biomass and carbon storage of poplar in China. J For Res, 17(1): 75–79
https://doi.org/10.1007/s11676-006-0018-0
|
| 20 |
Liu C, Lu J, Yin R (2010). An estimation of the effects of China’s Priority Forestry Programs on farmers’ income. Environ Manage, 45(3): 526–540
https://doi.org/10.1007/s00267-010-9433-2
|
| 21 |
Liu X P, Zhang W J, Cao J S, Shen H Y, Zeng X H, Yu Z Q, Zhao X (2013). Carbon storages in plantation ecosystems in sand source areas of North Beijing, China. PLoS ONE, 8(12): e82208
https://doi.org/10.1371/journal.pone.0082208
|
| 22 |
Mao R, Zeng D H (2010). Changes in soil particulate organic matter, microbial biomass, and activity following afforestation of marginal agricultural lands in a semi-arid area of northeast China. Environ Manage, 46(1): 110–116
https://doi.org/10.1007/s00267-010-9504-4
|
| 23 |
Mao R, Zeng D H, Hu Y L, Li L J, Yang D (2010). Soil organic carbon and nitrogen stocks in an age-sequence of poplar stands planted on marginal agricultural land in Northeast China. Plant Soil, 332(1‒2): 277–287
https://doi.org/10.1007/s11104-010-0292-7
|
| 24 |
Mendoza-Ponce A, Galicia L (2010). Aboveground and belowground biomass and carbon pools in highland temperate forest landscape in Central Mexico. Forestry, 83(5): 497–506
https://doi.org/10.1093/forestry/cpq032
|
| 25 |
Muukkonen P (2007). Generalized allometric volume and biomass equations for some tree species in Europe. Eur J For Res, 126(2): 157–166
https://doi.org/10.1007/s10342-007-0168-4
|
| 26 |
Pasalodos-Tato M, Ruiz-Peinado R, del Río M, Montero G (2015). Shrub biomass accumulation and growth rate models to quantify carbon stocks and fluxes for the Mediterranean region. Eur J For Res, 134(3): 537–553
https://doi.org/10.1007/s10342-015-0870-6
|
| 27 |
Petersson H, Melin Y (2010) Estimating the biomass and carbon pool of stump systems at a national scale. For Ecol Manage, 260(4): 466–471
|
| 28 |
Pilli R, Anfodillo T, Carrer M (2006). Towards a functional and simplified allometry for estimating forest biomass. For Ecol Manag, 237(1‒3):583–593
|
| 29 |
Schlesinger W H, Lichter J (2001). Limited carbon storage in soil and litter of experimental forest plots under increased atmospheric CO2. Nature, 411(6836): 466–469
https://doi.org/10.1038/35078060
|
| 30 |
Singh P, Lodhiyal L S (2009). Biomass and carbon allocation in 8-year-old poplar (Populus deltoides Marsh) plantation in Tarai agroforestry systems of Central Himalaya, India. New York Sci J, 2: 49–53
|
| 31 |
Tolunay D (2009). Carbon concentrations of tree components, forest floor and understorey in young Pinus sylvestris stands in north-western Turkey. Scand J For Res, 24(5): 394–402
https://doi.org/10.1080/02827580903164471
|
| 32 |
Toromani E, Sanxhaku M, Sallaku M, Shaho E (2011). Biomass production and carbon storage of Populus × canadensis Guinier I-214 plantations grown at Pogradeci region in Albania. South For, 73(2): 91–99
|
| 33 |
Wang C (2006). Biomass allometric equations for 10 co-occurring tree species in Chinese temperate forests. For Ecol Manag, 222(1‒3): 9–16
|
| 34 |
Wang Q, Wang S, Zhang J (2009). Assessing the effects of vegetation types on carbon storage fifteen years after reforestation on a Chinese fir site. For Ecol Manag, 258(7):1437–1441
|
| 35 |
Wilske B, Lu N, Wei L, Chen S, Zha T, Liu C, Xu W, Noormets A, Huang J, Wei Y, Chen J, Zhang Z, Ni J, Sun G, Guo K, McNulty S, John R, Han X, Lin G, Chen J (2009). Poplar plantation has the potential to alter the water balance in semiarid Inner Mongolia. J Environ Manage, 90(8): 2762–2770
https://doi.org/10.1016/j.jenvman.2009.03.004
|
| 36 |
Yan Y F, Yang L K (2010). China’s foreign trade and climate change: a case study of CO2 emissions. Energy Policy, 38(1): 350–356
https://doi.org/10.1016/j.enpol.2009.09.025
|
| 37 |
Zhang Q, Wang C, Wang X, Quan X (2009). Carbon concentration variability of 10 Chinese temperate tree species. For Ecol Manag, 258(5): 722–727
|
| 38 |
Zheng H, Ouyang Z, Xu W, Wang X, Miao H, Li X, Tian Y (2008). Variation of carbon storage by different reforestation types in the hilly red soil region of southern China. For Ecol Manag, 255 (3‒4): 1113–1121
|
|
Viewed |
|
|
|
Full text
|
|
|
|
|
Abstract
|
|
|
|
|
Cited |
|
|
|
|
| |
Shared |
|
|
|
|
| |
Discussed |
|
|
|
|