|
|
|
Effects of diurnal adjustment on biases and trends derived from inter-sensor calibrated AMSU-A data |
H. CHEN1, X. ZOU2( ), Z. QIN3 ), Z. QIN3 |
1. Department of Atmospheric and Oceanic Sciences, University of Colorado, Boulder, Colorado, CO 80309, USA
2. Earth System Science Interdisciplinary Center (ESSIC), University of Maryland, College Park, Maryland, MD 20742, USA
3. Joint Center for Data Assimilation Research and Applications, Nanjing University of Information Science and Technology, Nanjing 210044, China |
|
|
|
|
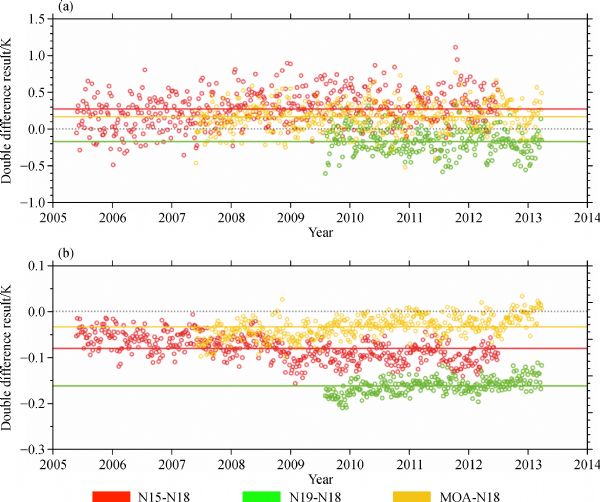
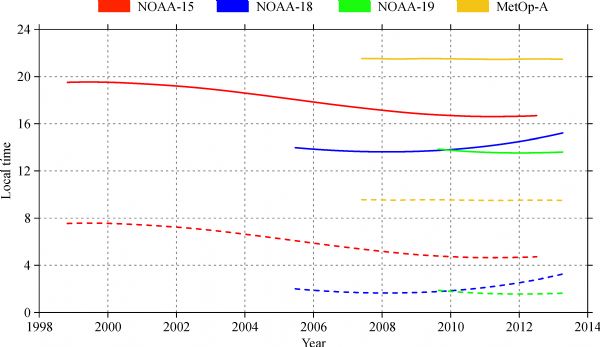
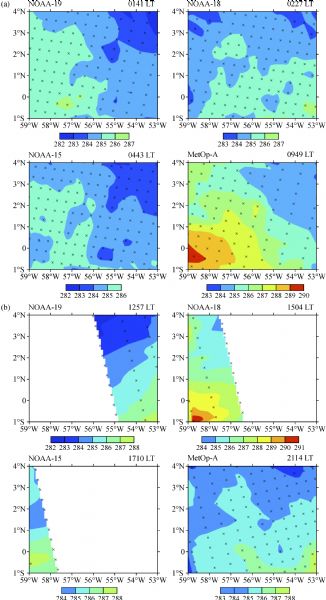
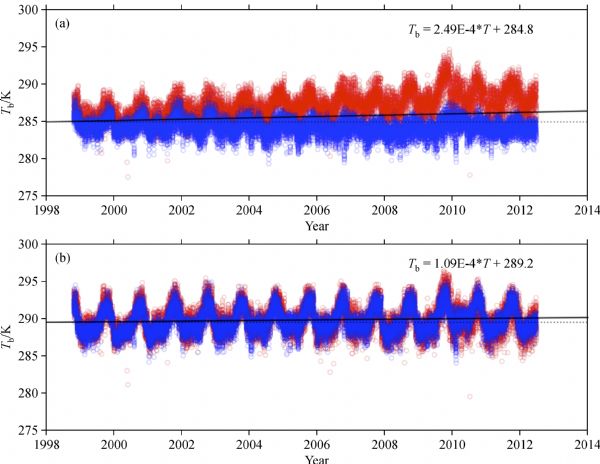
Abstract Measurements of brightness temperatures from Advanced Microwave Sounding Unit-A (AMSU-A) temperature sounding instruments onboard NOAA Polar-orbiting Operational Environmental Satellites (POES) have been extensively used for studying atmospheric temperature trends over the past several decades. Inter-sensor biases, orbital drifts and diurnal variations of atmospheric and surface temperatures must be considered before using a merged long-term time series of AMSU-A measurements from NOAA-15, -18, -19 and MetOp-A. We study the impacts of the orbital drift and orbital differences of local equator crossing times (LECTs) on temperature trends derivable from AMSU-A using near-nadir observations from NOAA-15, NOAA-18, NOAA-19, and MetOp-A during 1998−2014 over the Amazon rainforest. The double difference method is firstly applied to estimation of inter-sensor biases between any two satellites during their overlapping time period. The inter-calibrated observations are then used to generate a monthly mean diurnal cycle of brightness temperature for each AMSU-A channel. A diurnal correction is finally applied each channel to obtain AMSU-A data valid at the same local time. Impacts of the inter-sensor bias correction and diurnal correction on the AMSU-A derived long-term atmospheric temperature trends are separately quantified and compared with those derived from original data. It is shown that the orbital drift and differences of LECT among different POESs induce a large uncertainty in AMSU-A derived long-term warming/cooling trends. After applying an inter-sensor bias correction and a diurnal correction, the warming trends at different local times, which are approximately the same, are smaller by half than the trends derived without applying these corrections.
|
| Keywords
AMSU-A
diurnal adjustment
decadal temperature trend
|
|
Corresponding Author(s):
X. ZOU
|
|
Just Accepted Date: 25 September 2017
Online First Date: 14 November 2017
Issue Date: 23 January 2018
|
|
| 1 |
Aldrich J (1998). Doing least squares: perspectives from Gauss and Yule. Int Stat Rev, 66(1): 61–81
https://doi.org/10.1111/j.1751-5823.1998.tb00406.x
|
| 2 |
Andersson E, Hollingsworth A, Kelly G, Lonnberg P, Pailleux J, Zhang Z (1991). Global observing system experiments on operational statistical retrievals of satellite sounding data. Mon Weather Rev, 119(8): 1851–1864
https://doi.org/10.1175/1520-0493(1991)119<1851:GOSEOO>2.0.CO;2
|
| 3 |
Cao C, Weinreb M, Xu H (2004). Predicting simultaneous nadir overpasses among polar-orbiting meteorological satellites for the intersatellite calibration of radiometers. J Atmos Ocean Technol, 21(4): 537–542
https://doi.org/10.1175/1520-0426(2004)021<0537:PSNOAP>2.0.CO;2
|
| 4 |
Clough S A, Shephard M W, Mlawer E J, Delamere J S, Iacono M, Cady-Pereira K E, Boukabara S, Brown P D (2005). Atmospheric radiative transfer modeling: a summary of the AER codes. J Quant Spectrosc Radiat Transf, 91(2): 233–244
https://doi.org/10.1016/j.jqsrt.2004.05.058
|
| 5 |
Derber J C, Wu W S (1998). The use of TOVS cloud-cleared radiances in the NCEP SSI analysis system. Mon Weather Rev, 126(8): 2287–2299
https://doi.org/10.1175/1520-0493(1998)126<2287:TUOTCC>2.0.CO;2
|
| 6 |
Eyre J R, Kelly G A, McNally A P, Andersson E, Persson A (1993). Assimilation of TOVS radiance information through one-dimensional variational analysis. Q J R Meteorol Soc, 119(514): 1427–1463
https://doi.org/10.1002/qj.49711951411
|
| 7 |
Ferraro R R, Weng F, Grody N C, Zhao L (2000). Precipitation characteristics over land from the NOAA-15 AMSU sensor. Geophys Res Lett, 27(17): 2669–2672
https://doi.org/10.1029/2000GL011665
|
| 8 |
Han Y, Weng F, Liu Q, van Delst P (2007). A fast radiative transfer model for SSMIS upper atmosphere sounding channels. Journal of Geophysical Research: Atmospheres, 112(D11): D11121
https://doi.org/10.1029/2006JD008208
|
| 9 |
Kroodsma R A, McKague D S, Ruf C S (2012). Inter-calibration of microwave radiometers using the vicarious cold calibration double difference method. IEEE Journal of Selected Topics in Applied Earth Observations and Remote Sensing, 5: 1006–1013
|
| 10 |
Mears C A, Schabel M C, Wentz F J, Santer B D, Govindasamy B (2002). Correcting the MSU middle tropospheric temperature for diurnal drifts. Geoscience and Remote Sensing Symposium, 2002. IGARSS '02. 2002 IEEE International, 3: 1839–1841
|
| 11 |
Mo T (1996). Prelaunch calibration of the advanced microwave sounding unit-A for NOAA-K. IEEE Trans Microw Theory Tech, 44(8): 1460–1469
https://doi.org/10.1109/22.536029
|
| 12 |
Mo T (2007). Diurnal variation of the AMSU-A brightness temperatures over the Amazon rainforest. IEEE Transactions on Geoscience and Remote Sensing, 45: 958–969
|
| 13 |
Privette J L, Fowler C, Wick G A, Baldwin D, Emery W J (1995). Effects of orbital drift on advanced very high resolution radiometer products: normalized difference vegetation index and sea surface temperature. Remote Sens Environ, 53(3): 164–171
https://doi.org/10.1016/0034-4257(95)00083-D
|
| 14 |
Tian X, Zou X (2016). ATMS- and AMSU-A-derived hurricane warm core structures using a modified retrieval algorithm. J Geophys Res Atmos, 121(21): 12,630–12,646
https://doi.org/10.1002/2016JD025042
|
| 15 |
Wang L, Goldberg M, Wu X, Cao C, Iacovazzi R A, Yu F, Li Y (2011). Consistency assessment of atmospheric infrared sounder and infrared atmospheric sounding interferometer radiances: double differences versus simultaneous nadir overpasses. Journal of Geophysical Research: Atmospheres, 116( D11): 755–764
|
| 16 |
Weng F (2007). Advances in radiative transfer modeling in support of satellite data assimilation. J Atmos Sci, 64(11): 3799–3807
https://doi.org/10.1175/2007JAS2112.1
|
| 17 |
Weng F, Grody N C (2000). Retrieval of ice cloud parameters using a microwave imaging radiometer. J Atmos Sci, 57(8): 1069–1081
https://doi.org/10.1175/1520-0469(2000)057<1069:ROICPU>2.0.CO;2
|
| 18 |
Weng F, Zhao L, Ferraro R R, Poe G, Li X, Grody N C (2003). Advanced microwave sounding unit cloud and precipitation algorithms. Radio Sci, 38(4): 8068
https://doi.org/10.1029/2002RS002679
|
| 19 |
Zou C, Goldberg M D, Cheng Z, Grody N C, Sullivan J T, Cao C, Tarpley D (2006). Recalibration of microwave sounding unit for climate studies using simultaneous nadir overpasses. Journal of Geophysical Research: Atmospheres, 111( D19): 5455–5464
|
| 20 |
Zou C, Wang W (2011). Intersatellite calibration of AMSU-A observations for weather and climate applications. Journal of Geophysical Research: Atmospheres, 116( D23): 23113
|
| 21 |
Zou X, Wang X, Weng F, Li G (2011). Assessments of Chinese Fengyun Microwave Temperature Sounder (MWTS) measurements for weather and climate applications. J Atmos Ocean Technol, 28(10): 1206–1227
https://doi.org/10.1175/JTECH-D-11-00023.1
|
| 22 |
Zou X, Weng F, Yang H (2014). Connecting the time series of microwave sounding observations from AMSU to ATMS for long-term monitoring of climate. Journal of Atmospheric & Oceanic Technology, 31(10): 2206–2222
|
|
Viewed |
|
|
|
Full text
|
|
|
|
|
Abstract
|
|
|
|
|
Cited |
|
|
|
|
| |
Shared |
|
|
|
|
| |
Discussed |
|
|
|
|