|
|
|
18F-FDG-PET glucose hypometabolism pattern in patients with epileptogenic hypothalamic hamartoma |
Chao Lu1,2, Kailiang Wang1,2, Fei Meng1,2, Yihe Wang1,2, Yongzhi Shan1,2( ), Penghu Wei1,2(), Guoguang Zhao1,2,3() ), Penghu Wei1,2(), Guoguang Zhao1,2,3() |
1. Department of Neurosurgery, Xuanwu Hospital, Capital Medical University, Beijing 100053, China
2. China International Neuroscience Institute (CHINA-INI), Beijing 100053, China
3. Center of Epilepsy, Beijing Institute for Brain Disorder, Beijing 100069, China |
|
|
|
|
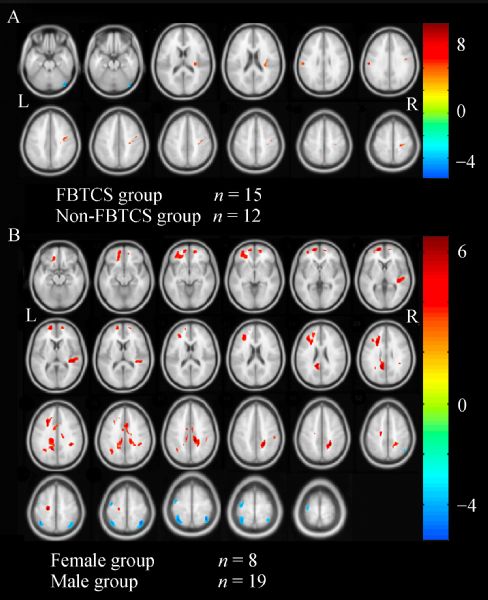
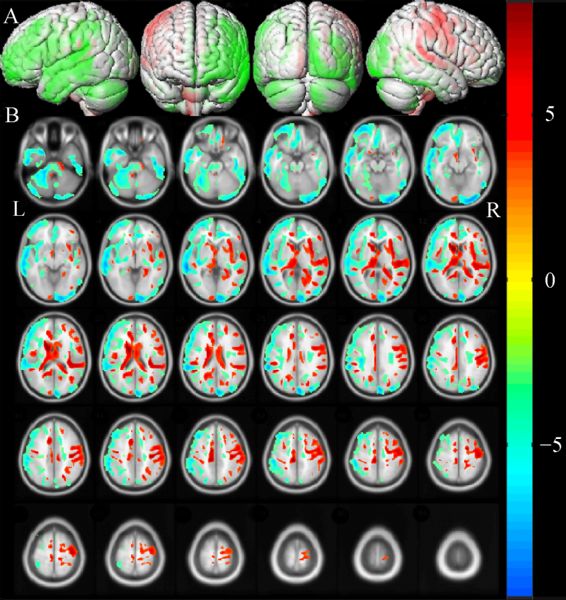
Abstract Epileptogenic hypothalamic hamartoma is characterized by intractable gelastic seizures. A systematic analysis of the overall brain metabolic pattern in patients with hypothalamic hamartoma (HH) could facilitate the understanding of the epileptic brain network and the associated brain damage effects of HH. In this study, we retrospectively evaluated 27 patients with epileptogenic HH (8 female patients; age, 2–33 years) by using 18F-fluorodeoxyglucose-positron emission tomography. The correlations among tomography result, seizure type, sex, and structural magnetic resonance imaging were assessed. Whole metabolic patterns and voxel-based morphometry findings were assessed by group analysis with healthy controls. Assessment of the whole metabolic pattern in patients with HH revealed several regional metabolic reductions in the cerebrum and an overall metabolic reduction in the cerebellum. In addition, areas showing hypometabolism in the neocortex were more widely distributed ipsilaterally than contralaterally to the HH. Reductions in glucose metabolism and gray matter volume in the neocortex were predominant ipsilateral to the HH. In conclusion, the glucose hypometabolism pattern in patients with epileptogenic HH involved the neocortex, subcortical regions, and cerebellum. The characteristics of glucose hypometabolism differed across seizure type and sex. Reductions in glucose metabolism and structural changes may be based on different mechanisms, but both are likely to occur ipsilateral to the HH in the neocortex. We hypothesized that the dentato-rubro-thalamic tract and cerebro-ponto-cerebellar tract, which are responsible for intercommunication between the cerebral cortex, subcortical regions, and cerebellar regions, may be involved in a pathway related to seizure propagation, particularly gelastic seizures, in patients with HH.
|
| Keywords
hypothalamic hamartoma
gelastic seizure
fluorodeoxyglucose-positron emission tomography
voxel-based morphometry
|
|
Corresponding Author(s):
Yongzhi Shan,Penghu Wei,Guoguang Zhao
|
|
Just Accepted Date: 29 October 2021
Online First Date: 23 November 2021
Issue Date: 27 December 2021
|
|
| 1 |
K Wagner, A Schulze-Bonhage, H Urbach, M Trippel, TS Spehl, F Buschmann, B Metternich, I Ofer, PT Meyer, L Frings. Reduced glucose metabolism in neocortical network nodes remote from hypothalamic hamartomas reflects cognitive impairment. Epilepsia 2017; 58(Suppl 2): 41–49
https://doi.org/10.1111/epi.13757
pmid: 28591477
|
| 2 |
GN Breningstall. Gelastic seizures, precocious puberty, and hypothalamic hamartoma. Neurology 1985; 35(8): 1180–1183
https://doi.org/10.1212/WNL.35.8.1180
pmid: 4022351
|
| 3 |
D Wang, Y Shan, F Bartolomei, P Kahane, Y An, M Li, H Zhang, X Fan, S Ou, Y Yang, P Wei, C Lu, Y Wang, J Du, L Ren, Y Wang, G Zhao. Electrophysiological properties and seizure networks in hypothalamic hamartoma. Ann Clin Transl Neurol 2020; 7(5): 653–666
https://doi.org/10.1002/acn3.51033
pmid: 32298053
|
| 4 |
P Kahane, P Ryvlin, D Hoffmann, L Minotti, AL Benabid. From hypothalamic hamartoma to cortex: what can be learnt from depth recordings and stimulation? Epileptic Disord 2003; 5(4): 205–217
pmid: 14975789
|
| 5 |
J Wu, L Xu, DY Kim, JM Rho, PA St John, LF Lue, S Coons, K Ellsworth, L Nowak, E Johnson, H Rekate, JF Kerrigan. Electrophysiological properties of human hypothalamic hamartomas. Ann Neurol 2005; 58(3): 371–382
https://doi.org/10.1002/ana.20580
pmid: 16130091
|
| 6 |
SG Mueller, KD Laxer, N Cashdollar, S Buckley, C Paul, MW Weiner. Voxel-based optimized morphometry (VBM) of gray and white matter in temporal lobe epilepsy (TLE) with and without mesial temporal sclerosis. Epilepsia 2006; 47(5): 900–907
https://doi.org/10.1111/j.1528-1167.2006.00512.x
pmid: 16686655
|
| 7 |
DS Barron, PM Fox, AR Laird, JL Robinson, PT Fox. Thalamic medial dorsal nucleus atrophy in medial temporal lobe epilepsy: a VBM meta-analysis. Neuroimage Clin 2013; 2: 25–32
https://doi.org/10.1016/j.nicl.2012.11.004
pmid: 24179755
|
| 8 |
A Labate, A Cerasa, A Gambardella, U Aguglia, A Quattrone. Hippocampal and thalamic atrophy in mild temporal lobe epilepsy: a VBM study. Neurology 2008; 71(14): 1094–1101
https://doi.org/10.1212/01.wnl.0000326898.05099.04
pmid: 18824674
|
| 9 |
MR Ponisio, JM Zempel, BK Day, LN Eisenman, MM Miller-Thomas, MD Smyth, RE Hogan. The role of SPECT and PET in epilepsy. AJR Am J Roentgenol 2021; 216(3): 759–768
https://doi.org/10.2214/AJR.20.23336
pmid: 33474983
|
| 10 |
K Shang, J Wang, X Fan, B Cui, J Ma, H Yang, Y Zhou, G Zhao, J Lu. Clinical value of hybrid TOF-PET/MR imaging-based multiparametric imaging in localizing seizure focus in patients with MRI-negative temporal lobe epilepsy. AJNR Am J Neuroradiol 2018; 39(10): 1791–1798
https://doi.org/10.3174/ajnr.A5814
pmid: 30237304
|
| 11 |
S Vickery, WD Hopkins, CC Sherwood, SJ Schapiro, RD Latzman, S Caspers, C Gaser, SB Eickhoff, R Dahnke, F Hoffstaedter. Chimpanzee brain morphometry utilizing standardized MRI preprocessing and macroanatomical annotations. eLife 2020; 9: e60136
https://doi.org/10.7554/eLife.60136
pmid: 33226338
|
| 12 |
F Lamarche, AS Job, P Deman, M Bhattacharjee, D Hoffmann, C Gallazzini-Crépin, S Bouvard, L Minotti, P Kahane, O David. Correlation of FDG-PET hypometabolism and SEEG epileptogenicity mapping in patients with drug-resistant focal epilepsy. Epilepsia 2016; 57(12): 2045–2055
https://doi.org/10.1111/epi.13592
pmid: 27861778
|
| 13 |
S Lagarde, M Boucekine, A McGonigal, R Carron, D Scavarda, A Trebuchon, M Milh, L Boyer, F Bartolomei, E. Guedj Relationship between PET metabolism and SEEG epileptogenicity in focal lesional epilepsy. 2020; 47: 3130–3142
https://doi.org/10.1007/s00259-020-04791-1
|
| 14 |
PH Wei, Y An, XT Fan, YH Wang, YF Yang, LK Ren, YZ Shan, GG Zhao. Stereoelectroencephalography-guided radiofrequency thermocoagulation for hypothalamic hamartomas: preliminary evidence. World Neurosurg 2018; 114: e1073–e1078
https://doi.org/10.1016/j.wneu.2018.03.148
pmid: 29605700
|
| 15 |
KA Fenoglio, J Wu, DY Kim, TA Simeone, SW Coons, H Rekate, JM Rho, JF Kerrigan. Hypothalamic hamartoma: basic mechanisms of intrinsic epileptogenesis. Semin Pediatr Neurol 2007; 14(2): 51–59
https://doi.org/10.1016/j.spen.2007.03.002
pmid: 17544947
|
| 16 |
D Wang, Y Shan, F Bartolomei, P Kahane, Y An, M Li, H Zhang, X Fan, S Ou, Y Yang, P Wei, C Lu, Y Wang, J Du, L Ren, Y Wang, G Zhao. Electrophysiological properties and seizure networks in hypothalamic hamartoma. Ann Clin Transl Neurol 2020; 7(5): 653–666
https://doi.org/10.1002/acn3.51033
pmid: 32298053
|
| 17 |
P Ryvlin, C Ravier, S Bouvard, F Mauguire, D Le Bars, A Arzimanoglou, J Petit, P Kahane. Positron emission tomography in epileptogenic hypothalamic hamartomas. Epileptic Disord 2003; 5(4): 219–227
pmid: 14975790
|
| 18 |
YF Yang, PH Wei, F Meng, Y An, XT Fan, YH Wang, D Wang, LK Ren, YZ Shan, GG Zhao. Glucose metabolism characteristics of extra-hypothalamic cortex in patients with hypothalamic hamartomas (HH) undergoing epilepsy evaluation: a retrospective study of 16 cases. Front Neurol 2021; 11: 587622
https://doi.org/10.3389/fneur.2020.587622
pmid: 33519673
|
| 19 |
C McCormick, AB Protzner, AJ Barnett, M Cohn, TA Valiante, MP McAndrews. Linking DMN connectivity to episodic memory capacity: what can we learn from patients with medial temporal lobe damage? Neuroimage Clin 2014; 5: 188–196
https://doi.org/10.1016/j.nicl.2014.05.008
pmid: 25068108
|
| 20 |
CY Hu, X Gao, L Long, X Long, C Liu, Y Chen, Y Xie, C Liu, B Xiao, ZY Hu. Altered DMN functional connectivity and regional homogeneity in partial epilepsy patients: a seventy cases study. Oncotarget 2017; 8(46): 81475–81484
https://doi.org/10.18632/oncotarget.20575
pmid: 29113406
|
| 21 |
A Mohan, AJ Roberto, A Mohan, A Lorenzo, K Jones, MJ Carney, L Liogier-Weyback, S Hwang, KAB Lapidus. The significance of the default mode network (DMN) in neurological and neuropsychiatric disorders: a review. Yale J Biol Med 2016; 89(1): 49–57
pmid: 27505016
|
| 22 |
KL Wang, W Hu, TH Liu, XB Zhao, CL Han, XT Xia, JG Zhang, F Wang, FG Meng. Metabolic covariance networks combining graph theory measuring aberrant topological patterns in mesial temporal lobe epilepsy. CNS Neurosci Ther 2019; 25(3): 396–408
https://doi.org/10.1111/cns.13073
pmid: 30298594
|
| 23 |
F Chassoux, E Artiges, F Semah, S Desarnaud, A Laurent, E Landré, P Gervais, B Devaux, OB Helal. Determinants of brain metabolism changes in mesial temporal lobe epilepsy. Epilepsia 2016; 57(6): 907–919
https://doi.org/10.1111/epi.13377
pmid: 27061896
|
| 24 |
P Iannetti, A Spalice, U Raucci, G Atzei, C Cipriani. Gelastic epilepsy: video-EEG, MRI and SPECT characteristics. Brain Dev 1997; 19(6): 418–421
https://doi.org/10.1016/S0387-7604(97)00042-9
pmid: 9339871
|
| 25 |
K Usami, R Matsumoto, N Sawamoto, H Murakami, M Inouchi, T Fumuro, A Shimotake, T Kato, T Mima, H Shirozu, H Masuda, H Fukuyama, R Takahashi, S Kameyama, A Ikeda. Epileptic network of hypothalamic hamartoma: an EEG-fMRI study. Epilepsy Res 2016; 125: 1–9
https://doi.org/10.1016/j.eplepsyres.2016.05.011
pmid: 27295078
|
| 26 |
J Parvizi, SW Anderson, CO Martin, H Damasio, AR Damasio. Pathological laughter and crying: a link to the cerebellum. Brain 2001; 124(9): 1708–1719
https://doi.org/10.1093/brain/124.9.1708
pmid: 11522574
|
| 27 |
AE Elyas, DO Bulters, OC Sparrow. Pathological laughter and crying in patients with pontine lesions. J Neurosurg Pediatr 2011; 8(6): 544–547
https://doi.org/10.3171/2011.8.PEDS11265
pmid: 22132910
|
| 28 |
L Zhang, B Cao, QQ Wei, R Ou, B Zhao, J Yang, Y Wu, H Shang. Pathological laughter and crying in multiple system atrophy with different subtypes: frequency and related factors. J Affect Disord 2021; 283: 60–65
https://doi.org/10.1016/j.jad.2020.12.096
pmid: 33517229
|
| 29 |
S Striano, P Striano. Clinical features and evolution of the gelastic seizures-hypothalamic hamartoma syndrome. Epilepsia 2017; 58(Suppl 2): 12–15
https://doi.org/10.1111/epi.13753
pmid: 28591476
|
| 30 |
I Savic, J Engel Jr. Structural and functional correlates of epileptogenesis—does gender matter? Neurobiol Dis 2014; 70: 69–73
https://doi.org/10.1016/j.nbd.2014.05.028
pmid: 24943053
|
| 31 |
G Chételat, B Landeau, F Eustache, F Mézenge, F Viader, V de la Sayette, B Desgranges, JC Baron. Using voxel-based morphometry to map the structural changes associated with rapid conversion in MCI: a longitudinal MRI study. Neuroimage 2005; 27(4): 934–946
https://doi.org/10.1016/j.neuroimage.2005.05.015
pmid: 15979341
|
| 32 |
TE Losey, SC Beeman, YT Ng, JF Kerrigan, LC Baxter. White matter density is increased in patients with hypothalamic hamartoma and multiple seizure types. Epilepsy Res 2011; 93(2–3): 212–215
https://doi.org/10.1016/j.eplepsyres.2010.12.006
pmid: 21232922
|
|
Viewed |
|
|
|
Full text
|
|
|
|
|
Abstract
|
|
|
|
|
Cited |
|
|
|
|
| |
Shared |
|
|
|
|
| |
Discussed |
|
|
|
|