|
|
|
Quantitative determination of n-heptane and n-octane using terahertz time-domain spectroscopy with chemometrics methods |
Honglei ZHAN1,Fangli QIN1,2,Wujun JIN1,Li’na GE1,Honglan LIU1,Kun ZHAO1,2,*( ) ) |
1. Key Laboratory of Oil and Gas Terahertz Spectroscopy and Photoelectric Detection, CPCIF, Beijing 100723, China
2. Laboratory of Optic Sensing and Detecting Technology, China University of Petroleum, Beijing 102249, China |
|
|
|
|
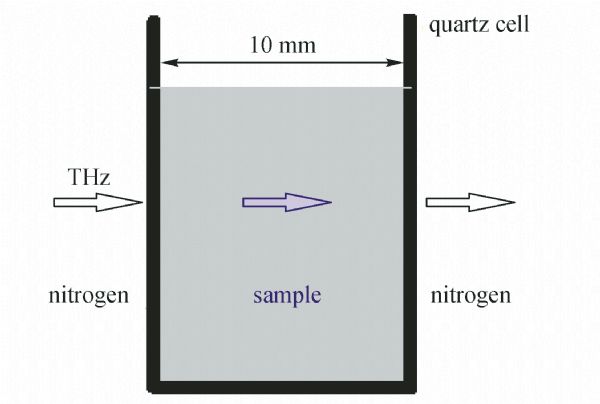
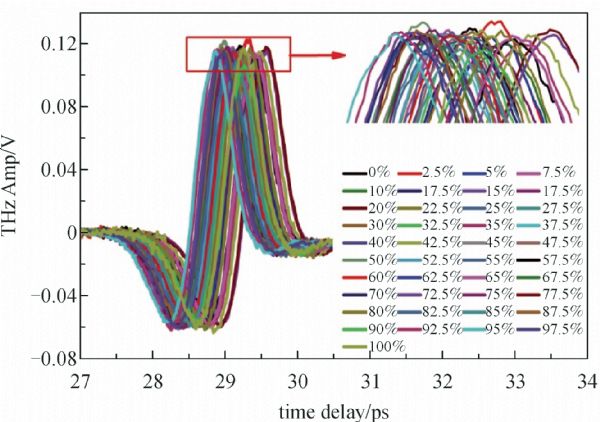
Abstract This paper introduces the terahertz time-domain spectroscopy (THz-TDS) used for the quantitative detection of n-heptane volume ratios in 41 n-heptane and n-octane mixtures with the concentration range of 0-100% at the intervals of 2.5%. Among 41 samples, 33 were used for calibration and the remaining 8 for validation. Models of chemometrics methods, including partial least squares (PLS) and back propagation-artificial neural network (BP-ANN), were built between the THz-TDS and the n-heptane percentage. To evaluate the quality of the built models, we calculated the correlation coefficient (R) and root-mean-square errors (RMSE) of calibration and validation models. R and RMSE of two methods were close to 1 and 0 within acceptable levels, respectively, demonstrating that the combination of THz-TDS and chemometrics methods is a potential and promising tool for further quantitative detection of n-alkanes.
|
| Keywords
partial least squares (PLS)
terahertz time-domain spectroscopy (THz-TDS)
n-heptane
n-octane
back propagation-artificial neural network (BP-ANN)
|
|
Corresponding Author(s):
Kun ZHAO
|
|
Online First Date: 17 December 2013
Issue Date: 13 February 2015
|
|
| 1 |
Yamaguchi M, Serafin S V, Morton T H, Chronister E L. Infrared absorption studies of n-heptane under high pressure. Journal of Physical Chemistry B, 2003, 107(12): 2815–2821
https://doi.org/10.1021/jp0221439
|
| 2 |
Brunel L C, Dows D A. Raman spectra of n-alkane crystals: lattice vibration of n-hexane, n-heptane and n-octane. Spectrochimica Acta Part A: Molecular Spectroscopy, 1974, 30(4): 929–940
https://doi.org/10.1016/0584-8539(74)80008-5
|
| 3 |
Snyder R G, Kim Y. Conformation and low-frequency isotropic Raman spectra of the liquid n-alkanes C4-C9. Journal of Physical Chemistry, 1991, 95(2): 602–610
https://doi.org/10.1021/j100155a022
|
| 4 |
Cameron D G, Hsi S C, Umemura J, Mantsch H H. Solvent induced frequency shifts of the C-H stretching bands of n-octane. A Fourier transform infrared study. Canadian Journal of Chemistry, 1981, 59(9): 1357–1360
https://doi.org/10.1139/v81-199
|
| 5 |
Zhao H, Zhao K, Bao R M. Fuel property determination of biodiesel-diesel blends by terahertz spectrum, Journal of Infrared, Millimeter, and Terahertz Waves, 2012, 33(5): 522–528
https://doi.org/10.1007/s10762-012-9886-x
|
| 6 |
Dragoman D, Dragoman M. Terahertz fields and applications. Progress in Quantum Electronics, 2004, 28(1): 1–66
https://doi.org/10.1016/S0079-6727(03)00058-2
|
| 7 |
Watanabe Y, Kawase K, Ikari T, Ito H, Ishikaw Y, Minamide H. Component analysis of chemical mixtures using terahertz spectroscopic imaging. Optics Communications, 2004, 234(1–6): 125–129
|
| 8 |
Tian L, Zhou Q L, Jin B, Zhao K, Zhao S Q, Shi Y L, Zhang C L. Optical property and spectroscopy studies on the selected lubricating oil in the terahertz range. Science in China Series G: Physics, Mechanics and Astronomy, 2009, 52(12): 1938–1943
https://doi.org/10.1007/s11433-009-0310-z
|
| 9 |
Zhao H, Zhao K, Tian L, Zhao S Q, Zhou Q L, Shi Y L, Zhao D M, Zhang C L. Spectrum features of commercial derv fuel oils in terahertz region. Science China Physics, Mechanics & Astronomy, 2012, 55(2): 195–198
https://doi.org/10.1007/s11433-011-4597-1
|
| 10 |
Bao R M, Wu S X, Zhao K, Zheng L J, Xu C H. Applying terahertz time-domain spectroscopy to probe the evolution of kerogen in close pyrolysis systems. Science China Physics, Mechanics & Astronomy, 2013, 56(8): 1603–1605
https://doi.org/10.1007/s11433-013-5085-6
|
| 11 |
Wold S, Sj?str?m M, Eriksson L. PLS-regression: a basic tool of chemometrics. Chemometrics and Intelligent Laboratory Systems, 2001, 58(2): 109–130
https://doi.org/10.1016/S0169-7439(01)00155-1
|
| 12 |
Cai C B, Yang H W, Wang B, Tao Y Y, Wen M Q, Xu L. Using near-infrared process analysis to study gas–solid adsorption process as well as its data treatment based on artificial neural network and partial least squares. Vibrational Spectroscopy, 2011, 56(2): 202–209
https://doi.org/10.1016/j.vibspec.2011.02.009
|
| 13 |
Laib J P, Mittleman D M. Temperature-dependent terahertz spectroscopy of liquid n-alkanes. Journal of Infrared, Millimeter, and Terahertz Waves, 2010, 31(9): 1015–1021
https://doi.org/10.1007/s10762-010-9678-0
|
| 14 |
Hua Y F, Zhang H J. Qualitative and quantitative detection of pesticides with terahertz time-domain spectroscopy. IEEE Transactions on Microwave Theory and Techniques, 2010, 58(7): 2064–2070
https://doi.org/10.1109/TMTT.2010.2050184
|
| 15 |
Hua Y F, Zhang H J, Zhou H L. Quantitative determination of cyfluthrin in n-hexane by terahertz time-domain spectroscopy with chemometrics methods. IEEE Transactions on Instrumentation and Measurement, 2010, 59(5): 1414–1423
https://doi.org/10.1109/TIM.2010.2041020
|
| 16 |
Wu H Q, Heilweil E J, Hussain A S, Khan M A. Process analytical technology (PAT): quantification approaches in terahertz spectroscopy for pharmaceutical application. Journal of Pharmaceutical Sciences, 2008, 97(2): 970–984
https://doi.org/10.1002/jps.21004
pmid: 17722101
|
|
Viewed |
|
|
|
Full text
|
|
|
|
|
Abstract
|
|
|
|
|
Cited |
|
|
|
|
| |
Shared |
|
|
|
|
| |
Discussed |
|
|
|
|