|
|
|
A simplified index to assess the combined impact of tropical cyclone precipitation and wind on China |
Peiyan CHEN1,2( ), Hui YU1,3, Ming XU1, Xiaotu LEI4, Feng ZENG2,5 ), Hui YU1,3, Ming XU1, Xiaotu LEI4, Feng ZENG2,5 |
1. Shanghai Typhoon Institute, China Meteotological Administration, Shanghai 200030, China
2. The Joint Laboratory for Typhoon Forecasting Technique Applications between Shanghai Typhoon Institute and Wenzhou Meteorological Bureau, Wenzhou 325000, China
3. Key Laboratory of Numerical Modeling for Tropical Cyclone, China Meteotological Administration, Shanghai 200030, China
4. Shanghai Meteorological Service, Shanghai 200030, China
5. Wenzhou Meteorological Bureau, Wenzhou 325000, China |
|
|
|
|
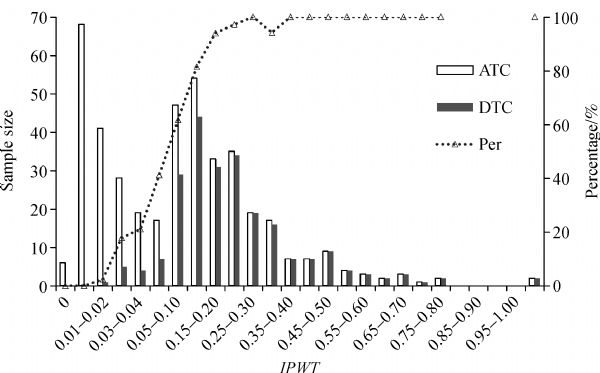
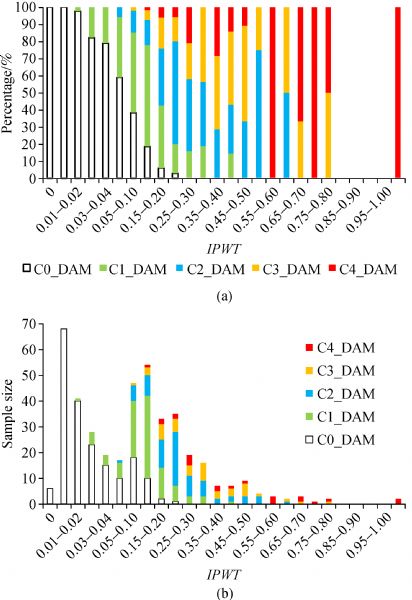
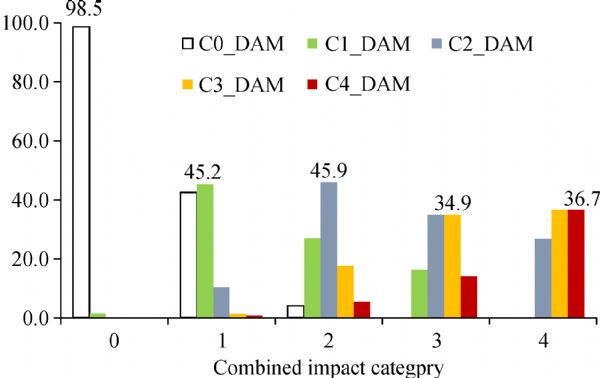
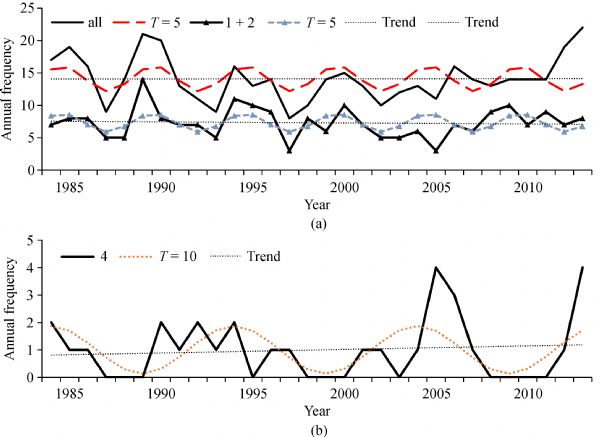
Abstract Relationships between tropical cyclone (TC) precipitation, wind, and storm damage are analyzed for China based on TCs over the period from 1984 to 2013. The analysis shows that the maximum daily areal precipitation from stations with daily precipitation of ≥50 mm and the sum of wind gusts of ≥13.9 m/s can be used to estimate the main damage caused by TCs, and an index combining the precipitation and wind gust of a TC (IPWT) is defined to assess the severity of the combined impact of precipitation and wind. The correlation coefficient between IPWT and the damage index for affecting TCs is 0.80, which is higher than that for only precipitation or wind. All TCs with precipitation and wind affecting China are divided into five categories, Category 0 to Category 4, based on IPWT, where higher categories refer to higher combined impacts of precipitation and wind. The combined impact category is closely related to damage category and it can be used to estimate the potential damage category in operational work. There are 87.7%, 72.9%, 69.8%, and 73.4% of cases that have the same or one category difference between damage category and combined impact category for Categories 1, 2, 3, and 4, respectively. IPWT and its classification can be used to assess the severity of the TC impact and of combined precipitation and wind conveniently and accurately, and the potential damage caused by TCs. The result will be a good supplementary data for TC intensity, precipitation, wind, and damage. In addition, IPWT can be used as an index to judge the reliability of damage data. Further analysis of the annual frequency of combined precipitation-wind impact categories reveals no significant increasing or decreasing trend in impact over China over the past 30 years.
|
| Keywords
tropical cyclone
impact
precipitation
wind
|
|
Corresponding Author(s):
Peiyan CHEN
|
|
Just Accepted Date: 16 October 2019
Online First Date: 22 November 2019
Issue Date: 30 December 2019
|
|
| 1 |
H Y Chen, H Yu, G J Ye, M Xu, Q Z Yang (2019). Return period and the trend of extreme disastrous rainstorm events in Zhejiang Province. J Trop Meteorol, 25: 192–200
|
| 2 |
P Y Chen, X T Lei, M Ying (2013). Introduction and application of a new comprehensive assessment index for damage caused by tropical cyclones. Trop Cyclone Res Rev, 2: 176–183
|
| 3 |
P Y Chen, Y H Yang, X T Lei, Y Z Qian (2009). Cause analysis and preliminary hazard estimate of typhoon disaster in China. J Nat Disast, 18: 64–73 (in Chinese)
|
| 4 |
D R Easterling, T C Peterson, T R Karl (1996). On the development and use of homogenized climate datasets. J Clim, 9(6): 1429–1434
https://doi.org/10.1175/1520-0442(1996)009<1429:OTDAUO>2.0.CO;2
|
| 5 |
K Emanuel (2005). Increasing destructiveness of tropical cyclones over the past 30 years. Nature, 436(7051): 686–688
https://doi.org/10.1038/nature03906
pmid: 16056221
|
| 6 |
GB/T 19201–2006 (2006). Grade of tropical cyclones. Beijing: Standards Press of China
|
| 7 |
L Kantha (2006). Time to replace the Saffir-Simpson hurricane scale? Eos (Wash DC), 87(1): 3–6
https://doi.org/10.1029/2006EO010003
|
| 8 |
L Kantha (2013). Classification of hurricanes: lessons from Katrina, Ike, Irene, Isaac and Sandy. Ocean Eng, 70: 124–128
https://doi.org/10.1016/j.oceaneng.2013.06.007
|
| 9 |
X T Lei, P Y Chen, Y H Yang, Y Z Qian (2009). Characters and objective assessment of disasters caused by typhoons in China. Acta Meteorol Sin, 67: 875–883 (in Chinese)
|
| 10 |
B Q Liang, Q Fan, J Yang, T M Wang (1999). A fuzzy mathematic evaluation of the disaster by tropical cyclones. J Trop Meteorol, 15: 305–311 (in Chinese)
|
| 11 |
Q W Lin, C J Lu (1987). An analysis on satellite cloud imageries and radar echoes from the tropical depression “8.27”. J Guangxi Meteor: 13–16 (in Chinese)
|
| 12 |
W P Lou, H Y Chen, X F Qiu, Q Y Tang, F Zheng (2012). Assessment of economic losses from tropical cyclone disasters based on PCA-BP. Nat Hazards, 60(3): 819–829
https://doi.org/10.1007/s11069-011-9881-x
|
| 13 |
W F Lu (1995). Assessment and prediction of disastrous losses due to tropical cyclones in Shanghai. J Nat Disast, 4: 40–45 (in Chinese)
|
| 14 |
X Q Lu, H Yu, M Ying, L B Qi (2018a). The effects of station network density on statistical analyses of tropical cyclone precipitation. J Trop Meteorol, 24(4): 421–431
|
| 15 |
Y Lu, F M Ren, W J Zhu (2018b). Risk zoning of typhoon disasters in Zhejiang Province, China. Nat Hazards Earth Syst Sci, 18(11): 2921–2932
https://doi.org/10.5194/nhess-18-2921-2018
|
| 16 |
Q Y Ma, G Y Li, X R Wang, W G Wang, L Y Gao (2008). A fuzzy synthetic evaluation model for typhoon disaster. Meteor Mon, 34: 20–25 (in Chinese)
|
| 17 |
R A Pielke Jr, J Gratz, C W Landsea, D Collins, M A Saunders, R Musulin (2008). Normalized hurricane damage in the United States:1900–2005. Nat Hazards Rev, 9(1): 29–42
https://doi.org/10.1061/(ASCE)1527-6988(2008)9:1(29)
|
| 18 |
M D Powell, T A Reinhold (2007). Tropical cyclone destructive potential by integrated kinetic energy. Bull Am Meteorol Soc, 879(2): 219–221
|
| 19 |
F M Ren, B Gleason, D Easterling (2001). A numerical technique for partitioning cyclone troical precipitation. J Trop Meteorol, 17(3): 308–313 (in Chinese)
|
| 20 |
M Rezapour, T E Baldock (2014). Classification of hurricane hazards: the importance of rainfall. Weather Forecast, 29(6): 1319–1331
https://doi.org/10.1175/WAF-D-14-00014.1
|
| 21 |
STI/CMA (2006). Climatological Atlas for Tropical Cyclones Affecting China (1951–2000). Beijing: Science Press (in Chinese)
|
| 22 |
STI/CMA (2017). Climatological Atlas of Tropical Cyclones over the Western North Pacific (1981–2010). Beijing: Science Press
|
| 23 |
G J Van Oldenborgh, K van der Wiel, A Sebastian, R Singh, J Arrighi, F Otto, K Haustein, S Li, G Vecchi, H Cullen (2017). Attribution of extreme rainfall from Hurricane Harvey, August 2017. Environ Res Lett, 12(12): 124009
https://doi.org/10.1088/1748-9326/aa9ef2
|
| 24 |
Y J Wang, S S Wen, X C Li, F Thomas, B D Su, R Wang, T Jiang (2016). Spatiotemporal distributions of influential tropical cyclones and associated economic losses in China in 1984–2015. Nat Hazards, 84(3): 2009–2030
https://doi.org/10.1007/s11069-016-2531-6
|
| 25 |
H Y Wu, L H Kang, L L Chen, X M Ma (2007). Effect of meteorological observation environment variability on homogeneity of temperature series in Zhiejiang Province. Mater Sci Technol, 35(1): 152–156 (in Chinese)
|
| 26 |
F J Xiao, Y Z Yin, Y Luo, L C Song, D X Ye (2011). Tropical cyclone hazards analysis based on tropical cyclone potential impact index. J Geosci (Prague), 21: 791–800
|
| 27 |
H S Xu, J J Lian, L L Bin, K Xu (2018). Joint distribution of muliple typhoon hazard factors. Scientia Geographica Sinica, 38(12): 2118–2124 (in Chinese)
|
| 28 |
Q Xu, L Wei, Y Jin, Q Y Zhao, J Cao (2015). A dynamically constrained method for determining the vortex centers of tropical cyclones predicted by high-resolution models. J Atmos Sci, 72(1): 88–103
https://doi.org/10.1175/JAS-D-14-0090.1
|
| 29 |
Q Z Yang, M Xu (2010). Preliminary study of the assessment of methods for disaster-inducing risks by TCs using sample events of TCs that affected Shanghai. J Trop Meteorol, 16: 299–304
|
| 30 |
M Ying, W Zhang, H Yu, X Q Lu, J X Feng, Y Fan, Y Zhu, D Chen (2014). An overview of the China Meteorological Administration tropical cyclone database. J Atmos Ocean Technol, 31(2): 287–301
https://doi.org/10.1175/JTECH-D-12-00119.1
|
| 31 |
Q Zhang, L G Wu, Q F Liu (2009). Tropical cyclone damages in China 1983–2006. Bull Am Meteorol Soc, 90(4): 489–496
https://doi.org/10.1175/2008BAMS2631.1
|
| 32 |
Q H Zhang, Q Wei, L S Chen (2010). Impact of landfalling tropical cyclones in mainland China. Sci China Earth Sci, 53(10): 1559–1564 (in Chinese)
https://doi.org/10.1007/s11430-010-4034-8
|
| 33 |
S S Zhao, F M Ren, G Gao, D P Huang (2015). Characteristics of Chinese tropical cyclone disaster in the past 10 years. J Trop Meteorol, 31(03): 424–432 (in Chinese)
|
|
Viewed |
|
|
|
Full text
|
|
|
|
|
Abstract
|
|
|
|
|
Cited |
|
|
|
|
| |
Shared |
|
|
|
|
| |
Discussed |
|
|
|
|