|
|
|
Characteristic and correlation analysis of influent and energy consumption of wastewater treatment plants in Taihu Basin |
Luxi Zou1, Huaibo Li1, Shuo Wang1,2,3( ), Kaikai Zheng1, Yan Wang1, Guocheng Du4, Ji Li1,2() ), Kaikai Zheng1, Yan Wang1, Guocheng Du4, Ji Li1,2() |
1. Jiangsu Key Laboratory of Anaerobic Biotechnology, School of Environment and Civil Engineering, Jiangnan University, Wuxi 214122, China
2. Jiangsu College of Water Treatment Technology and Material Collaborative Innovation Center, Suzhou 215009, China
3. Department of Civil Engineering, Schulich School of Engineering, University of Calgary, Calgary T2N 1N4, Canada
4. Ministry Key Laboratory of Industrial Biotechnology, School of Biotechnology, Jiangnan University, Wuxi 214122, China |
|
|
|
|
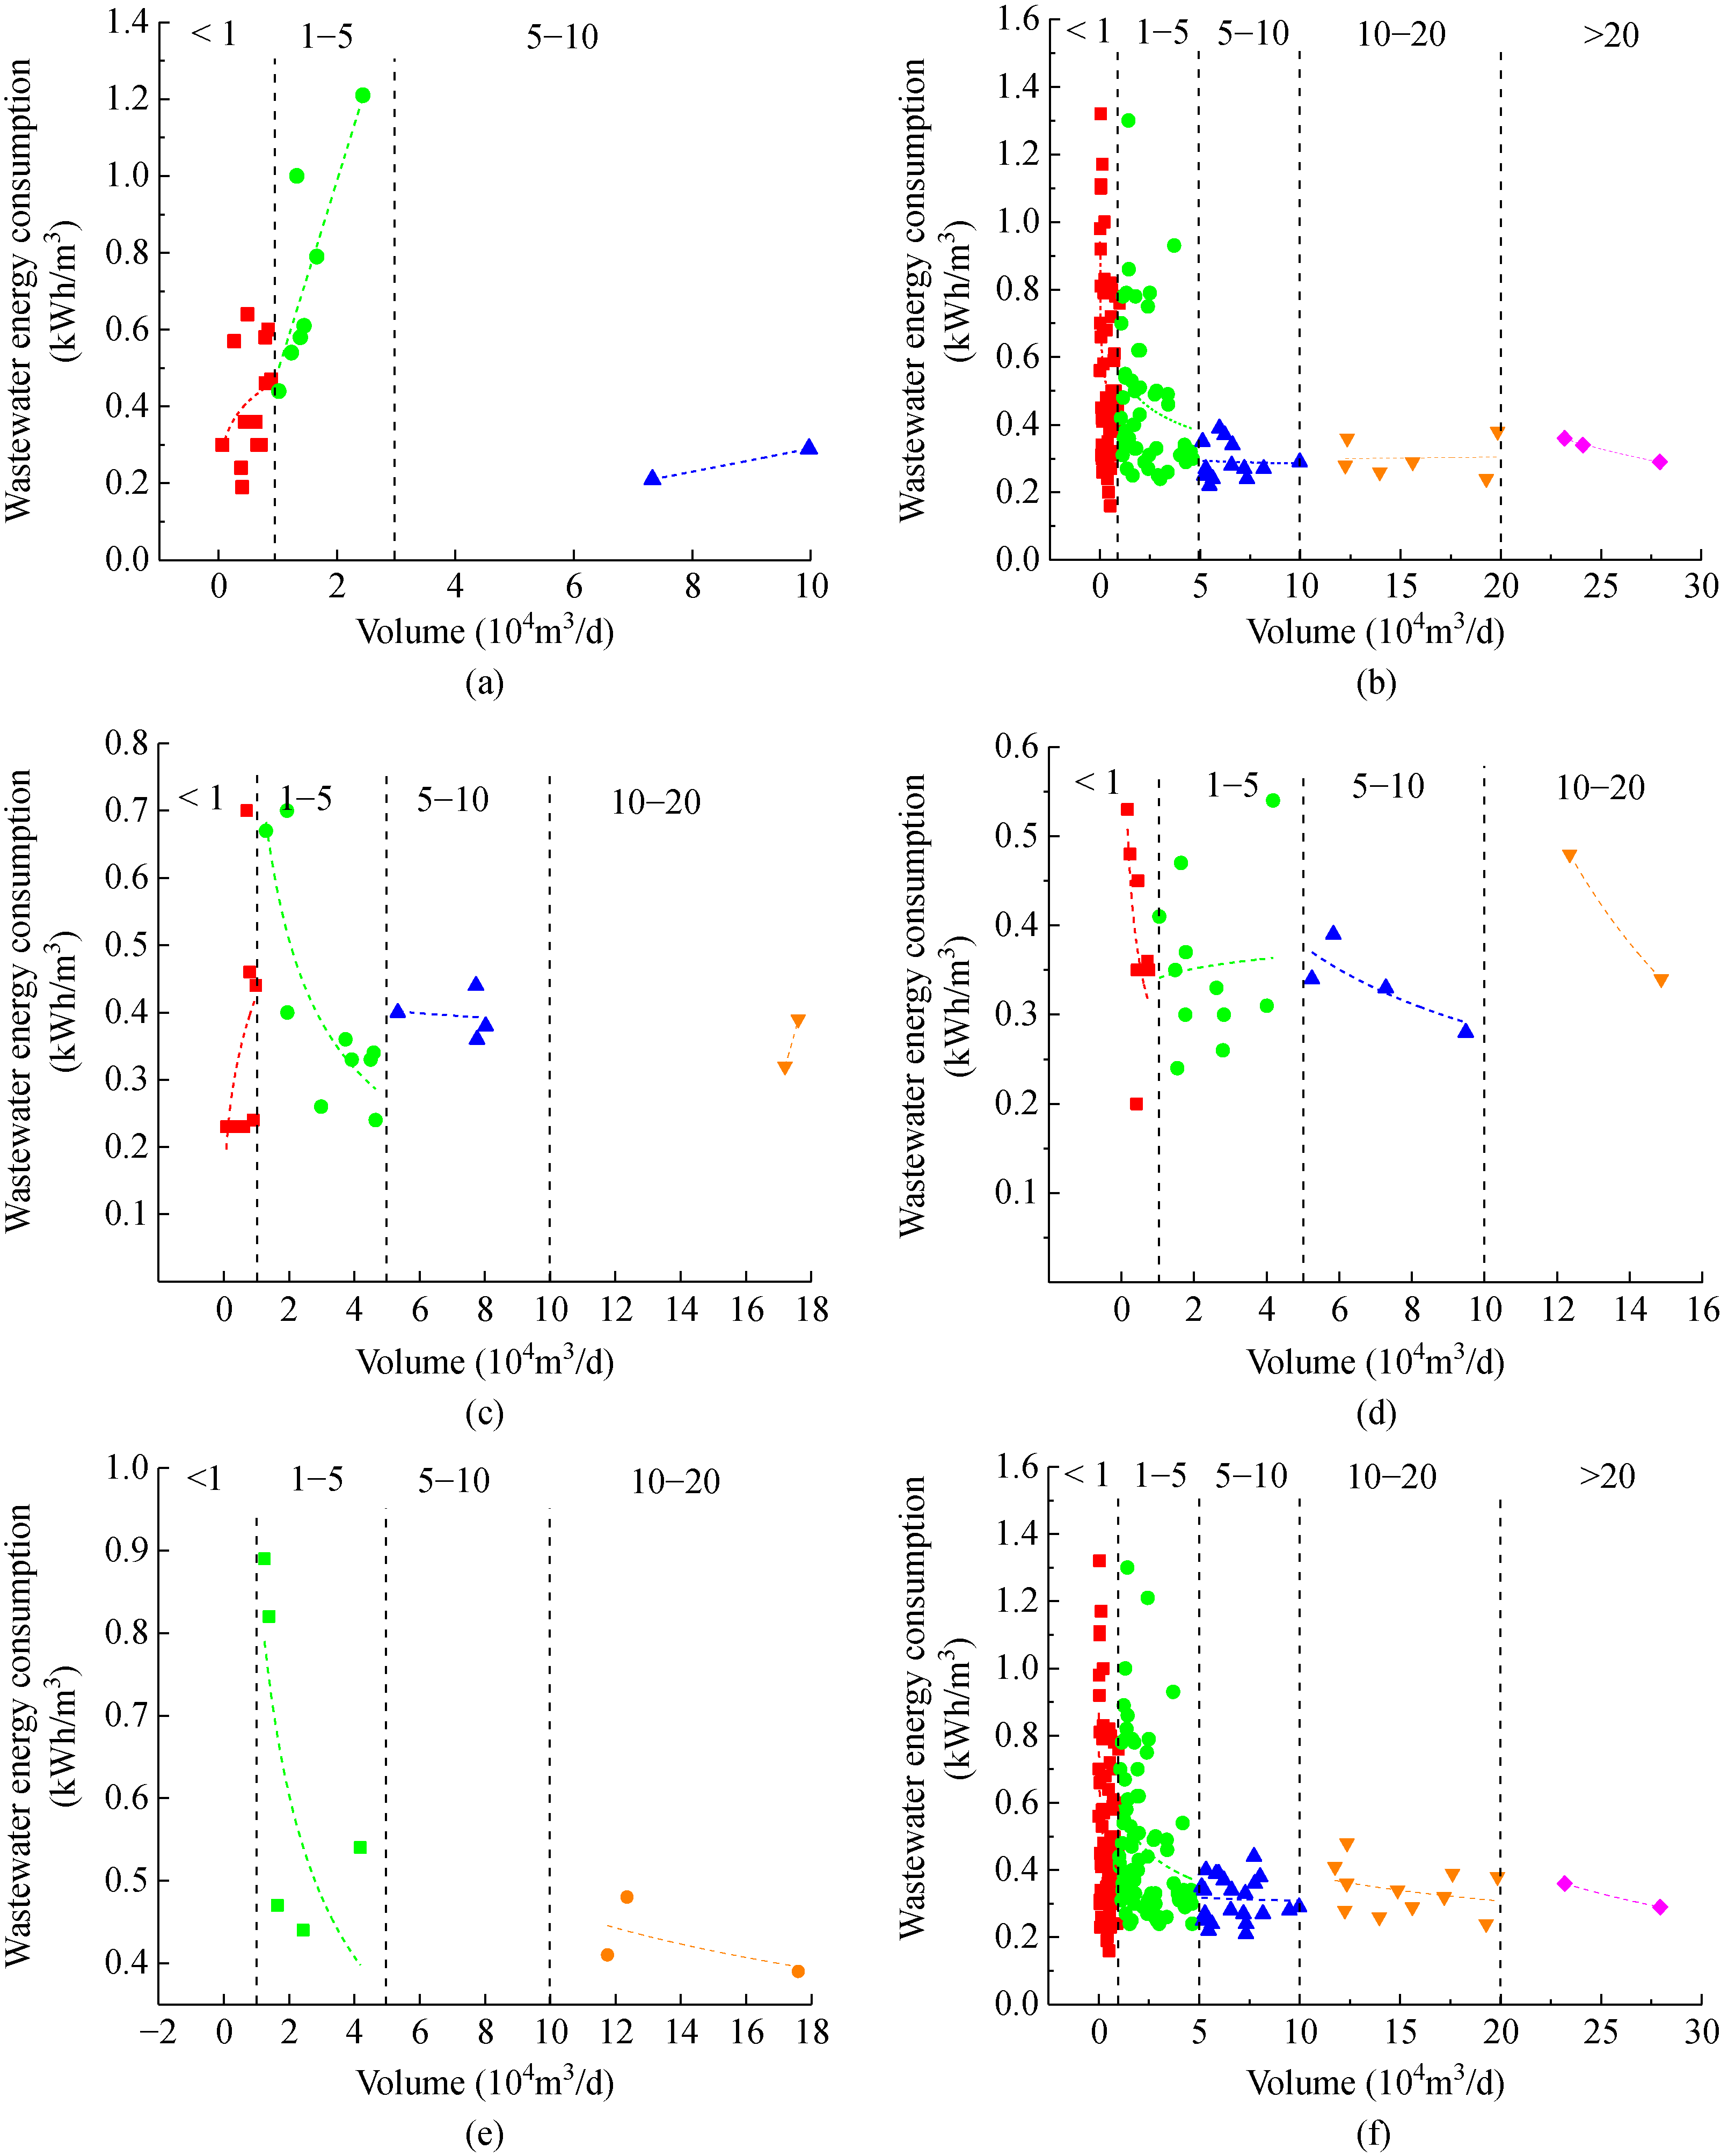
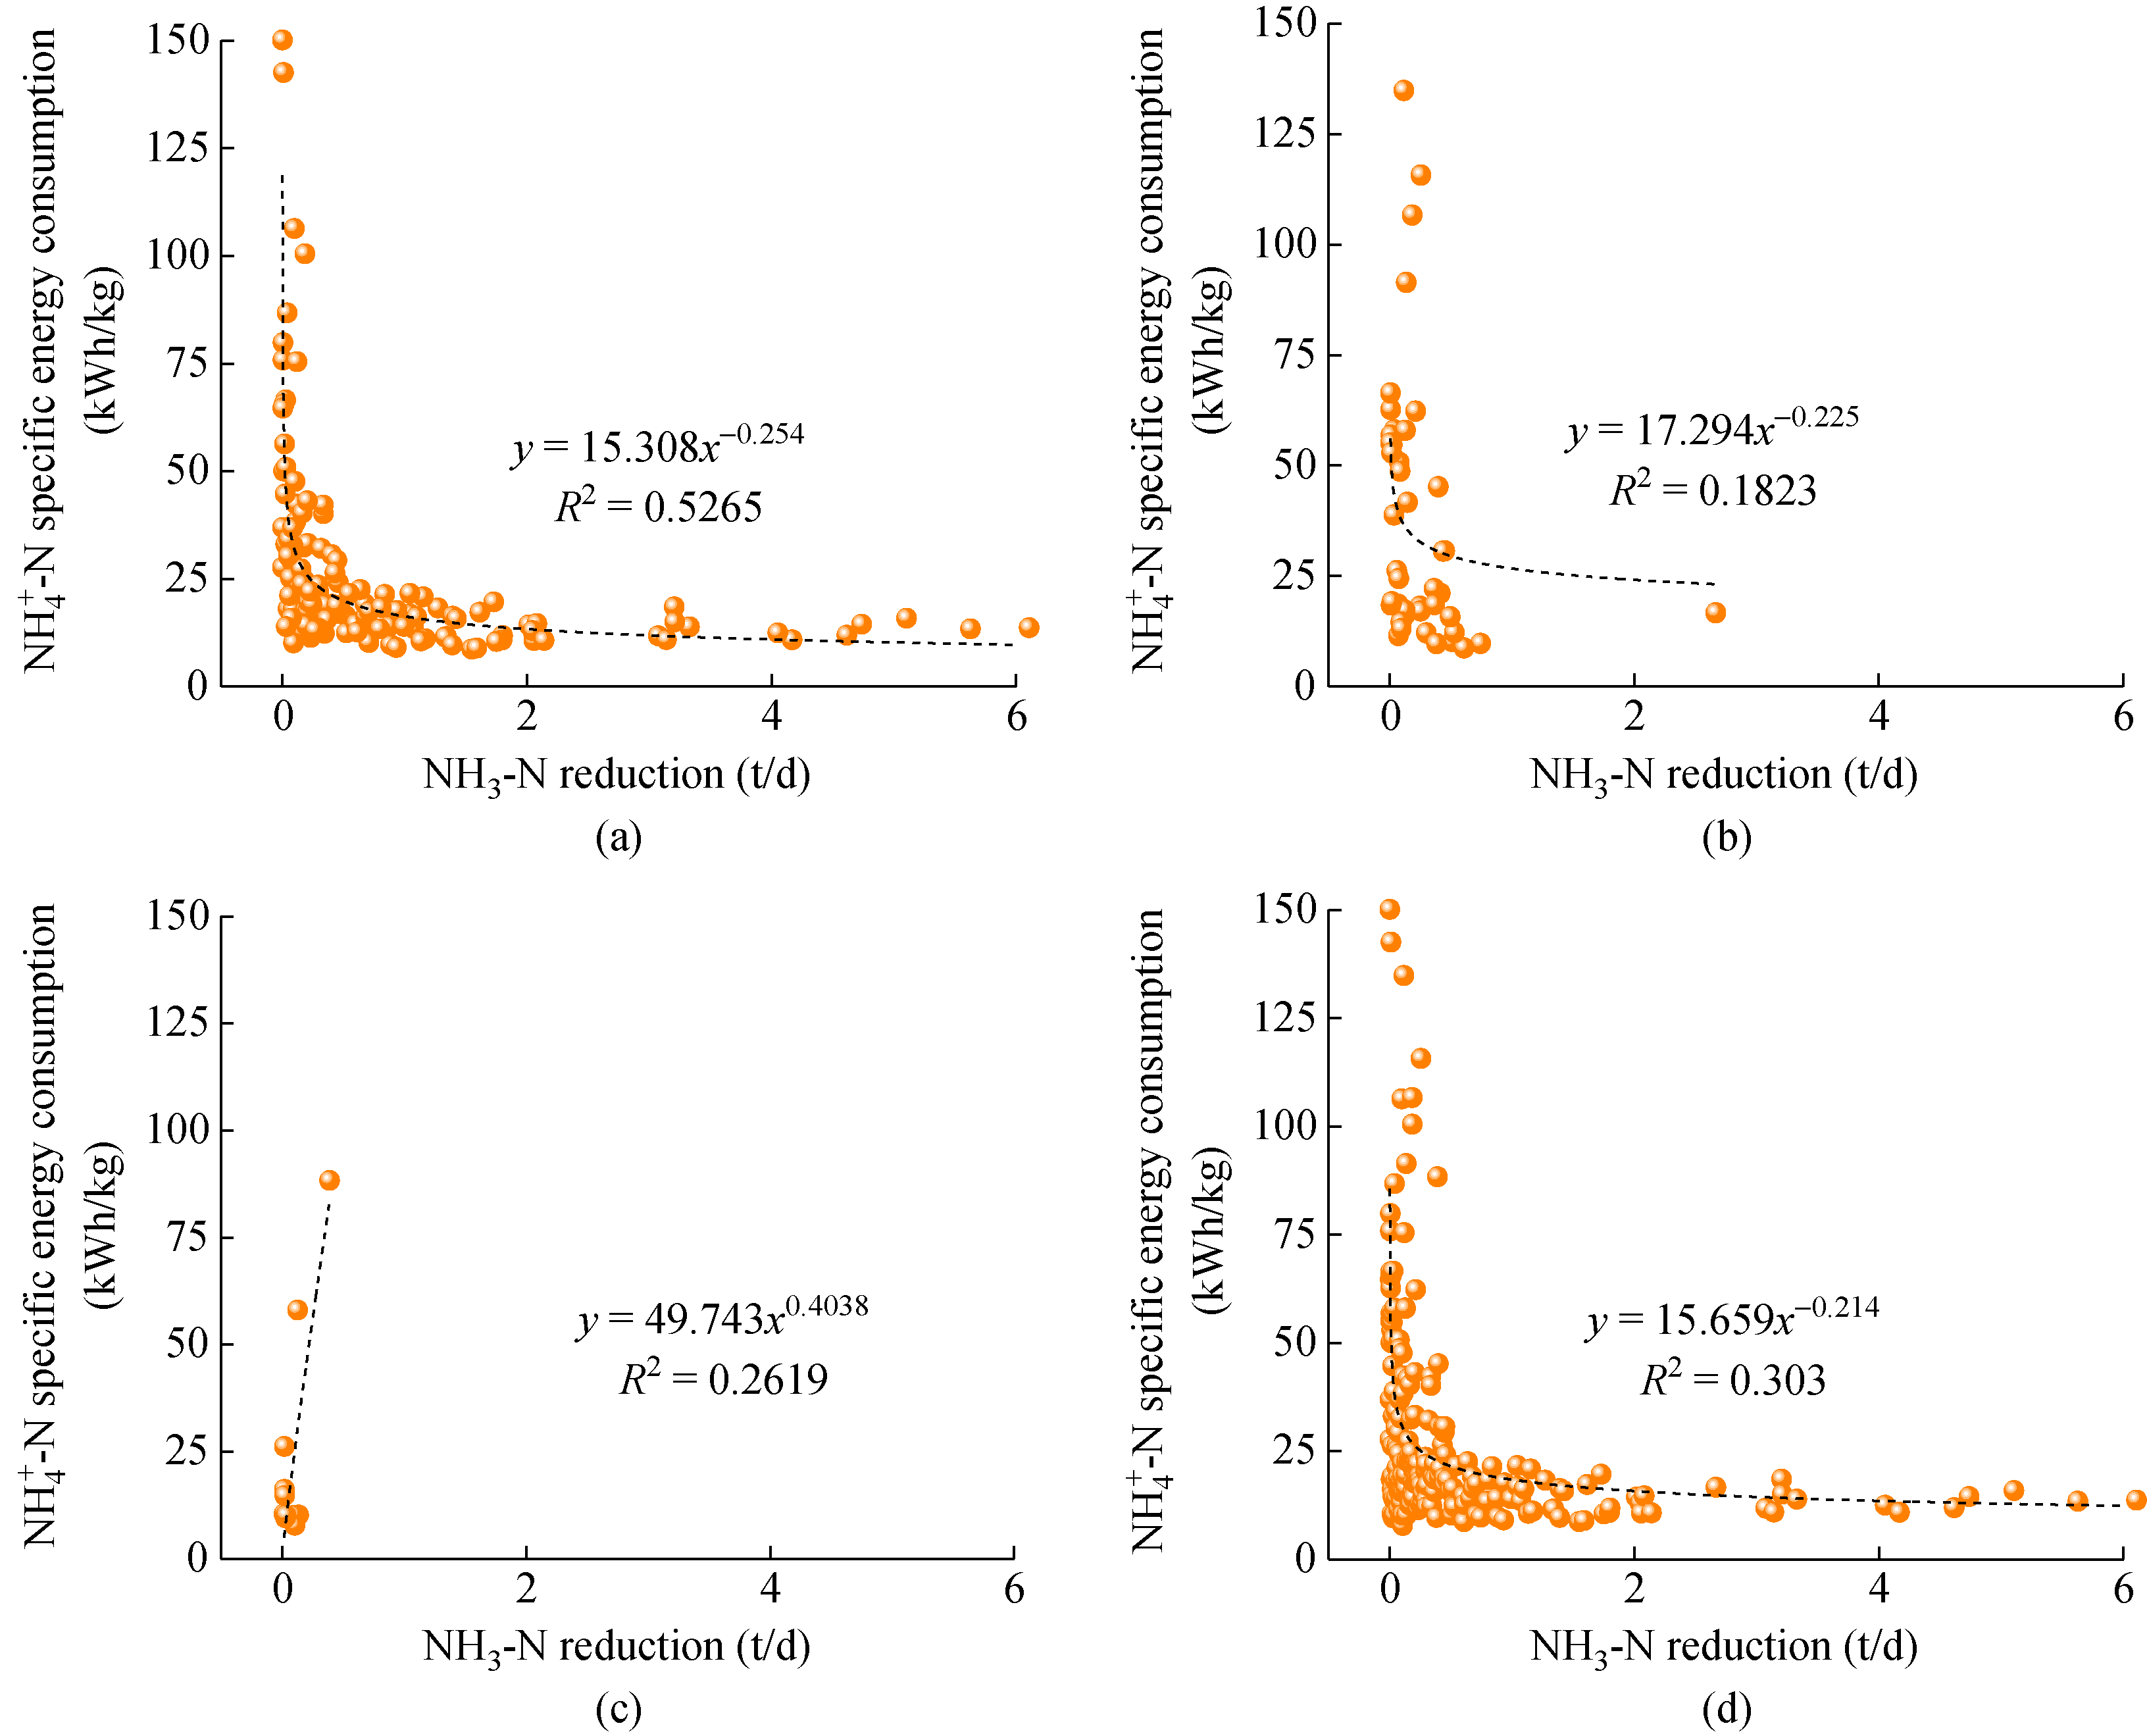
Abstract Poor biodegradability and insufficient carbon source are discovered from influent. Influent indices presented positively normal distribution or skewed distribution. Average energy consumption of WWTPs in Taihu Basin was as high as 0.458 kWh/m3. Energy consumption increases with the increase in influent volume and COD reduction. The total energy consumption decreases with the NH3-N reduction.
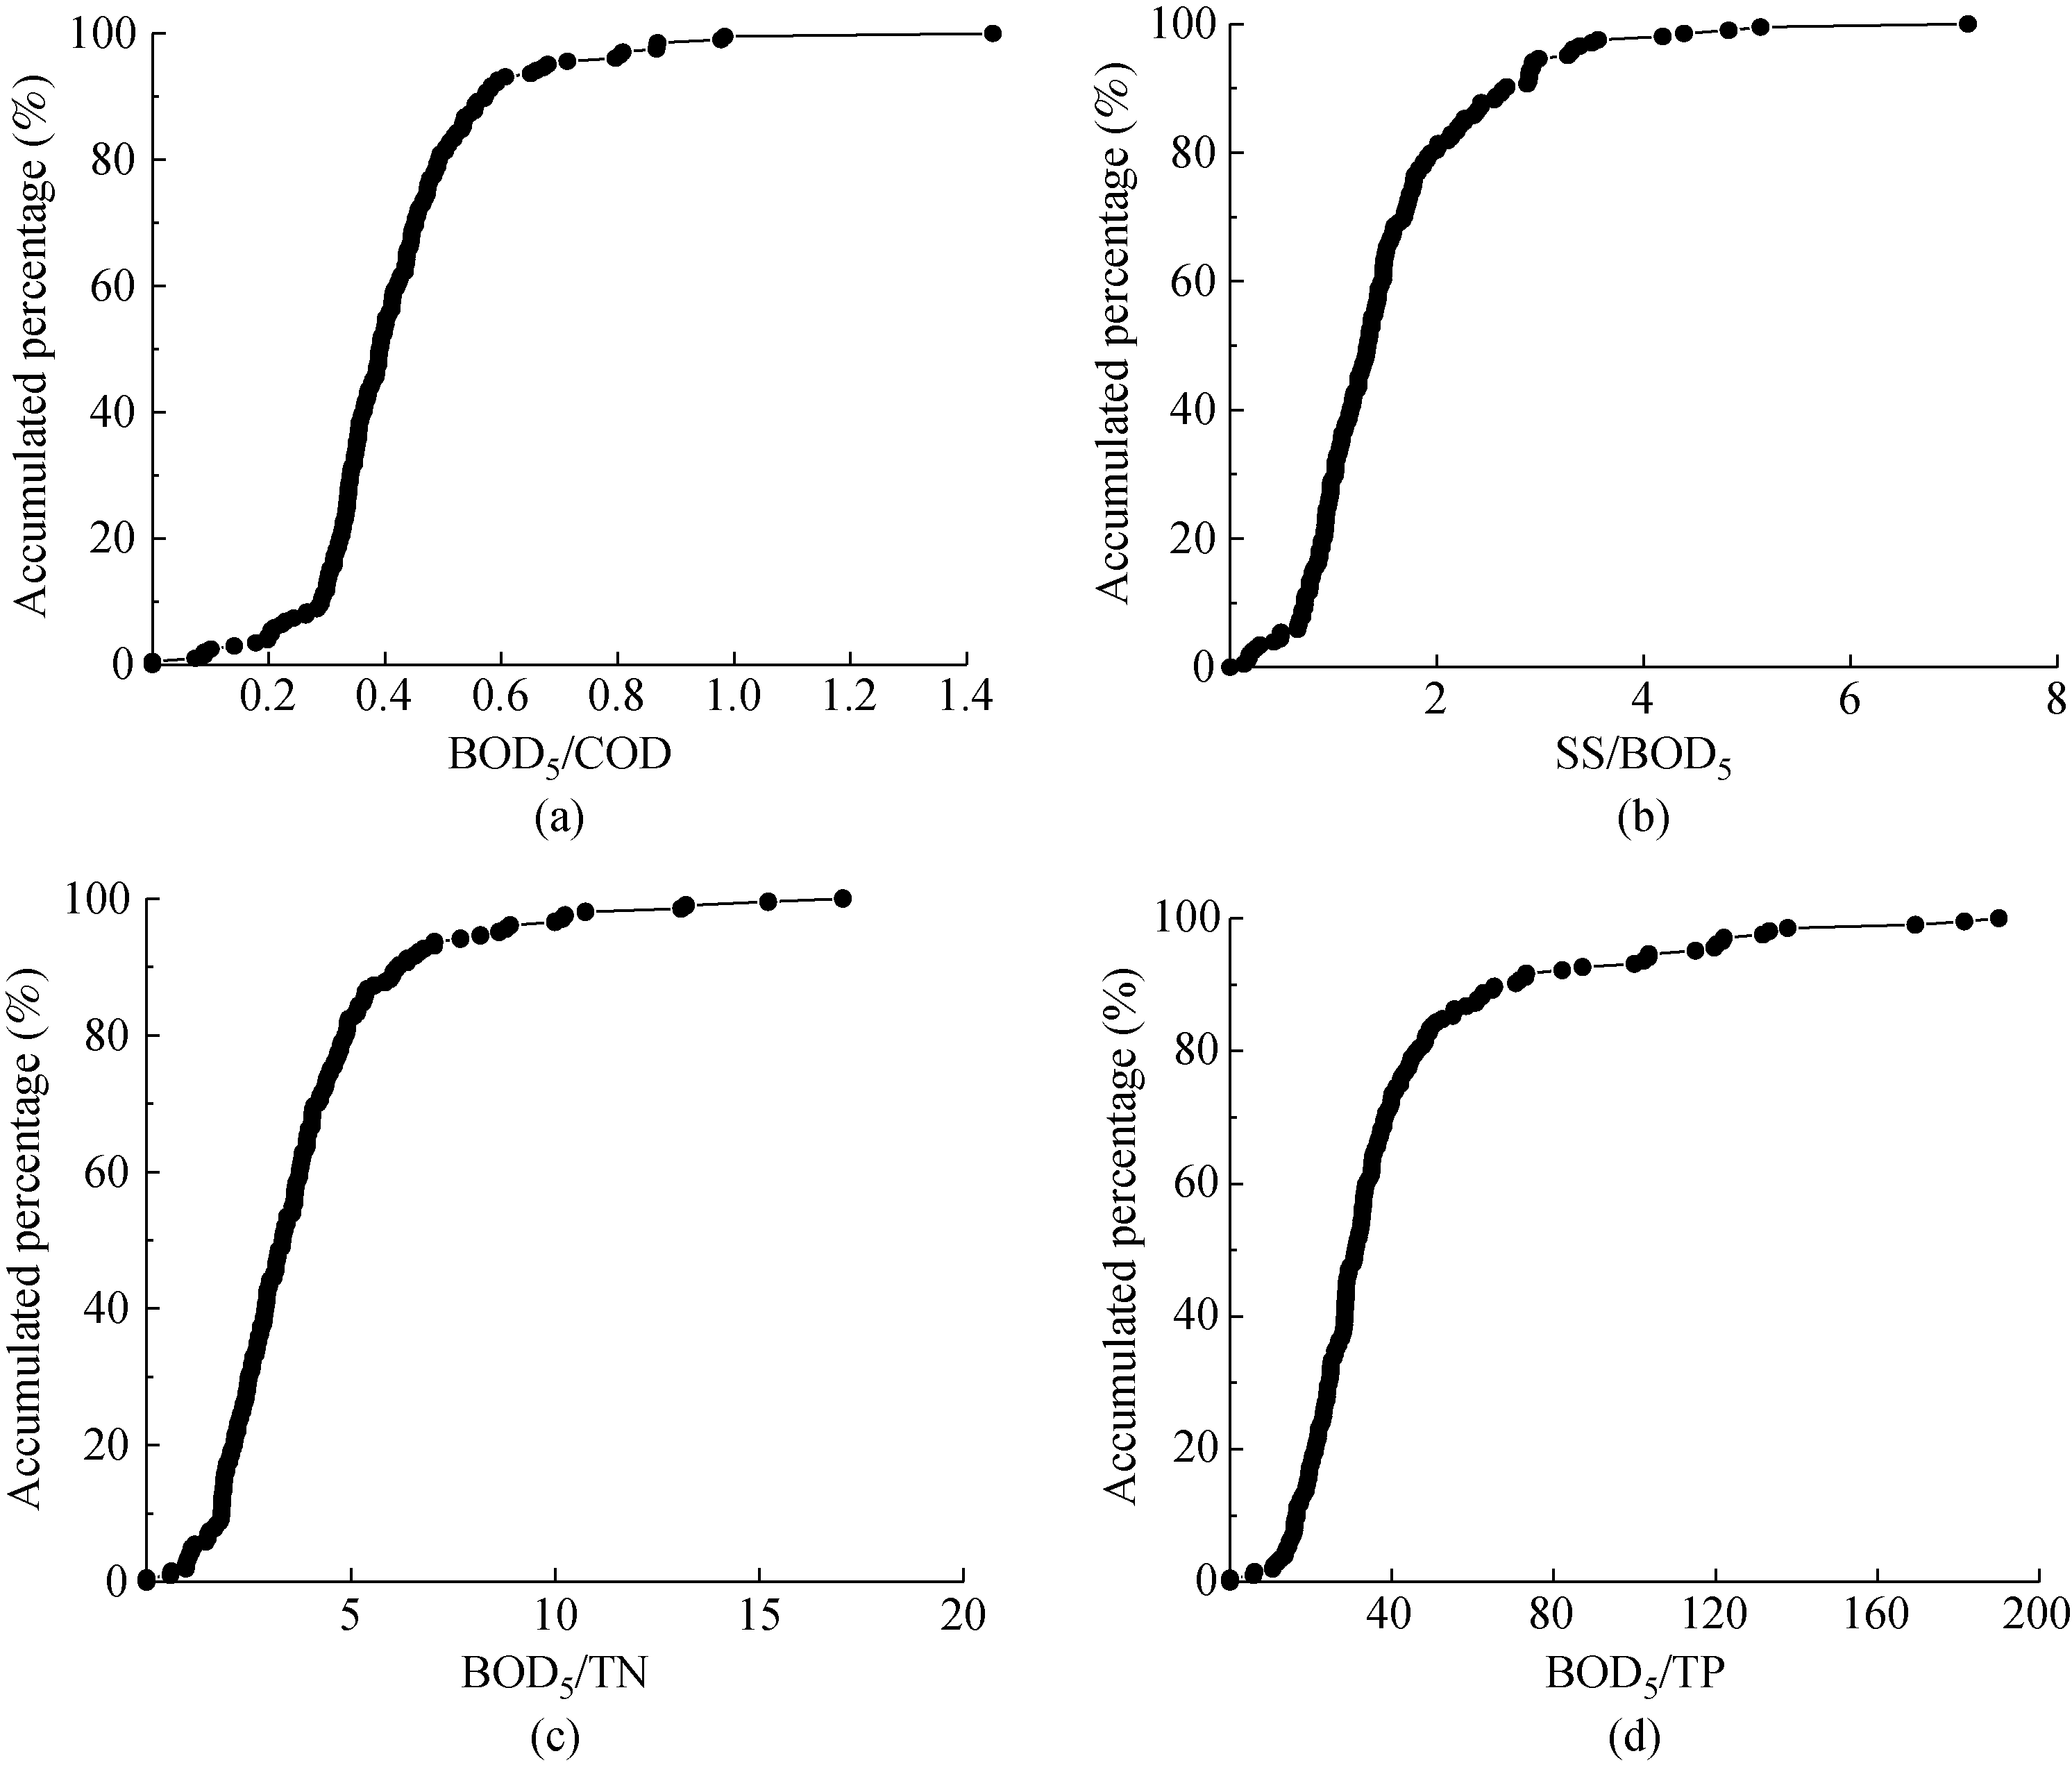
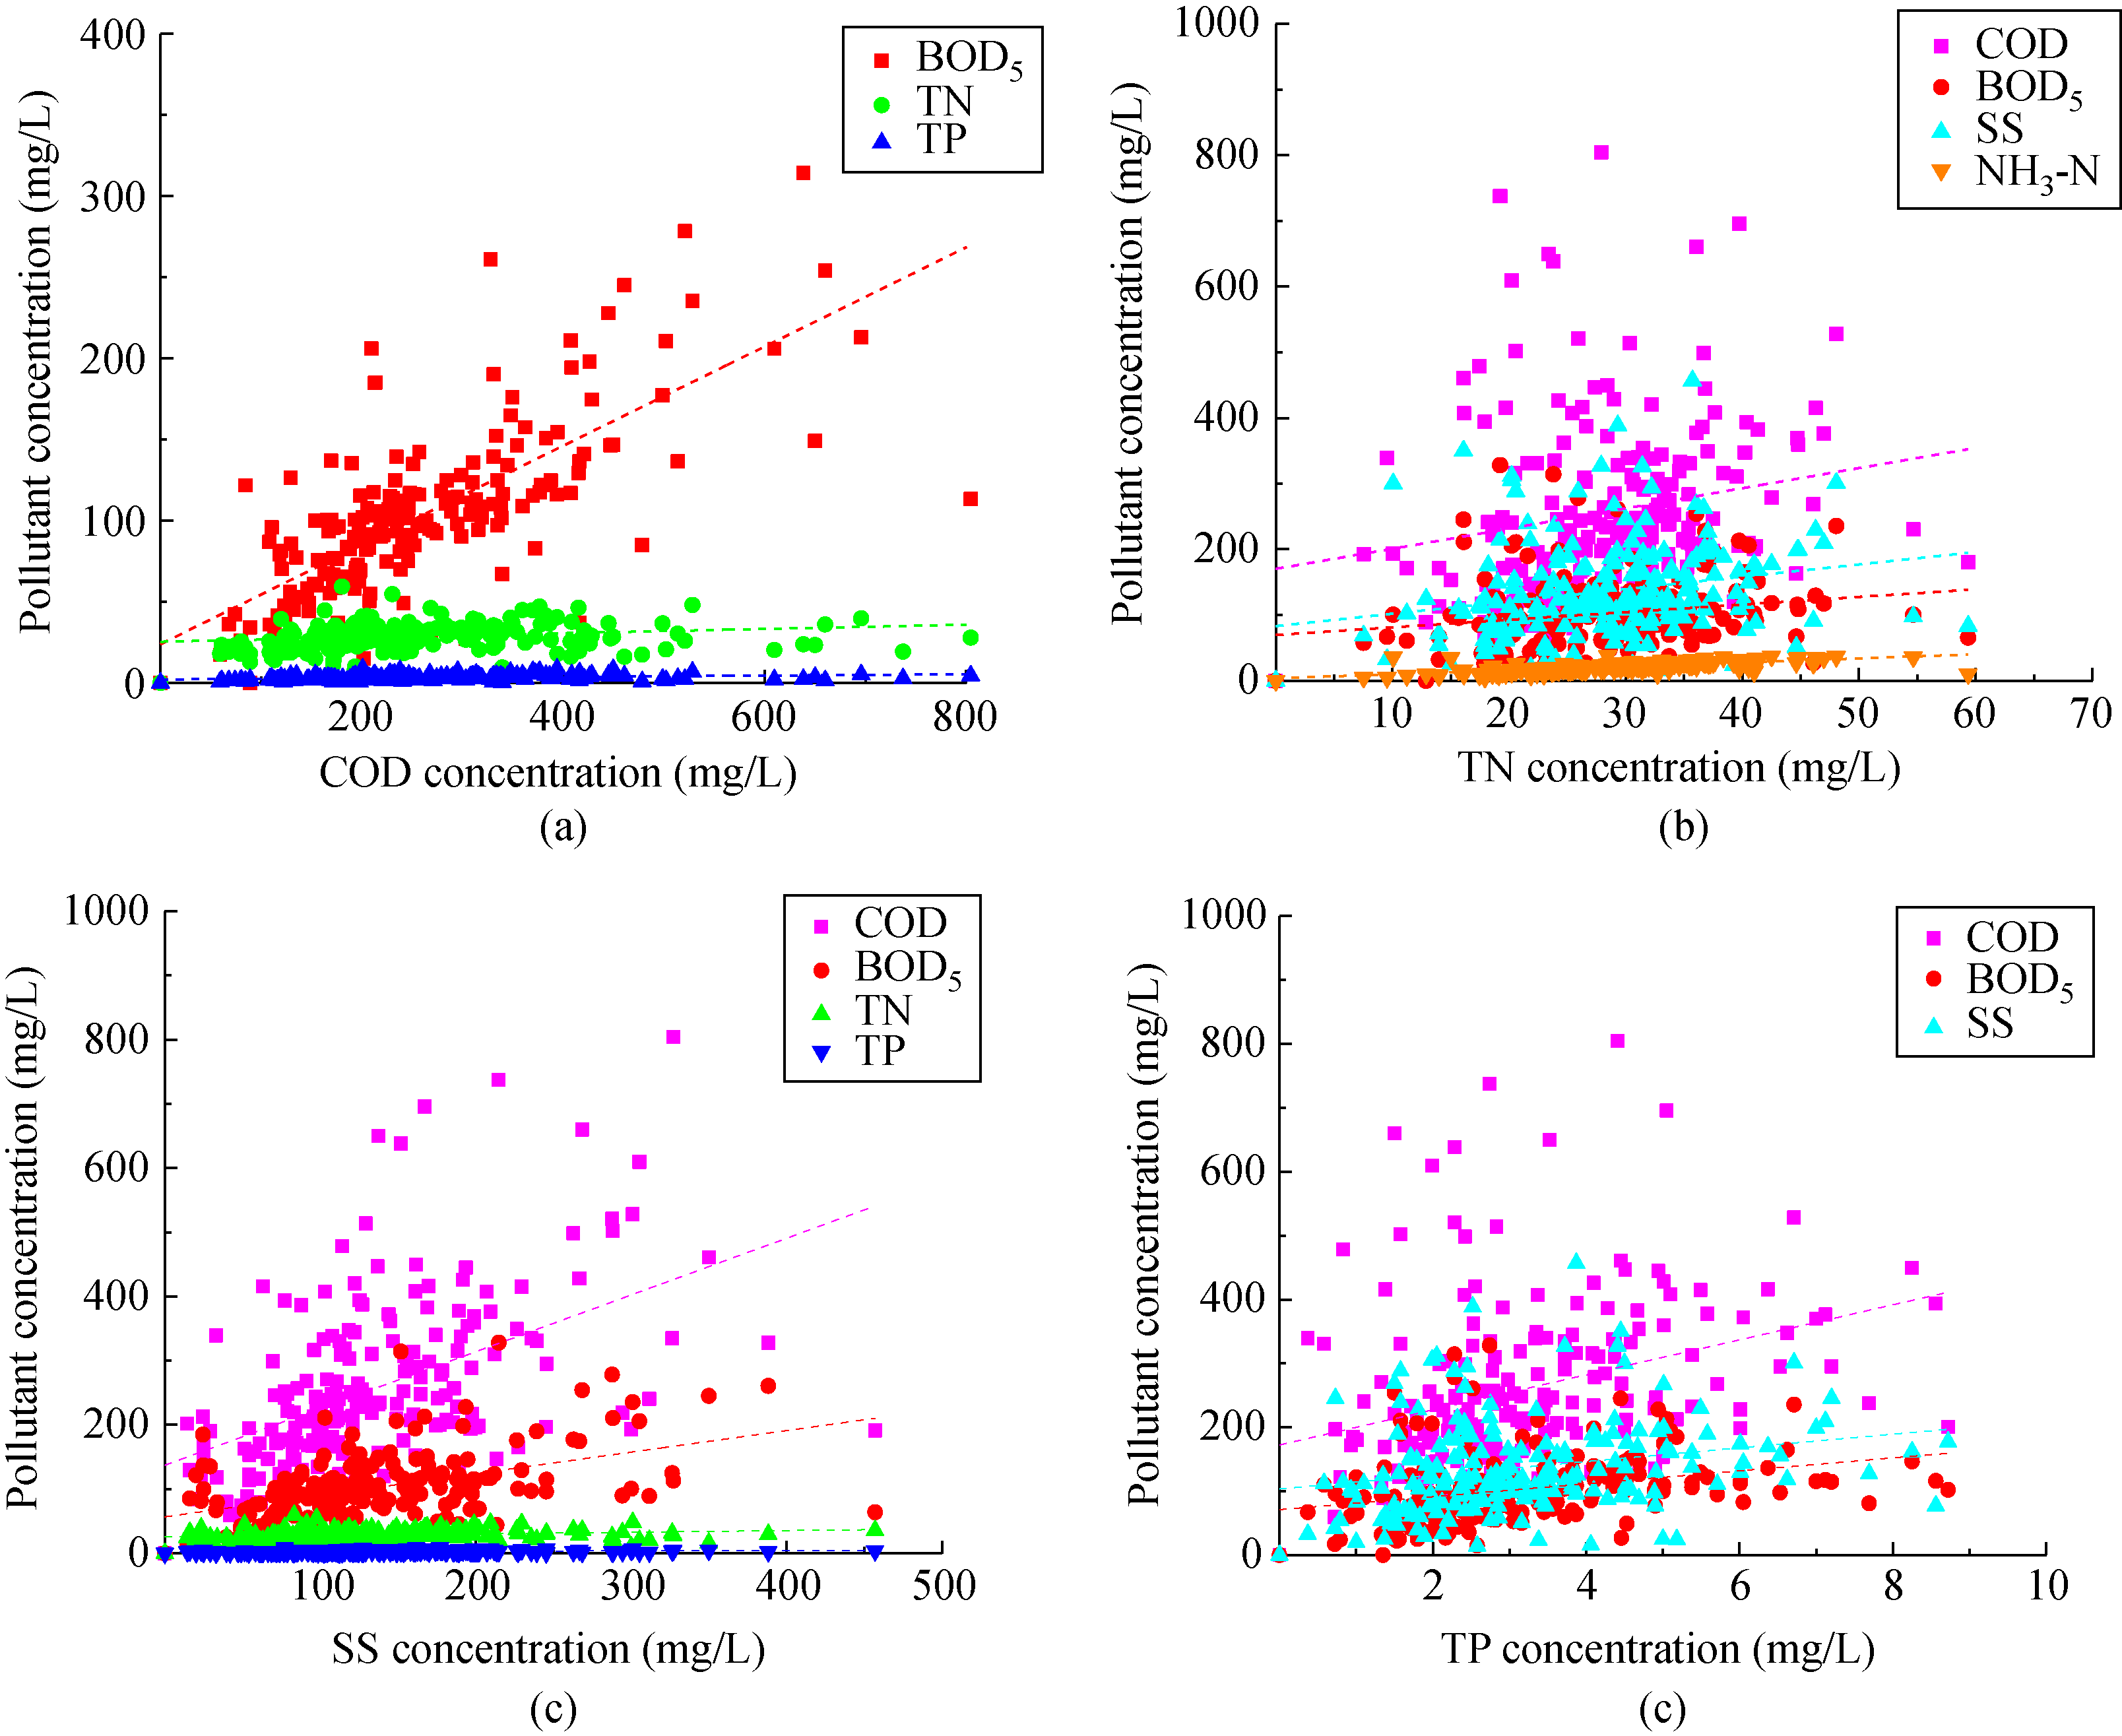
![]() The water quality and energy consumption of wastewater treatment plants (WWTPs) in Taihu Basin were evaluated on the basis of the operation data from 204 municipal WWTPs in the basin by using various statistical methods. The influent ammonia nitrogen (NH3-N) and total nitrogen (TN) of WWTPs in Taihu Basin showed normal distribution, whereas chemical oxygen demand (COD), biochemical oxygen demand (BOD5), suspended solid (SS), and total phosphorus (TP) showed positively skewed distribution. The influent BOD5/COD was 0.4%–0.6%, only 39.2% SS/BOD5 exceeded the standard by 36.3%, the average BOD5/TN was 3.82, and the probability of influent BOD5/TP>20 was 82.8%. The average energy consumption of WWTPs in Taihu Basin in 2017 was 0.458 kWh/m3. The specific energy consumption of WWTPs with a daily treatment capacity of more than 5 × 10⁴ m3 in Taihu Basin was stable at 0.33 kWh/m3. A power function relationship was observed between the reduction in COD and NH3-N and the specific energy consumption of pollutant reduction, and the higher the pollutant reduction is, the lower the specific energy consumption of pollutant reduction presents. In addition, a linear relationship existed between the energy consumption of WWTPs and the specific energy consumption of influent volume and pollutant reduction. Therefore, upgrading and operation with less energy consumption of WWTPs is imperative and the suggestions for Taihu WWTPs based on stringent discharge standard are proposed in detail.
|
| Keywords
Taihu Basin
Wastewater treatment plant
Influent characteristics
Energy consumption evaluation
Specific energy consumption
SPSS correlation analysis
|
|
Corresponding Author(s):
Shuo Wang,Ji Li
|
|
Issue Date: 31 October 2019
|
|
| 1 |
J P Boltz, E Morgenroth, G T Daigger, C deBarbadillo, S Murthy, K H Sørensen, B Stinson (2012). Method to identify potential phosphorus rate-limiting conditions in post-denitrification biofilm reactors within systems designed for simultaneous low-level effluent nitrogen and phosphorus concentrations. Water Research, 46(19): 6228–6238
https://doi.org/10.1016/j.watres.2012.08.020
pmid: 23058109
|
| 2 |
L Bravo, I Ferrer (2011). Life cycle assessment of an intensive WWTPs in Barcelona (Spain) with focus on energy aspects. Water Science and Technology, 64(2): 440–447
https://doi.org/10.2166/wst.2011.522
pmid: 22097019
|
| 3 |
S Bru, B Samper-Martín, E Quandt, S Hernández-Ortega, J M Martínez-Laínez, E Garí, M Rafel, J Torres-Torronteras, R Martí, M P C Ribeiro, J Jiménez, J Clotet (2017). Polyphosphate is a key factor for cell survival after DNA damage in eukaryotic cells. DNA Repair, 57: 171–178
https://doi.org/10.1016/j.dnarep.2017.08.001
pmid: 28822913
|
| 4 |
D Caniani, G Esposito, R Gori, G Mannina (2015). Towards a new decision support system for design, management and operation of WWTPs for the reduction of greenhouse gases emission. Water, 7(10): 5599–5616
https://doi.org/10.3390/w7105599
|
| 5 |
L Cheng, X Li, X Lin, L Hou, M Liu, Y Li, S Liu, X Hu (2016). Dissimilatory nitrate reduction processes in sediments of urban river networks: Spatiotemporal variations and environmental implications. Environmental Pollution, 219: 545–554
https://doi.org/10.1016/j.envpol.2016.05.093
pmid: 27352764
|
| 6 |
W Dąbrowski, R Żyłka, P Malinowski (2017). Evaluation of energy consumption during aerobic wastewater sludge treatment in dairy WWTPs. Environmental Research, 153: 135–139
https://doi.org/10.1016/j.envres.2016.12.001
pmid: 27951462
|
| 7 |
A Ding, F S Qu, H Liang, J Ma, Z S Han, H R Yu, S D Guo, G B Li (2013). A novel integrated vertical membrane bioreactor (IVMBR) for removal of nitrogen from synthetic wastewater/domestic sewage. Chemical Engineering Journal, 223(3): 908–914
https://doi.org/10.1016/j.cej.2013.01.096
|
| 8 |
S Z Ding, P Bao, W Bo, Q Zhang, Y Z Peng (2018). Long-term stable simultaneous partial nitrification, anammox and denitrification (SNAD) process treating real domestic sewage using suspended activated sludge. Chemical Engineering Journal, 339: 180–188
https://doi.org/10.1016/j.cej.2018.01.128
|
| 9 |
H Gao, Y Mao, X Zhao, W T Liu, T Zhang, G Wells (2019). Genome-centric metagenomics resolves microbial diversity and prevalent truncated denitrification pathways in a denitrifying PAO-enriched bioprocess. Water Research, 155: 275–287
https://doi.org/10.1016/j.watres.2019.02.020
pmid: 30852315
|
| 10 |
B Guner, M T Frankford, J T Johnson (2009). A study of the Shapiro-Wilk Test for the detection of pulsed sinusoidal radio frequency interference. IEEE Transactions on Geoscience and Remote Sensing, 47(6): 1745–1751
https://doi.org/10.1109/TGRS.2008.2006906
|
| 11 |
K Hae-Young (2013). Statistical notes for clinical researchers: Assessing normal distribution (2) using skewness and kurtosis. Restorative Dentistry and Endodontics, 38(1): 52–54
https://doi.org/10.5395/rde.2013.38.1.52
pmid: 23495371
|
| 12 |
X Hao, J Li, M C M van Loosdrecht, T Li (2018). A sustainability-based evaluation of membrane bioreactors over conventional activated sludge processes. Journal of Environmental Chemical Engineering, 6(2): 2597–2605
https://doi.org/10.1016/j.jece.2018.03.050
|
| 13 |
D N Joanes, C A Gill (1998). Comparing measures of sample skewness and kurtosis. Journal of the Royal Statistical Society, 47(1): 183–189
https://doi.org/10.1111/1467-9884.00122
|
| 14 |
Z Liao, T Hu, S A Roker (2015). An obstacle to China’s WWTPs: The COD and BOD standards for discharge into municipal sewers. Environmental Science and Pollution Research, 22(21): 16434–16440
https://doi.org/10.1007/s11356-015-5307-8
pmid: 26341334
|
| 15 |
C M López-Vázquez, C M Hooijmans, D Brdjanovic, H J Gijzen, M C M van Loosdrecht (2008). Factors affecting the microbial populations at full-scale enhanced biological phosphorus removal (EBPR) wastewater treatment plants in The Netherlands. Water Research, 42(10–11): 2349–2360
https://doi.org/10.1016/j.watres.2008.01.001
pmid: 18272198
|
| 16 |
J Y Lu, X M Wang, H Q Liu, H Q Yu, W W Li (2019). Optimizing operation of municipal wastewater treatment plants in China: The remaining barriers and future implications. Environment International, 129: 273–278
https://doi.org/10.1016/j.envint.2019.05.057
pmid: 31146161
|
| 17 |
T Miyoshi, T P Nguyen, T Tsumuraya, H Tanaka, T Morita, H Itokawa, T Hashimoto (2018). Energy reduction of a submerged membrane bioreactor using a polytetrafluoroethylene (PTFE) hollow-fiber membrane. Frontiers of Environmental Science & Engineering, 2018, 12(3): 1
https://doi.org/10.1007/s11783-018-1018-y
|
| 18 |
K Mizuta, M Shimada (2010). Benchmarking energy consumption in municipal WWTPs in Japan. Water Science and Technology, 62(10): 2256–2262
https://doi.org/10.2166/wst.2010.510
pmid: 21076210
|
| 19 |
W E G Müller, S Wang, M Neufurth, M Kokkinopoulou, Q Feng, H C Schröder, X Wang (2017). Polyphosphate as a donor of high-energy phosphate for the synthesis of ADP and ATP. Journal of Cell Science, 130(16): 2747–2756
https://doi.org/10.1242/jcs.204941
pmid: 28687622
|
| 20 |
R L Olsen, R W Chappell, J C Loftis (2012). Water quality sample collection, data treatment and Watershed case study. Water Research, 46(9): 3110–3122
https://doi.org/10.1016/j.watres.2012.03.028
pmid: 22487543
|
| 21 |
X Quan, K Huang, M Li, M C Lan, B A Li (2018). Nitrogen removal performance of municipal reverse osmosis concentrate with low C/N ratio by membrane-aerated biofilm reactor. Frontiers of Environmental Science & Engineering, 12(6): 5
https://doi.org/10.1007/s11783-018-1047-6
|
| 22 |
G Samudro, S Mangkoedihardjo (2010). Review on BOD, COD and BOD/COD ratio: A triangle zone for toxic, biodegradable and stable levels. International Journal of Academic Research, 2(4): 235–239
|
| 23 |
S Sid, A Volant, G Lesage, M Heran (2017). Cost minimization in a full-scale conventional WWTPs: Associated costs of biological energy consumption versus sludge production. Water Science and Technology, 76(9): 2473–2481
https://doi.org/10.2166/wst.2017.423
pmid: 29144305
|
| 24 |
M Spérandio, M A Labelle, A Ramdani, A Gadbois, E Paul, Y Comeau, P L Dold (2013). Modelling the degradation of endogenous residue and ‘unbiodegradable’ influent organic suspended solids to predict sludge production. Water Science and Technology, 67(4): 789–796
https://doi.org/10.2166/wst.2012.629
pmid: 23306256
|
| 25 |
G Sun, C Zhang, W Li, L Yuan, S He, L Wang (2019). Effect of chemical dose on phosphorus removal and membrane fouling control in a UCT-MBR. Frontiers of Environmental Science & Engineering, 13(1): 1
https://doi.org/10.1007/s11783-019-1085-8
|
| 26 |
J Sun, Q Yang, D Wang, S Wang, F Chen, Y Zhong, K Yi, F Yao, C Jiang, S Li, X Li, G Zeng (2017). Nickel toxicity to the performance and microbial community of enhanced biological phosphorus removal system. Chemical Engineering Journal, 313: 415–423
https://doi.org/10.1016/j.cej.2016.12.078
|
| 27 |
Y X Sun, G X Wu, H Y Hu, Y H Wu, F Guo, M Y Guo (2013). Statistical analysis of the intake water quality characteristics of the WWTPs in the distribution system and drainage area of Kunming City. Journal of Environmental Engineering, 7(8): 2885–2891
|
| 28 |
Y Tang, L L Guo, C Y Hong, Y X Bing, Z C Xu (2017). Seasonal occurrence, removal and risk assessment of 10 pharmaceuticals in two WWTPs of Guangdong, China. Environmental Technology, 40(4): 458–469
https://doi.org/10.1080/09593330.2017.1397758
pmid: 29069966
|
| 29 |
G Venkatesh, H Brattebø (2011a). Analysis of chemicals and energy consumption in water and wastewater treatment, as cost components: Case study of Oslo, Norway. Urban Water Journal, 8(3): 189–202
https://doi.org/10.1080/1573062X.2011.581297
|
| 30 |
G Venkatesh, H Brattebø (2011b). Environmental impact analysis of chemicals and energy consumption in WWTPs: Case study of Oslo, Norway. Water Science and Technology, 63(5): 1018–1031
https://doi.org/10.2166/wst.2011.284
pmid: 21411954
|
| 31 |
J W Wang, T Z Zhang, J N Chen, Z R Hu (2011). Retrofitting conventional primary clarifiers to activated primary clarifiers to enhance nutrient removal and energy conservation in WWTPs in Beijing, China. Water Science and Technology, 63(7): 1446–1452
https://doi.org/10.2166/wst.2011.328
pmid: 21508549
|
| 32 |
S Wang, K Qian, Y Zhu, X Yi, G Zhang, G Du, J H Tay, J Li (2019). Reactivation and pilot-scale application of long-term storage denitrification biofilm based on flow cytometry. Water Research, 148: 368–377
https://doi.org/10.1016/j.watres.2018.10.072
pmid: 30396102
|
| 33 |
J Xia, H P Wang, R L Stanford, G Y Pan, S L Yu (2018). Hydrologic and water quality performance of a laboratory scale bioretention unit. Frontiers of Environmental Science & Engineering, 12(1): 14
https://doi.org/10.1007/s11783-018-1011-5
|
| 34 |
S F Yang, R Zhou, S W Lu (2017). A median loss control chart for monitoring quality loss under skewed distributions. Journal of Statistical Computation and Simulation, 87(17): 3241–3260
https://doi.org/10.1080/00949655.2017.1362697
|
| 35 |
X Q Yin, B Jing, W J Chen, J Zhang, Q Liu, W Chen (2017). Study on COD removal mechanism and reaction kinetics of oilfield wastewater. Water Science and Technology, 76(9–10): 2655–2663
https://doi.org/10.2166/wst.2017.435
pmid: 29168705
|
| 36 |
F Z Zhang, Y Z Peng, L Miao, Z Wang, S Y Wang, B K Li (2017). A novel simultaneous partial nitrification Anammox and denitrification (SNAD) with intermittent aeration for cost-effective nitrogen removal from mature landfill leachate. Chemical Engineering Journal, 313: 619–628
https://doi.org/10.1016/j.cej.2016.12.105
|
| 37 |
Q L Zhang, Y X Chen, G Jilani, I H Shamsi, Q G Yu (2010). Model AVSWAT apropos of simulating non-point source pollution in Taihu lake basin. Journal of Hazardous Materials, 174(1–3): 824–830
https://doi.org/10.1016/j.jhazmat.2009.09.127
pmid: 19853378
|
| 38 |
H Zhao, X Duan, B Stewart, B You, X Jiang (2013). Spatial correlations between urbanization and river water pollution in the heavily polluted area of Taihu Basin, China. Journal of Geographical Sciences, 23(4): 735–752
https://doi.org/10.1007/s11442-013-1041-7
|
| 39 |
J Zhao, X Wang, X Li, S Jia, Y Peng (2018a). Combining partial nitrification and post endogenous denitrification in an EBPR system for deep-level nutrient removal from low carbon/nitrogen (C/N) domestic wastewater. Chemosphere, 210: 19–28
https://doi.org/10.1016/j.chemosphere.2018.06.135
pmid: 29986220
|
| 40 |
W H Zhao, M X Wang, J W Li, Y Huang, B K Li, C Pan, X Y Li, Y Z Peng (2018b). Optimization of denitrifying phosphorus removal in a pre-denitrification anaerobic/anoxic/post-aeration+ nitrification sequence batch reactor (pre-A2NSBR) system: Nitrate recycling, carbon/nitrogen ratio and carbon source type. Frontiers of Environmental Science & Engineering, 2018, 12(5): 8
https://doi.org/10.1007/s11783-018-1084-1
|
| 41 |
T T Zhu, H Y Cheng, L H Yang, S G Su, H C Wang, S S Wang, A J Wang (2019). Coupled sulfur and iron(II) carbonate-driven autotrophic denitrification for significantly enhanced nitrate removal. Environmental Science & Technology, 53(3): 1545–1554
https://doi.org/10.1021/acs.est.8b06865
pmid: 30596484
|
|
Viewed |
|
|
|
Full text
|
|
|
|
|
Abstract
|
|
|
|
|
Cited |
|
|
|
|
| |
Shared |
|
|
|
|
| |
Discussed |
|
|
|
|