Please wait a minute...
Frontiers of Environmental Science & Engineering

ISSN 2095-2201

ISSN 2095-221X(Online)

CN 10-1013/X

Postal Subscription Code 80-973

2018 Impact Factor: 3.883

Front. Environ. Sci. Eng.    2017, Vol. 11 Issue (3) : 1    https://doi.org/10.1007/s11783-017-0915-9
RESEARCH ARTICLE
Field scale measurement of greenhouse gas emissions from land applied swine manure
Devin L. Maurer, Jacek A. Koziel(), Kelsey Bruning
Department of Agricultural and Biosystems Engineering, Iowa State University, Ames, IA 50011, USA
 Download: PDF(814 KB)   HTML
 Export: BibTeX | EndNote | Reference Manager | ProCite | RefWorks
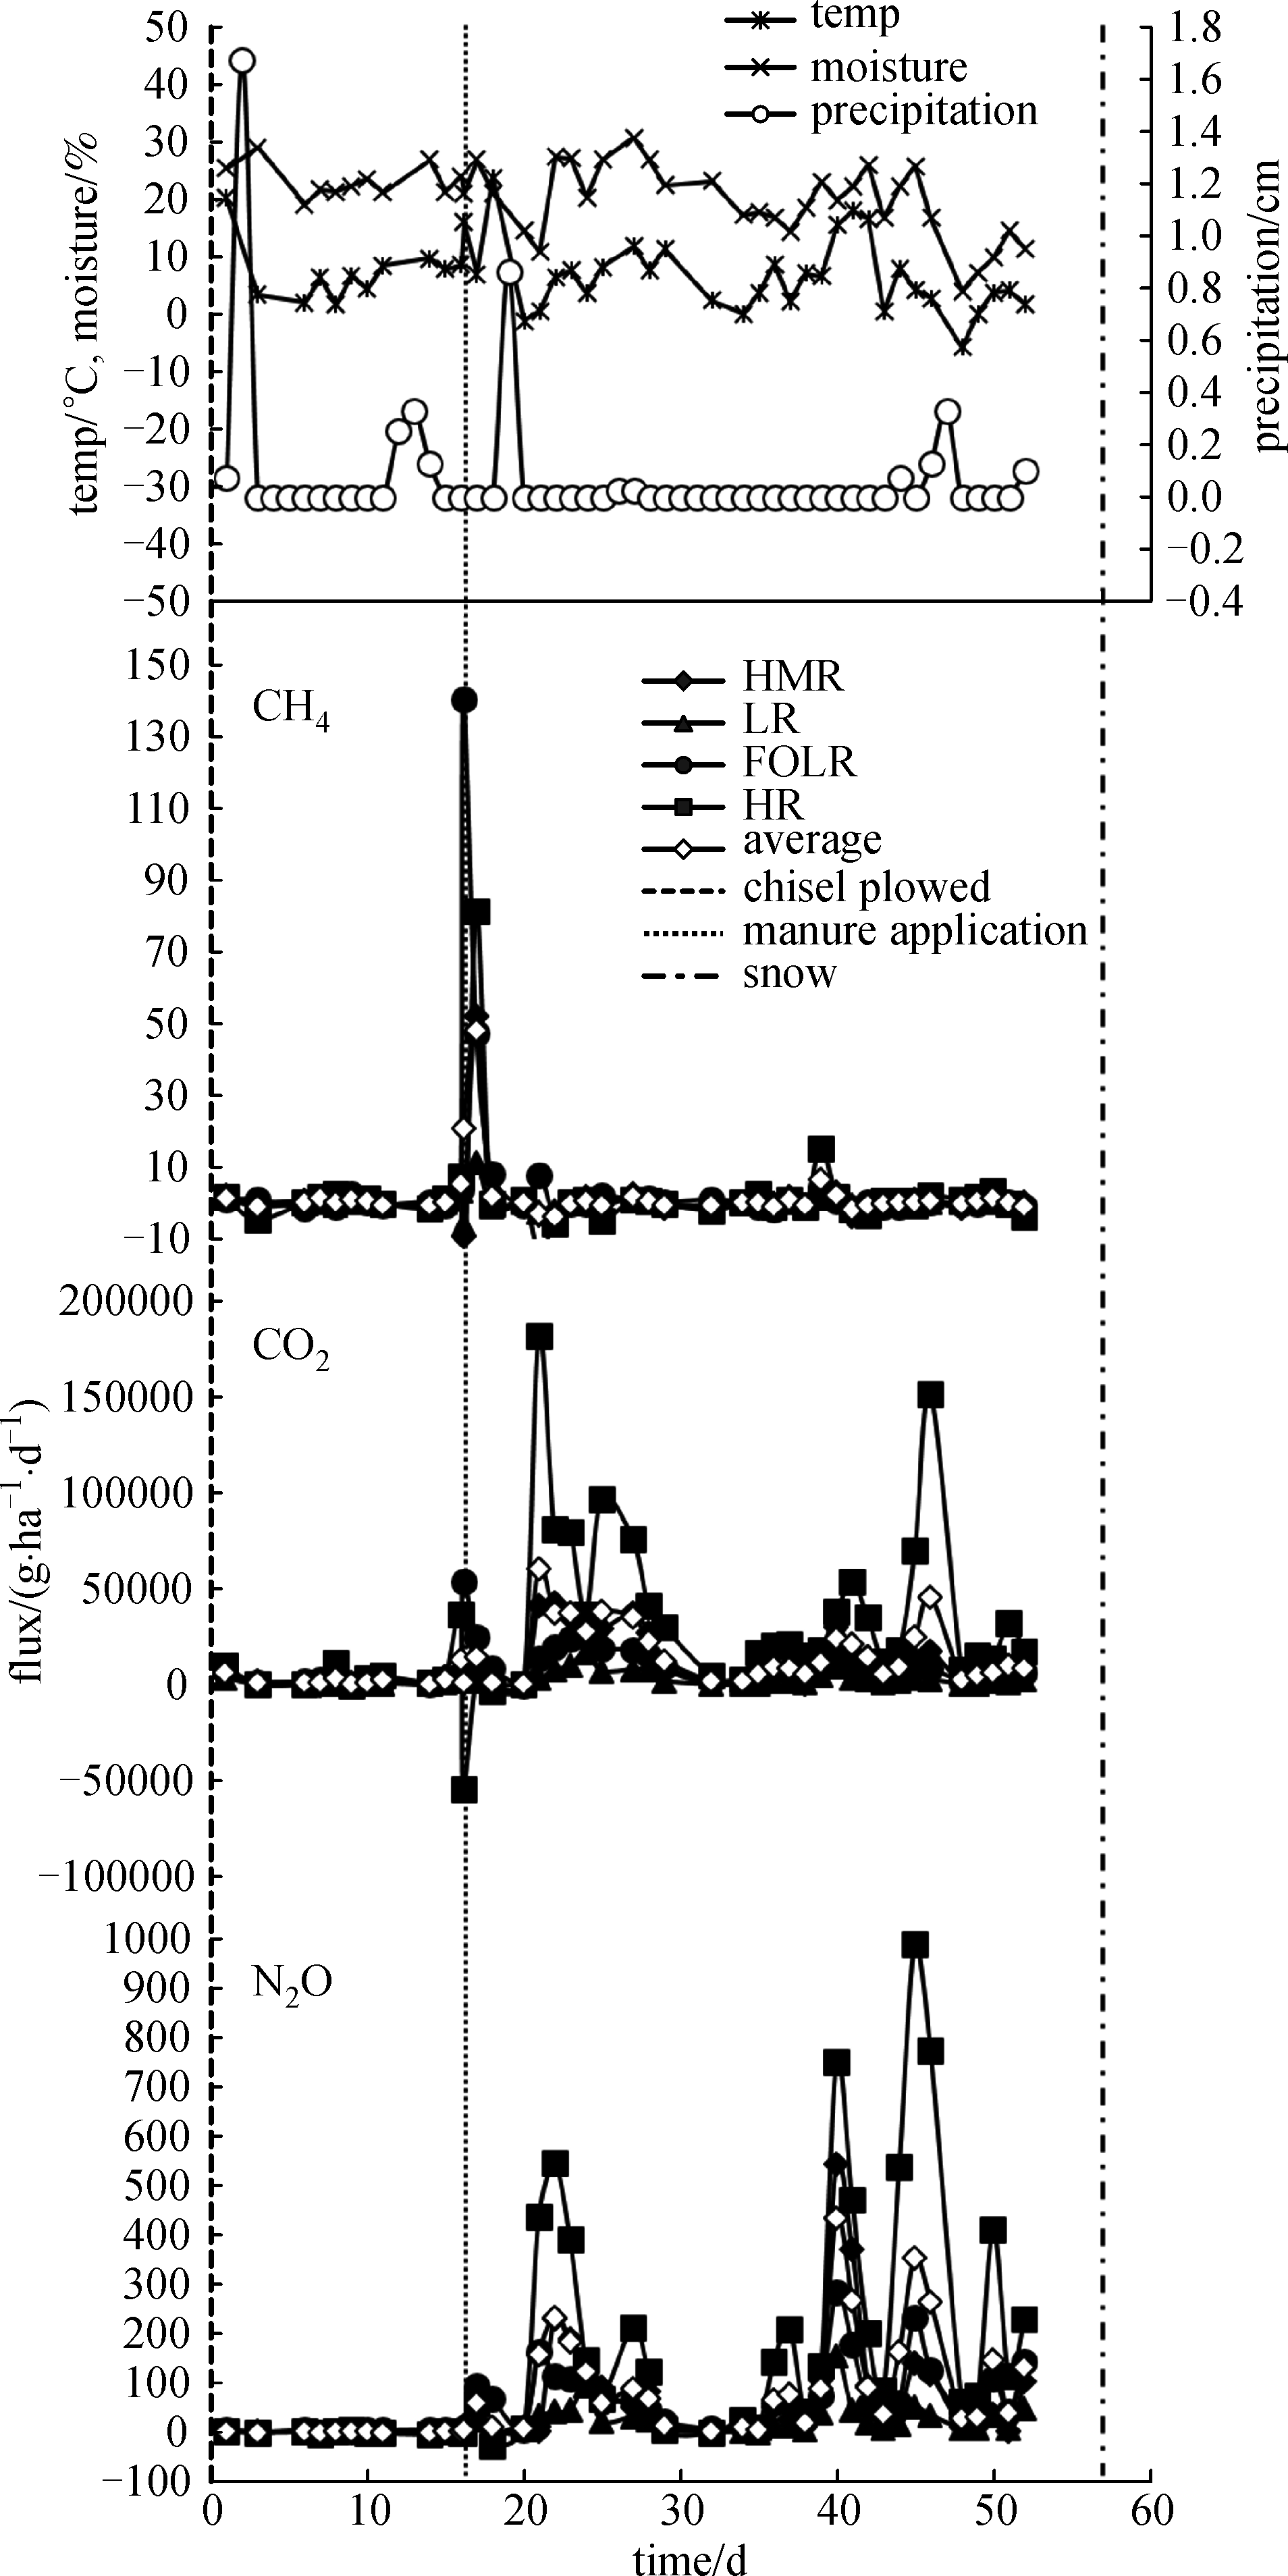
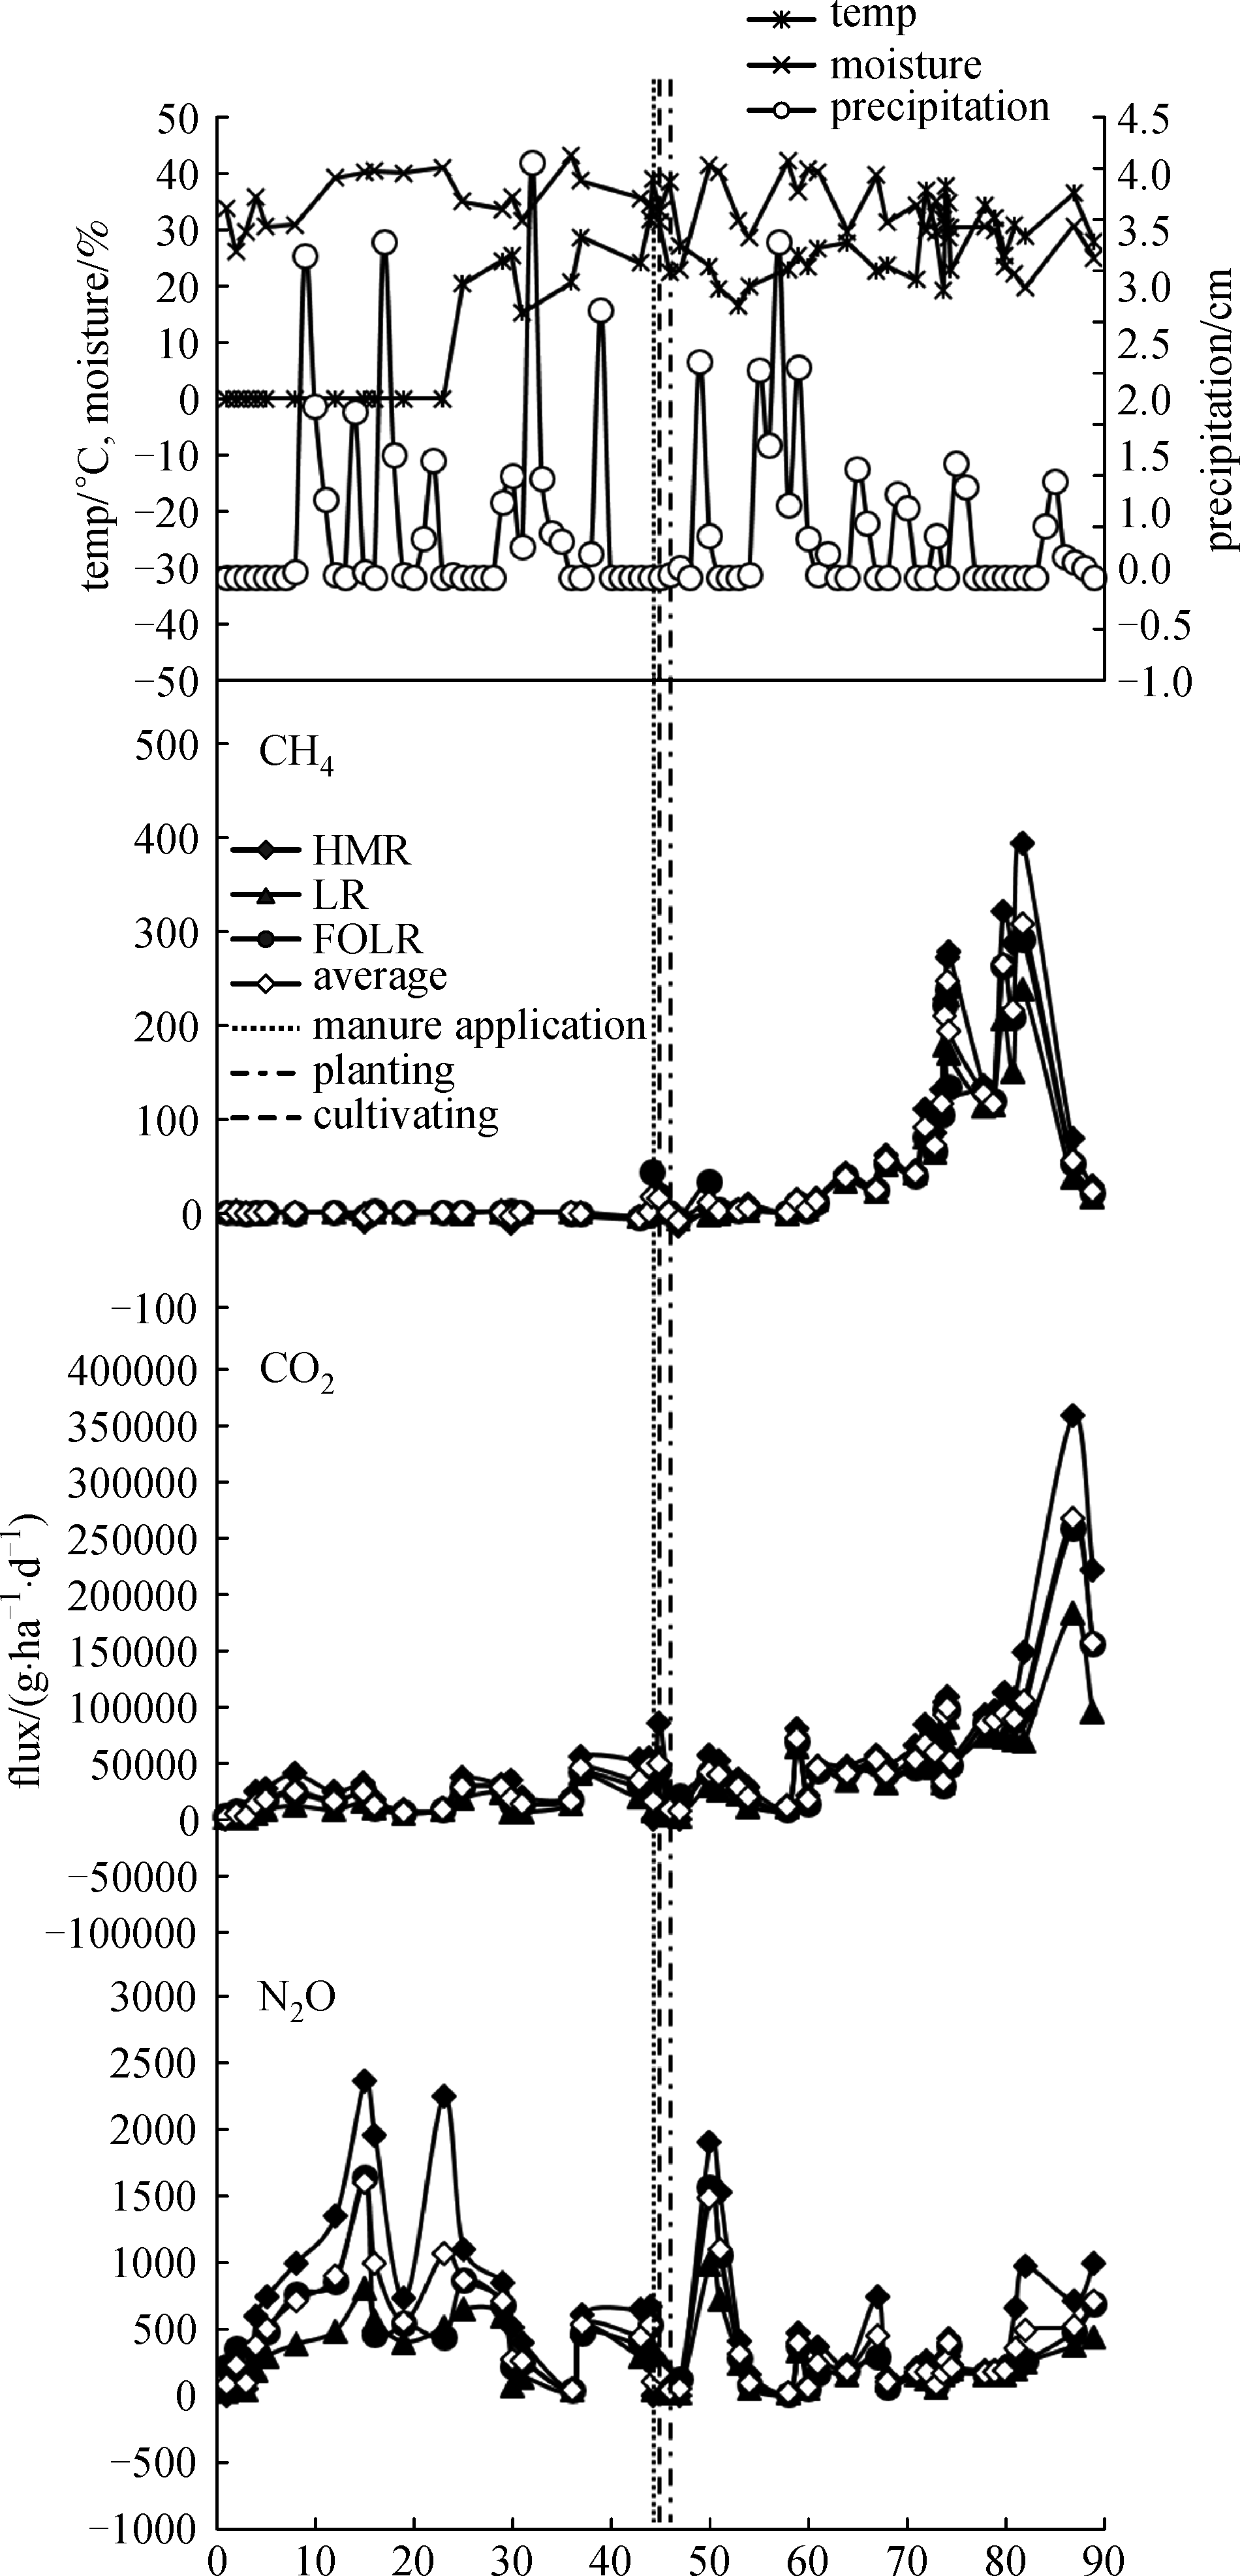
Abstract

Fall/Spring GHG emissions from a corn field & swine manure application were measured.

Flux chamber method was used for farm-scale measurements.

Four flux estimation models were evaluated for GHG emissions.

GHG flux estimates that were not significantly (p<0.05) different between models.

Spring reapplication of swine manure resulted in higher GHGs emissions.

Greenhouse gas emissions (GHGs) from swine production systems are relatively well researched with the exception of emissions from land application of manure. GHGs inventories are needed for process-based modeling and science-based regulations. Thus, the objective of this observational study was to measure GHG fluxes from land application of swine manure on a typical corn field. Assessment of GHG emissions from deep injected land-applied swine manure, fall and reapplication in the spring, on a typical US Midwestern corn-on-corn farm was completed. Static chambers were used for flux measurement along with gas analysis on a GC-FID-ECD. Measured gas concentrations were used to estimate GHGs flux using four different models: linear regression, nonlinear regression, first order linear regression and the revised Hutchinson and Mosier (HMR) model, respectively for comparisons. Cumulative flux estimates after manure application of 5.85 × 10⁵ g·ha-1 (1 ha= 0.01 km2) of CO2, 6.60 × 101 g·ha-1 of CH4, and 3.48 × 10³ g·ha-1 N2O for the fall trial and 3.11 × 10⁶ g·ha-1 of CO2, 2.95 × 10³ g·ha-1 of CH4, and 1.47 × 10⁴ g·ha-1 N2O after the spring reapplication trial were observed. The N2O net cumulative flux represents 0.595% of nitrogen applied in swine manure for the fall trial.

Keywords Climate change      Emissions      Greenhouse gases      Land application      Swine manure     
Corresponding Author(s): Jacek A. Koziel   
Issue Date: 06 April 2017
 Cite this article:   
Devin L. Maurer,Jacek A. Koziel,Kelsey Bruning. Field scale measurement of greenhouse gas emissions from land applied swine manure[J]. Front. Environ. Sci. Eng., 2017, 11(3): 1.
 URL:  
https://academic.hep.com.cn/fese/EN/10.1007/s11783-017-0915-9
https://academic.hep.com.cn/fese/EN/Y2017/V11/I3/1
Fig.1  Schematic of static chamber for greenhouse gas flux sampling
analysis fall average spring average
TS/% 7.46±1.70 × 10⁻¹ 2.17±1.00 × 10⁻²
VS/% 5.90±1.90 × 10⁻¹ 1.09±7.00 × 10⁻²
volatility/% 7.91 × 101±8.00 × 10⁻¹ 5.02 × 101±1.00
pH 8.01±1.00 × 10⁻² 7.57±1.00 × 10⁻²
COD/(mg·L-1) 4.10 × 10⁴±7.38 × 10² 3.44 × 10⁴±3.15 × 10³
NH3·NH4-N-1/(mg NH3-N·L-1) 6.62 × 10³±1.82 × 10² 4.76 × 10³±1.70 × 101
organic N/(mg N·L-1) 2.44 × 10³±3.24 × 10² 1.71 × 10³±1.60 × 10²
TKN/(mg N·L-1) 9.07 × 10³±5.06 × 10² 6.47 × 10³±1.77 × 10²
PO4-P/(mg PO4-P·L-1) 1.98 × 10²±2.00 1.03 × 10²±1.00
TP/(mg P·L-1) 8.75 × 10²±7.10 × 101 2.51 × 10²±3.10 × 101
TN/(lbs·1000 gal-1) 7.57 × 101±4.20 5.40 × 101±1.00
P2O5/(lbs·1000 gal-1) 1.67 × 101±1.40 4.80±5.90 × 10⁻¹
carbon/% 3.64 × 101±4.60 × 10⁻¹ 3.50 × 101±1.18
hydrogen/% 5.19±2.00 × 10⁻² 4.87±1.10 × 10⁻¹
nitrogen/% 4.15±1.10 × 10⁻¹ 3.82±2.20 × 10⁻¹
sulfur/% 1.78±3.50 × 10⁻¹ 1.52±2.90 × 10⁻¹
Tab.1  Applied swine manure analysis for the fall 2012 and spring 2013 reapplication
Fig.2  (a) Example of the four mathematical models used to estimate N2O flux using measured concentrations inside static chamber at time= 0, 0.25, 0.50, and 0.75 h on Dec 14, 2012. (b) Example of an apparent CH4 uptake by soil. The four mathematical models used to estimate CH4 flux using measured concentrations inside static chamber at time= 0, 0.25, 0.50, and 0.75 h on Nov 09, 2012
Fig.3  Fall flux for methane, carbon dioxide and nitrous oxide and measured air temperature inside chamber, soil moisture and precipitation
model comparison gas flux fall 2012 spring 2013 average
overalla) CH4 74 58 66
CO2 43 53 48
N2O 55 69 62
HMR vs. HR CH4 93 NA NA
CO2 57 NA NA
N2O 81 NA NA
HMR vs. LR CH4 100 69 85
CO2 95 64 80
N2O 98 71 85
HMR vs. FOLR CH4 79 60 70
CO2 86 62 74
N2O 83 80 82
HR vs. LR CH4 95 NA NA
CO2 45 NA NA
N2O 64 NA NA
HR vs. FLOR CH4 86 NA NA
CO2 55 NA NA
N2O 69 NA NA
LR vs. FLOR CH4 88 69 79
CO2 83 78 81
N2O 86 91 89
Tab.2  Comparison of mean daily GHG flux estimates based on all models for both fall 2012 and spring 2013 manure reapplication
time target gas calculation model mean
flux before
/(g·ha-1·d-1)
mean
flux after
/(g·ha-1·d-1)
mean
total flux
/(g·ha-1·d-1)
cumulative
flux before
/(g·ha-1)
cumulative
flux after
/(g·ha-1)
cumulative
total flux
/(g·ha-1)
fall: from Oct 24, 2012
through Dec 14, 2012
methane hyperbolic regression 1.60 × 10⁻¹ 6.60 × 10⁻¹ 4.11 × 10⁻¹ 2.59 2.44 × 101 2.70 × 101
HMR 4.40 × 10⁻¹ 8.60 × 10⁻¹ 6.50 × 10⁻¹ 6.98 3.20 × 101 3.90 × 101
linear regression 2.50 × 10⁻¹ -2.00 × 10⁻² 1.14 × 10⁻¹ 3.94 -7.10 × 10⁻¹ 3.23
1st order linear regression 2.90 × 10⁻¹ 5.63 2.96 4.70 2.08 × 10² 2.13 × 10²
average 2.80 × 10⁻¹±1.10 × 10⁻¹ 1.78±2.59 1.03±1.30 4.55±1.84 6.60 × 101±9.59 × 101 7.05 × 101±9.61 × 101
carbon hyperbolic regression 5.04 × 10³ 3.61 × 10⁴ 2.06 × 10⁴ 8.06 × 10⁴ 1.34 × 10⁶ 1.42 × 10⁶
dioxide HMR 1.87 × 10³ 1.33 × 10⁴ 7.58 × 10³ 3.00 × 10⁴ 4.92 × 10⁵ 5.21 × 10⁵
linear regression 7.43 × 10² 3.43 × 10³ 2.09 × 10³ 1.19 × 10⁴ 1.27 × 10⁵ 1.39 × 10⁵
1st order linear regression 2.18 × 10³ 1.05 × 10⁴ 6.33 × 10³ 3.48 × 10⁴ 3.88 × 10⁵ 4.23 × 10⁵
average 2.46 × 10³±1.83 × 10³ 1.58 × 10⁴±1.41 × 10⁴ 9.14 × 10³±7.97 × 10³ 3.93 × 10⁴±2.92 × 10⁴ 5.85 × 10⁵±5.23 × 10⁵ 6.25 × 10⁵±5.52 × 10⁵
nitrous hyperbolic regression -9.10 × 10⁻¹ 2.10 × 10² 1.05 × 10² -1.46 × 101 7.77 × 10³ 7.76 × 10³
oxide HMR -7.50 × 10⁻¹ 7.31 × 101 3.62 × 101 -1.21 × 101 2.71 × 10³ 2.69 × 10³
linear regression -3.80 × 10⁻¹ 2.31 × 101 1.14 × 101 -6.10 8.54 × 10² 8.48 × 10²
1st order linear regression 1.61 7.04 × 101 3.60 × 101 2.57 × 101 2.61 × 10³ 2.63 × 10³
average -1.10 × 10⁻¹±1.17 9.42 × 101±8.06 × 101 4.70 × 101±4.01 × 101 -1.76±1.87 × 101 3.48 × 10³±2.98 × 10³ 3.48 × 10³±2.97 × 10³
spring: from Mar 1, 2013 through June 28, 2013 methane HMR 1.56 × 101 7.90 × 101 4.73 × 101 7.02 × 10² 3.55 × 10³ 4.26 × 10³
linear regression 1.43 × 101 5.36 × 101 3.40 × 101 6.43 × 10² 2.41 × 10³ 3.06 × 10³
1st order linear regression 1.47 × 101 6.41 × 101 3.94 × 101 6.61 × 10² 2.88 × 10³ 3.54 × 10³
average 1.49 × 101±6.70 × 10⁻¹ 6.56 × 101±1.28 × 101 4.02 × 101±6.70 6.69 × 10²±3.00 × 101 2.95 × 10³±5.74 × 10² 3.62 × 10³±6.03 × 10²
carbon HMR 4.83 × 10⁴ 8.81 × 10⁴ 6.82 × 10⁴ 2.17 × 10⁶ 3.96 × 10⁶ 6.14 × 10⁶
dioxide linear regression 4.02 × 10⁴ 5.18 × 10⁴ 4.60 × 10⁴ 1.81 × 10⁶ 2.33 × 10⁶ 4.14 × 10⁶
1st order linear regression 4.66 × 10⁴ 6.74 × 10⁴ 5.70 × 10⁴ 2.10 × 10⁶ 3.03 × 10⁶ 5.13 × 10⁶
average 4.50 × 10⁴±4.30 × 10³ 6.91 × 10⁴±1.82 × 10⁴ 5.70 × 10⁴±1.11 × 10⁴ 2.03 × 10⁶±1.93 × 10⁵ 3.11 × 10⁶±8.20 × 10⁵ 5.13 × 10⁶±1.00 × 10⁶
nitrous HMR 1.05 4.61 × 10² 2.31 × 10² 4.72 × 101 2.08 × 10⁴ 2.08 × 10⁴
oxide linear regression 9.90 × 10⁻¹ 2.27 × 10² 1.14 × 10² 4.45 × 101 1.02 × 10⁴ 1.03 × 10⁴
1st order linear regression 1.20 2.94 × 10² 1.48 × 10² 5.40 × 101 1.32 × 10⁴ 1.33 × 10⁴
average 1.08±1.10 × 10⁻¹ 3.27 × 10²±1.21 × 10² 1.64 × 10²±6.03 × 101 4.85 × 101±4.92 1.47 × 10⁴±5.43 × 10³ 1.48 × 10⁴±5.43 × 10³
Tab.3  Mean daily and cumulative target gas fluxes (+/ - st. dev.) estimated using multiple regression models
Fig.4  Spring manure reapplication: observed flux for methane, carbon dioxide and nitrous oxide and measured air temperature inside chamber, soil moisture and precipitation
? site soil characteristics manure characteristics application
references geographic location crop mean air temperature/℃ mean annual precipitation/mm plot type soil type soil pH moisture/% manure type storage type manure pH application date application method rate of application/ (kg N·ha-1)
Jarecki et al. 2008 [13] Iowa no vegetation 16.5 controlled experiment controlled environment sandy loam 6.9 4.00 × 101 to 5.60 × 101 a) swine storage tank N/A fallc) injection (5 cm deep) 2.00 × 10²
clay 7 3.70 × 101 to 5.00 × 101 a)
Sharpe and Harper, 2002 [9] North Carolina soybean 22 1.36 × 10³ working farm sandy loam 6.3 5.00 to 2.30 × 101 swine anaerobic lagoon 8 summer irrigation system 2.75 × 10²
Hernandez-Ramirez et al. 2009 [7] West Lafayette, Indiana continuous corn 12 9.50 × 10² experimental plot silty clay loam and silt loam N/A N/A swine N/A N/A spring injection (10 cm deep) 2.55 × 10²
fall
Lovanh et al. 2010 [15] Kentucky corn/soybean rotation 22 N/A experimental plot silt loam N/A N/A swine lagoon N/A spring injectione) 2.00 × 10²
surfacee)
aerwaye)
Bender and Wood, 2007 [6] Auburn, Alabama bermudagrass N/A N/A soil cores clay N/A N/A swine anaerobic lagoon N/A summer, spring surface application 1.12 × 10²
loamy sand
sandy loam
This Study fall
spring reapplication
central Iowa corn ﹣5.0 to 16.8 8.81 × 10² working farm webster, clay loam N/A 4.03 to 3.07 × 101 swine deep pit 8.01 fall injection (15–20 cm deep) 3.73 × 10²
﹣0.4 to 31.4 1.96 × 101 to 4.31 × 101 7.57 spring 1.64 × 10²
Tab.4  Comparison of GHG emissions from land-applied swine manure with literature
sampling analysis greenhouse gas total fluxa) greenhouse gas mean daily fluxa)
sampling period days after manure sampling method analysis method flux estimation model N2O/ (kg N2O·ha-1) CO2/ (kg CO2·ha-1) CH4/ (kg CH4·ha-1) (N2O-N)-to-N applied emission factorb)/% N2O/ (kg N2O·ha-1·d-1) CO2/ (kg CO2·ha-1·d-1) CH4/ (kg CH4·ha-1·d-1)
56 SC GC LR and HM 8.53 1.78 1.6 2.7 1.52 × 10⁻¹ 3.20 × 10⁻² 2.80 × 10--
5.77 1.4 2.82 × 10⁻¹ 1.84 1.03 × 10⁻¹ 2.50 × 10⁻² 5.00 × 10⁻³
14 FGGT TDLS SR 6.44 N/A N/A 1.5 4.60 × 10⁻¹ N/A N/A
549 SC GC SMLR 1.28 × 101 d) 1.65 × 10⁴ d) 4.40 × 10⁻¹ d) 3.08 2.30 × 10⁻² d) 3.00 × 101 d) 1.00 × 10⁻³ d)
5.17 d) 1.63 × 10⁴ d) 2.10 × 10⁻¹ d) 1.24 9.00 × 10⁻³ d) 2.98 × 101 d) 4.00 × 10⁻⁴ d)
3 SC INNOVA LR and HM 5.76 × 10⁻¹ f) ﹣4.97 × 101 f) 3.70 f) 1.83 × 10⁻¹ 1.92 × 10⁻¹ ﹣1.66 × 101 1.23
7.45 × 10⁻¹ f) 1.45 × 10³ f) 7.31f) 2.37 × 10⁻¹ 2.48 × 10⁻¹ 4.84 × 10² 2.44
5.40 × 10⁻¹ f) 1.85 × 10² f) 5.46 f) 1.72 × 10⁻¹ 1.80 × 10⁻¹ 6.17 × 101 1.82
293g) SC GC N/A 1.49 g) 9.80 × 10³ g) 1.35 × 101 g) 7.60 × 10⁻¹ g) 5.00 × 10⁻³ g) 3.35 × 101 g) 4.60 × 10⁻² g)
4.64 g) 9.80 × 10³ g) 1.88 × 101 g) 2.35 g) 1.50 × 10⁻² g) 3.35 × 101 g) 6.40 × 10⁻² g)
2.21 g) ﹣2.70 × 10³ g) 2.96 × 101 g) 1.12 g) 8.00 × 10⁻³ g) ﹣9.21 g) 1.01 × 10⁻¹ g)
37 SC GC LR, FOLR, HMR, HR 3.48 d) 5.85 × 10²d) 6.60 × 10⁻²d) 5.95 × 10⁻¹d) 9.42 × 10⁻²d) 1.58 × 101d) 1.78 × 10⁻³d)
45 1.47 × 101d) 3.11 × 10³d) 2.95 d) N/A 3.27 × 10⁻¹d) 6.91 × 101d) 6.56 × 10⁻²d)
  
1 N Akdeniz, L D Jacobson, B P Hetchler, S D Bereznicki, A J Heber, J A Koziel, L Cai, S Zhang, D B Parker. Odor and odorous chemical emissions from animal buildings: Part 2–Odor emissions. Transactions of the ASABE, 2012, 55(6): 2335–2345
https://doi.org/10.13031/2013.42495
2 L Cai, J A Koziel, S Zhang, A J Heber, E L Cortus, D B Parker, S J Hoff, G Sun, K Y Heathcote, L D Jacobson, N Akdeniz, B P Hetchler, S D Bereznicki, E A Caraway, T T Lim. Odor and odorous chemical emissions from animal buildings: Part 3– Chemical emissions. Transactions of the ASABE, 2015, 58(5): 1333–1347
https://doi.org/10.13031/trans.58.11199
3 A J Heber, T T Lim, J Q Ni, P C Tao, A M Schmidt, J A Koziel, S J Hoff, L D Jacobson, Y Zhang, G B Baughman. Quality assured measurements of animal building emissions: particulate matter concentrations. Journal of the Air & Waste Management Association, 2006, 56(12): 1642–1648
https://doi.org/10.1080/10473289.2006.10464569
4 A J Heber, J Q Ni, T T Lim, P C Tao, A M Schmidt, J A Koziel, D B Beasley, S J Hoff, R E Nicolai, L D Jacobson, Y Zhang. Quality assured measurements of animal building emissions: gas concentrations. Journal of the Air & Waste Management Association, 2006, 56(10): 1472–1483
https://doi.org/10.1080/10473289.2006.10465680
5 D L Maurer, J A Koziel, J D Harmon, S J Hoff, A M Rieck-Hinz, D S Andersen. Summary of performance data for technologies to control gaseous, odor, and particulate emissions from livestock operations: air management practices assessment tool (AMPAT). Data in Brief, 2016, 7: 1413–1429
https://doi.org/10.1016/j.dib.2016.03.070
6 M R Bender, C W Wood. Above and below ground measurements of greenhouse gases from swine effluent amended soil. Communications in Soil Science and Plant Analysis, 2007, 38(17–18): 2479–2503
https://doi.org/10.1080/00103620701589062
7 G Hernandez-Ramirez, S M Brouder, D R Smith, G E Van Scoyoc. Greenhouse gas fluxes in an eastern Corn Belt soil: weather, nitrogen source, and rotation. Journal of Environmental Quality, 2009, 38(3): 841–854
https://doi.org/10.2134/jeq2007.0565
8 B H Baek, R Todd, N A Cole, J A Koziel. Ammonia and hydrogen sulphide flux and dry deposition velocity measurements using vertical gradient method at a commercial beef cattle feedlot. International Journal of Global Environmental Issues, 2006, 6(2/3): 189–203
https://doi.org/10.1504/IJGENVI.2006.010154
9 R R Sharpe, L A Harper. Nitrous oxide and ammonia fluxes in a soybean field irrigated with swine effluent. Journal of Environmental Quality, 2002, 31(5): 1491–1501
10 D Parker, J Ham, B Woodbury, L Cai, M Spiehs, M Rhoades, S Trabue, K Casey, R Todd, A Cole. Standardization of flux chamber and wind tunnel flux measurements for quantifying volatile organic compound and ammonia emissions from area sources at animal feeding operations. Atmospheric Environment, 2013, 66: 72–83
https://doi.org/10.1016/j.atmosenv.2012.03.068
11 T B Parkin, R T Venterea. Chapter 3. Chamber-based trace gas flux measurements. In: Follett R F, ed. Sampling Protocols. 2010, 3–1–3–39.
12 A S K Chan, T B Parkin. Effect of land use on methane flux from soil. Journal of Environmental Quality, 2001, 30(3): 786–797
https://doi.org/10.2134/jeq2001.303786x
13 M K Jarecki, T B Parkin, A S K Chan, J L Hatfield, R Jones. Greenhouse gas emissions from two soils receiving nitrogen fertilizer and swine manure slurry. Journal of Environmental Quality, 2008, 37(4): 1432–1438
https://doi.org/10.2134/jeq2007.0427
14 G P Livingston, G L Hutchinson, K Spartalian. Trace gas emission in chambers: a non-study-state diffusion model. Soil Science Society of America Journal, 2006, 70(5): 1459–1469
https://doi.org/10.2136/sssaj2005.0322
15 N Lovanh, J Warren, K Sistani. Determination of ammonia and greenhouse gas emissions from land application of swine slurry: a comparison of three application methods. Bioresource Technology, 2010, 101(6): 1662–1667
https://doi.org/10.1016/j.biortech.2009.09.078
16 A R Pedersen, S O Petersen, K Schelde. A comprehensive approach to soil-atmosphere trace-gas flux estimation with static chambers. European Journal of Soil Science, 2010, 61(6): 888–902
https://doi.org/10.1111/j.1365-2389.2010.01291.x
17 T B Parkin, R T Venterea, S K Hargreaves. Calculating the detection limits of chamber-based soil greenhouse gas flux measurements. Journal of Environmental Quality, 2012, 41(3): 705–715
https://doi.org/10.2134/jeq2011.0394
18 K R Sistani, J G Warren, N Lovanh, S Higgins, S Shearer. Greenhouse gas emissions from swine effluent applied to soil by different methods. Soil Science Society of America Journal, 2010, 74(2): 429–435
https://doi.org/10.2136/sssaj2009.0076
19 M Tenuta, M Mkhabela, D Tremorin, L Coppi, G Phipps, D Flaten, K Ominski. Nitrous oxide and methane emission from a coarse-textured grassland soil receiving hog slurry. Agriculture, Ecosystems & Environment, 2010, 138(1–2): 35–43
https://doi.org/10.1016/j.agee.2010.03.014
20 T R Venterea. Theoretical comparison of advanced methods for calculating nitrous oxide fluxes using non-study state chambers. Soil Science Society of America Journal, 2013, 77(3): 709–720
https://doi.org/10.2136/sssaj2013.01.0010
21 Association of Official Agricultural Chemists International. Official Methods of Analysis. 17th ed. Arlington, VA: Association of Official Agricultural Chemists International, 2000
22 American Public Health Association. Standard Methods for the Examination of Water and Wastewater. 20th ed. Washington, DC: American Public Health Association, 1998
23 R M Bajracharya, R Lal, J M Kimble. Diurnal and seasonal CO2-C flux from soil as related to erosion phases in central Ohio. Soil Science Society of America Journal, 2000, 64(1): 286–293
https://doi.org/10.2136/sssaj2000.641286x
24 P A Jacinthe, R Lal. Effects of soil cover and land-use on the relations flux-concentration of trace gases. Soil Science, 2004, 169(4): 243–259
https://doi.org/10.1097/01.ss.0000126839.58222.0f
25 G L Hutchinson , A R Mosier . Improved soil cover method for field measurement of nitrous oxide fluxes. Soil Science Society of America Journal, 1981, 45(2): 311–316
https://doi.org/10.2136/sssaj1981.03615995004500020017x
[1] FSE-17006-OF-MDL_suppl_1 Download
[1] Jaime A. Teixeira da Silva, Panagiotis Tsigaris. The relevance of James Lovelock’s research and philosophy to environmental science and academia[J]. Front. Environ. Sci. Eng., 2023, 17(3): 39-.
[2] Mengtian Li, Ge Song, Ruiping Liu, Xia Huang, Huijuan Liu. Inactivation and risk control of pathogenic microorganisms in municipal sludge treatment: A review[J]. Front. Environ. Sci. Eng., 2022, 16(6): 70-.
[3] Hengrui Tao, Jia Xing, Gaofeng Pan, Jonathan Pleim, Limei Ran, Shuxiao Wang, Xing Chang, Guojing Li, Fei Chen, Junhua Li. Impact of anthropogenic heat emissions on meteorological parameters and air quality in Beijing using a high-resolution model simulation[J]. Front. Environ. Sci. Eng., 2022, 16(4): 44-.
[4] Xiaoqiang Gong, Jinbiao Li, Scott X. Chang, Qian Wu, Zhengfeng An, Chengpeng Huang, Xiangyang Sun, Suyan Li, Hui Wang. Cattle manure biochar and earthworm interactively affected CO2 and N2O emissions in agricultural and forest soils: Observation of a distinct difference[J]. Front. Environ. Sci. Eng., 2022, 16(3): 39-.
[5] Kaili Pang, Kaishan Zhang, Shuai Ma, Xiangrui Meng. Quantification of emission variability for off-road equipment in China based on real-world measurements[J]. Front. Environ. Sci. Eng., 2022, 16(2): 24-.
[6] Yueqi Jiang, Jia Xing, Shuxiao Wang, Xing Chang, Shuchang Liu, Aijun Shi, Baoxian Liu, Shovan Kumar Sahu. Understand the local and regional contributions on air pollution from the view of human health impacts[J]. Front. Environ. Sci. Eng., 2021, 15(5): 88-.
[7] Jianwei Liu, Peng Yue, Nana Zang, Chen Lu, Xinyue Chen. Removal of odors and VOCs in municipal solid waste comprehensive treatment plants using a novel three-stage integrated biofilter: Performance and bioaerosol emissions[J]. Front. Environ. Sci. Eng., 2021, 15(3): 48-.
[8] Jiangbo Jin, Yun Zhu, Jicheng Jang, Shuxiao Wang, Jia Xing, Pen-Chi Chiang, Shaojia Fan, Shicheng Long. Enhancement of the polynomial functions response surface model for real-time analyzing ozone sensitivity[J]. Front. Environ. Sci. Eng., 2021, 15(2): 31-.
[9] Pol Masclans Abelló, Vicente Medina Iglesias, M. Antonia de los Santos López, Jesús Álvarez-Flórez. Real drive cycles analysis by ordered power methodology applied to fuel consumption, CO2, NOx and PM emissions estimation[J]. Front. Environ. Sci. Eng., 2021, 15(1): 4-.
[10] Hanli Wan, Jianmin Bian, Han Zhang, Yihan Li. Assessment of future climate change impacts on water-heat-salt migration in unsaturated frozen soil using CoupModel[J]. Front. Environ. Sci. Eng., 2021, 15(1): 10-.
[11] Yuvarajan Devarajan,Ravi kumar Jayabal,Devanathan Ragupathy,Harish Venu. Emissions analysis on second generation biodiesel[J]. Front. Environ. Sci. Eng., 2017, 11(1): 3-.
[12] Michael Patrick WALSH. PM2.5: global progress in controlling the motor vehicle contribution[J]. Front. Environ. Sci. Eng., 2014, 8(1): 1-17.
[13] Yang DONG, Yi LIU, Jining CHEN, Yebin DONG, Benliang QU. Forecasting industrial emissions: a monetary approach vs. a physical approach[J]. Front Envir Sci Eng, 2012, 6(5): 734-742.
[14] Wenqiang SUN, Jiuju CAI, Hai YU, Lei DAI. Decomposition analysis of energy-related carbon dioxide emissions in the iron and steel industry in China[J]. Front Envir Sci Eng, 2012, 6(2): 265-270.
[15] Jingbo GUO, Fang MA, Yuanyuan QU, Ang LI, Liang WANG. Systematical strategies for wastewater treatment and the generated wastes and greenhouse gases in China[J]. Front Envir Sci Eng, 2012, 6(2): 271-279.
Viewed
Full text


Abstract

Cited

  Shared   
  Discussed