|
|
|
Combined analysis of land cover change and NDVI trends in the Northern Eurasian grain belt |
Christopher K. WRIGHT1( ), Kirsten M. de BEURS2, Geoffrey M. HENEBRY1 ), Kirsten M. de BEURS2, Geoffrey M. HENEBRY1 |
| 1. South Dakota State University, Geographic Information Science Center of Excellence (GIScCE), Brookings, South Dakota 57007, USA; 2. The University of Oklahoma, Department of Geography and Environmental Sustainability, Norman, OK 73019, USA |
|
|
|
|
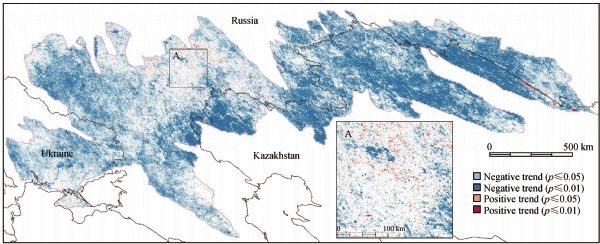
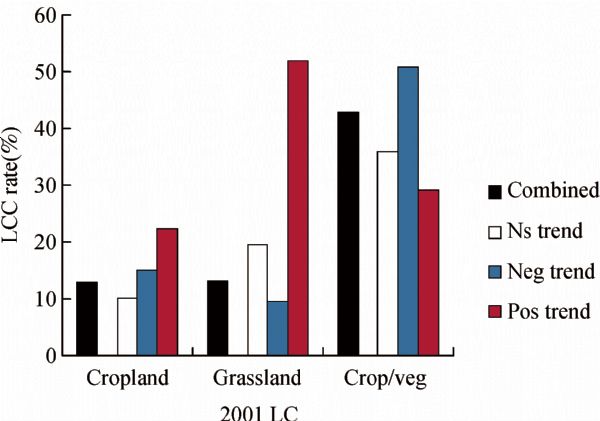
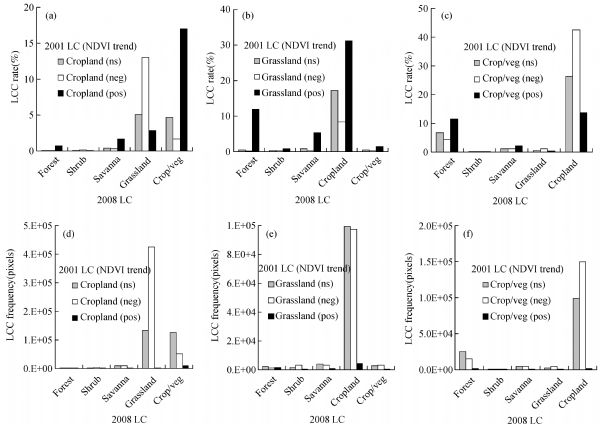
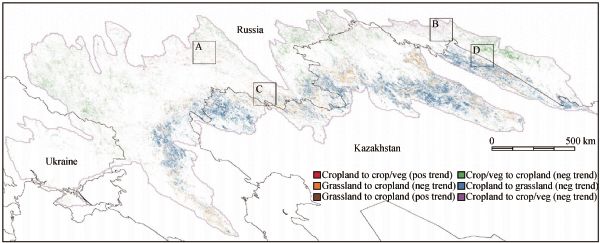
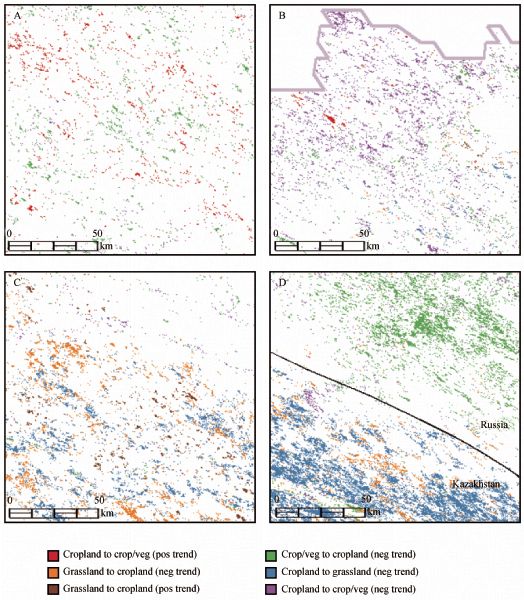
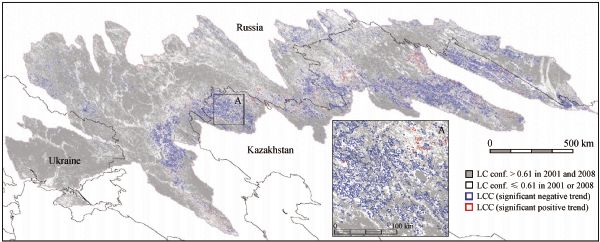
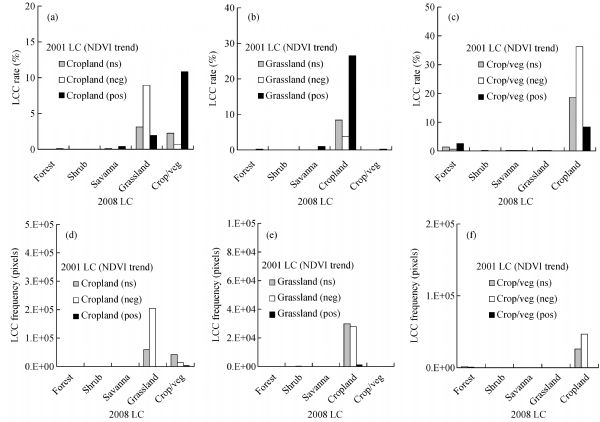
Abstract We present an approach to regional environmental monitoring in the Northern Eurasian grain belt combining time series analysis of MODIS normalized difference vegetation index (NDVI) data over the period 2001–2008 and land cover change (LCC) analysis of the 2001 and 2008 MODIS Global Land Cover product (MCD12Q1). NDVI trends were overwhelmingly negative across the grain belt with statistically significant (p≤0.05) positive trends covering only 1% of the land surface. LCC was dominated by transitions between three classes; cropland, grassland, and a mixed cropland/natural vegetation mosaic. Combining our analyses of NDVI trends and LCC, we found a pattern of agricultural abandonment (cropland to grassland) in the southern range of the grain belt coinciding with statistically significant (p≤0.05) negative NDVI trends and likely driven by regional drought. In the northern range of the grain belt we found an opposite tendency toward agricultural intensification; in this case, represented by LCC from cropland mosaic to pure cropland, and also associated with statistically significant (p≤0.05) negative NDVI trends. Relatively small clusters of statistically significant (p≤0.05) positive NDVI trends corresponding with both localized land abandonment and localized agricultural intensification show that land use decision making is not uniform across the region. Land surface change in the Northern Eurasian grain belt is part of a larger pattern of land cover land use change (LCLUC) in Eastern Europe, Russia, and former territories of the Soviet Union following realignment of socialist land tenure and agricultural markets. Here, we show that a combined analysis of LCC and NDVI trends provides a more complete picture of the complexities of LCLUC in the Northern Eurasian grain belt, involving both broader climatic forcing, and narrower anthropogenic impacts, than might be obtained from either analysis alone.
|
| Keywords
land cover change
MODIS
NDVI
Northern Eurasian grain belt
Kazakhstan
Russia
time series analysis
Ukraine
|
|
Corresponding Author(s):
WRIGHT Christopher K.,Email:Christopher.Wright@sdstate.edu
|
|
Issue Date: 05 June 2012
|
|
| 1 |
Akhmadieva ZK, Groisman PY (2008). General assessment of climate change in Kazakhstan since 1990. Hydrometeorology and Environment , 2:46-53 (in Russian)
|
| 2 |
Angelstam P, Boresj?-Bronge L, Mikusiński G, Sporrong U, W?stfelt A (2003). Assessing village authenticity with satellite images: a method to identify intact cultural landscapes in Europe. Ambio , 32(8): 594-604
pmid:15049358
|
| 3 |
de Beurs K M, Henebry G M (2004a). Land surface phenology, climatic variation, and institutional change: analyzing agricultural land cover change in Kazakhstan. Remote Sens Environ , 89(4): 497-509
doi: 10.1016/j.rse.2003.11.006
|
| 4 |
de Beurs K M, Henebry G M (2004b). Trend analysis of the Pathfinder AVHRR Land (PAL) NDVI data for the deserts of Central Asia. IEEE Geosci Remote Sens Lett , 1(4): 282-286
doi: 10.1109/LGRS.2004.834805
|
| 5 |
de Beurs K M, Henebry G M (2005). A statistical framework for the analysis of long image time series. Int J Remote Sens , 26(8): 1551-1573
doi: 10.1080/01431160512331326657
|
| 6 |
de Beurs K M, Wright C K, Henebry G M (2009). Dual scale trend analysis for evaluating climatic and anthropogenic effects on the vegetated land surface in Russia and Kazakhstan. Environ Res Lett , 4: 045012
doi: 10.1088/1748-9326/4/4/045012
|
| 7 |
Friedl M A, Sulla-Menashe D, Tan B, Schneider A, Ramankutty N, Sibley A, Huang X (2010). MODIS collection 5 global land cover: algorithm refinements and characterization of new datasets. Remote Sens Environ , 114(1): 168-182
doi: 10.1016/j.rse.2009.08.016
|
| 8 |
Henebry G M (2009). Global change: carbon in idle croplands. Nature , 457(7233): 1089-1090
doi: 10.1038/4571089a pmid:19242461
|
| 9 |
Hirsch R M, Slack J R (1984). A nonparametric trend test for seasonal data with serial dependence. Water Resour Res , 20(6): 727-732
doi: 10.1029/WR020i006p00727
|
| 10 |
Ioffe G, Nefedova T, Zaslavsky I (2004). From spatial continuity to fragmentation: the case of Russian farming. Ann Assoc Am Geogr , 94 (4): 913-943
|
| 11 |
IPCC (2007). Climate Change 2007: Mitigation, In: Metz B, Davidson O R, Bosch P R, Dave R, Meyer L A, eds. Contribution of Working Group III to the Fourth Assessment Report of the IPCC , Cambridge: Cambridge University Press
|
| 12 |
Kovalskyy V, Henebry G M (2009). Change and persistence in land surface phenologies of the Don and Dneiper river basins. Environ Res Lett , 4(4): 045018
doi: 10.1088/1748-9326/4/4/045018
|
| 13 |
Kuemmerle T, Hostert P, Radeloff V C, van der Linden S, Perzanowski K, Kruhlov I (2008). Cross-border comparison of post-socialist farmland abandonment in the Carpathians. Ecosys , 11(4): 614-628
doi: 10.1007/s10021-008-9146-z
|
| 14 |
Kuemmerle T, Radeloff V C, Perzanowski K, Hostert P (2006). Cross-border comparison of land cover 324 and landscape pattern in Eastern Europe using a hybrid classification technique. Remote Sens Environ , 103(4): 449-464
doi: 10.1016/j.rse.2006.04.015
|
| 15 |
Lioubimtseva E, Henebry G M (2009). Climate and environmental change in arid Central Asia: impacts, 329 vulnerability, and adaptations. J Arid Environ , 73(11): 963-977
doi: 10.1016/j.jaridenv.2009.04.022
|
| 16 |
Lioubimtseva E, Henebry GM (2012). Grain production trends in Russia, Ukraine and Kazakhstan: New opportunities in an increasingly unstable world? Frontiers of Earth Science , 6 (2).
doi: 10.1007/s11707-012-0318-y
|
| 17 |
McCauley M (1976) Khrushchev and the Development of Soviet Agriculture, the Virgin Land Programme 1953-1964. Plymouth: The Bowering Press
|
| 18 |
McIver D K, Friedl M A (2001). Estimating pixel-scale land cover classification confidence using nonparametric machine learning methods. IEEE Trans Geosci Rem Sens , 39(9): 1959-1968
doi: 10.1109/36.951086
|
| 19 |
Müller D, Kuemmerle T, Rusu M, Griffiths P (2009). Lost in transition: determinants of post-socialist cropland abandonment in Romania. J Land Use Sci , 4(1-2): 109-129
doi: 10.1080/17474230802645881
|
| 20 |
Myneni R B, Keeling C D, Tucker C J, Asrar G, Nemani R R (1997). Increased plant growth in the northern high latitudes from 1981 to 1991. Nature , 386(6626): 698-702
doi: 10.1038/386698a0
|
| 21 |
NASA (2010). Nadir BRDF-adjusted reflectance 16-day L3 global 500m. https://lpdaac.usgs.gov/lpdaac/products/modis_products_table/nadir_brdf_adjusted_reflectance/16_day_l3_global_500m/mcd43a4. Accessed 13May2010
|
| 22 |
Pilifosova O V, Eserkepova I B, Dolgih S A (1997). Regional climate change scenarios under global warming in Kazakhstan. Clim Change , 36(1/2): 23-40
doi: 10.1023/A:1005368404482
|
| 23 |
Schneider U, Fuchs T, Meyer-Christoffer, Rudolf B (2008) Global precipitation analysis products. Global Precipitation Climatology Centre Internet Publication . http://gpcc.dwd.de. Accessed 12May2010
|
| 24 |
Vi?a A, Echavarria R, Rundquist D (2004). Satellite change detection analysis of deforestation rates and patterns along the Colombia-Ecuador border. Ambio , 33(3): 118-125
pmid:15151380
|
| 25 |
Wright C K, de Beurs K, Akhmadieva Z K, Groisman P Y, Henebry G M (2009a). Reanalysis data underestimate significant changes in growing season weather in Kazakhstan. Environ Res Lett , 4(4): 045020
doi: 10.1088/1748-9326/4/4/045020
|
| 26 |
Wright C K, de Beurs K M, Kovalskyy V, Henebry G M (2009b). Contrasting trends in land surface phenologies since 2000 in western Russia and northern Kazakhstan. Poster presented at: European Geosciences Union General Assembly, April 19-24, Vienna, Austria
|
| 27 |
Yuan F, Sawaya K E, Loeffelhoz B C, Bauer M E (2005). Land cover classification and change analysis of the Twin Cities (Minnesota) metropolitan area by multitemporal Landsat remote sensing. Remote Sens Environ , 98(2-3): 317-328
doi: 10.1016/j.rse.2005.08.006
|
|
Viewed |
|
|
|
Full text
|
|
|
|
|
Abstract
|
|
|
|
|
Cited |
|
|
|
|
| |
Shared |
|
|
|
|
| |
Discussed |
|
|
|
|