Please wait a minute...
Frontiers of Environmental Science & Engineering

ISSN 2095-2201

ISSN 2095-221X(Online)

CN 10-1013/X

Postal Subscription Code 80-973

2018 Impact Factor: 3.883

Front Envir Sci Eng    2014, Vol. 8 Issue (1) : 27-41    https://doi.org/10.1007/s11783-012-0461-4
RESEARCH ARTICLE
Trends of chemical speciation profiles of anthropogenic volatile organic compounds emissions in China, 2005–2020
Wei WEI1,2, Shuxiao WANG2(), Jiming HAO2, Shuiyuan CHENG1
1. Department of Environmental Science and Engineering, Beijing University of Technology, Beijing 100124, China; 2. School of Environment, State Key Joint Laboratory of Environment Simulation and Pollution Control (SKLESPC), Tsinghua University, Beijing 100084, China
 Download: PDF(232 KB)   HTML
 Export: BibTeX | EndNote | Reference Manager | ProCite | RefWorks
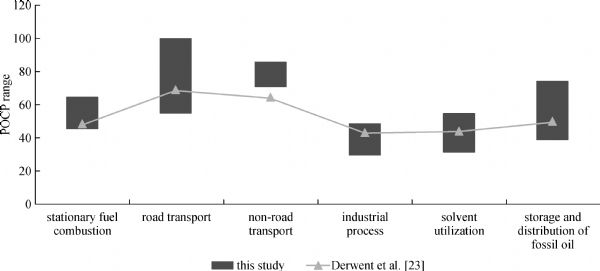
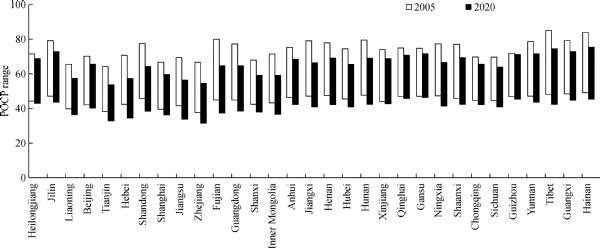
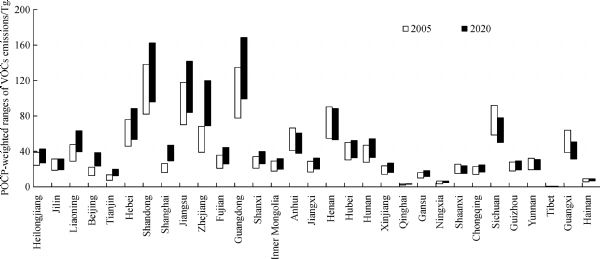
Abstract

This study estimates the detailed chemical profiles of China’s anthropogenic volatile organic compounds (VOCs) emissions for the period of 2005–2020. The chemical profiles of VOCs for seven activity sectors are calculated, based on which the Photochemical Ozone Creation Potential (POCP) of VOCs for these sectors is evaluated. At the national level, the VOCs species emitted in 2005 include alkanes, alkenes and alkynes, aromatic compounds, alcohols, ketones, aldehydes, esters, ethers and halocarbons, accounting for 26.4 wt.%, 29.2 wt.%, 21.3 wt.%, 4.7 wt.%, 5.4 wt.%, 1.7 wt.%, 2.1 wt.%, 0.7 wt.% and 2.2 wt.% of total emissions, respectively. And during 2005-2020, their mass proportions would respectively grow or decrease by -6.9%, -32.7%, 7.3%, 65.3%, 34.7%, -48.6%, 108.5%, 100.5%, and 55.4%. This change would bring about a 13% reduction of POCP for national VOCs emissions in the future. Thus, although the national VOCs emissions are expected to increase by 33% over the whole period, its ozone formation potential is estimated to rise only by 14%. Large discrepancies are found in VOCs speciation emissions among provinces. Compared to western provinces, the eastern provinces with a more developed economy would emit unsaturated hydrocarbons and benzene with lower mix ratios, and aromatic compounds except benzene, oxidized hydrocarbons and halocarbons with higher mix ratios. Such differences lead to lower POCP of VOCs emitted in eastern provinces, and higher POCP of VOCs emitted in western provinces. However, due to the large VOCs emissions from Chinese eastern region, the ozone formation potential of VOCs emission in eastern provinces would be much higher than those in western provinces by about 156%–235%.

Keywords volatile organic compounds (VOCs)      chemical speciation      ozone formation      Photochemical Ozone Creation Potential (POCP)      China     
Corresponding Author(s): WANG Shuxiao,Email:shxwang@tsinghua.edu.cn   
Issue Date: 01 February 2014
 Cite this article:   
Wei WEI,Shuxiao WANG,Jiming HAO, et al. Trends of chemical speciation profiles of anthropogenic volatile organic compounds emissions in China, 2005–2020[J]. Front Envir Sci Eng, 2014, 8(1): 27-41.
 URL:  
https://academic.hep.com.cn/fese/EN/10.1007/s11783-012-0461-4
https://academic.hep.com.cn/fese/EN/Y2014/V8/I1/27
No.category of grouped VOCs speciesPOCP inEuropeanconditionsPOCP in Chinese conditionsPOCP used in this study
1ethane10-20910-20
2n-propane20-401320-40
3cycloalkanes30-503830-50
4other alkanes30-5519-4830-55
5ethylene100100100
6acetylene20-4566
7propene115-140160160
8alkenes with internal double bonds90-13075-16975-169
9alkenes with terminal double bonds110-19075-22975-229
10benzene15-3533
11toluene25-603636
12m,p,o-xylene70-11088-11188-111
13mono alkanes-substituted aromatics35-8530-6030-60
14multi alkanes-substituted aromatics45-11059-19759-197
15alknenes-substituted aromatics10-15-10-15
16phenol50-70-50-70
17methanol10-151110-15
18ethanol35-553435-55
19other alcohols20-5010-6520-50
20acetone10-50810
21other ketones35-6028-6535-60
22formic acid-22
23other acid10-159-1310-15
24formaldehyde25-806725-80
25acetaldehyde70-9011670-90
26acrylaldehyde-3030
27other aldehydes40-10535-7440-105
28esters-5-305-30
29ethers15-5016-5415-50
30halocarbons0-101-70-10
31organic compounds containing sulfur--0
32organic compounds containing nitrogen--0
33other compounds--0
Tab.1  Classification of VOCs compounds with POCP values in this study
emission sectorsubsectoremission sources
stationary fuelcombustionpower plantcoal*/oil/gas-boilers
industrial combustioncoal*/oil/gas-boilers
domestic combustioncoal/oil/gas-boilers
coal*/biofuel*-domestic stoves
road transportgasoline engineslight-duty vehicles*/ light-duty trucks*/ heavy-duty passenger cars*/heavy-duty trucks*/ motorcycles *
diesel engineslight-duty vehicles*/ light-duty trucks*/ heavy-duty passenger cars*/heavy-duty trucks*
non-road transportgasoline enginesagricultural machinery
diesel enginestrain/ship/agricultural machinery /construction machinery
industrial processsmelting industryiron/steel/sinter
construction materialcement/brick/lime/ceramics
chemical industryblack carbon /solvent-based paint, ink adhesive/ polystyrene /PE resin/PVC resin/PP resin/ organic fiber/ Synthetic rubber
coking industrycoking industry*
petroleum industrycrude oil production/crude oil refining*
food industryedible oil/wine/beer/spirit/breed
pharmaceutical industrychemical drug agents
otherscharcoal/paper
solvent utilizationpaint coatinginterior and exterior wall paint*/vehicle manufacture/ vehicle repairing*/wood furniture*/ other
adhesive utilizationshoe-making/vehicle manufacture/cloth manufacture/wood furniture/others
ink utilizationprinting process*
textile coatingleather manufacture*
wood preservativewood preservative
dry cleaning agencydry cleaning agency
storage and distribution of fossil fuelcrude oilstorage/upload/download/transport
gasolinestorage*/upload*/download*/transport*/service stations*
otherswaste treatmentwaste water/solid waste
agricultural residues open burning*
smokingsmoking*
cookingcooking
Tab.2  VOCs emission sources considered in this study
emission sectors2005201020152020
stationary fuel combustion5.55.24.84.2
road transport4.75.63.63.0
non-road transport0.91.21.11.4
industrial process3.13.84.75.9
solvent utilization3.45.17.29.4
storage and distribution of fossil oil0.50.60.70.8
others1.31.21.21.1
total19.422.723.325.9
Tab.3  VOCs emissions estimates for seven sectors during 2005-2020/(Tg·year)
chemicalspecies category no.residential stovesroad vehiclespaints coatingprintingcoking industrycrude oilrefinerygasolinevapor
coalswoodsagriculturalresiduesnature gasgasoline vehiclesdieselvehiclesmotorcyclesdecorativewater-based paintsdecorativeoil-based paintsautopaintsfurniture paints
114.618.343.776.546.357.751.40N.A.N.A.N.A.N.A.N.A.N.A.1.32N.A.
25.372.682.293.542.766.780.24N.A.2.55N.A.N.A.N.A.N.A.3.475.52
30.480.000.000.041.340.770.45N.A.0.77N.A.N.A.N.A.N.A.17.07N.A.
49.733.446.314.7824.2722.1433.241.3319.84N.A.N.A.44.9016.7645.7853.11
516.6020.8318.914.7310.318.919.01N.A.N.A.N.A.N.A.N.A.N.A.6.080.02
63.9311.9415.420.982.762.540.70N.A.N.A.N.A.N.A.N.A.N.A.1.25N.A.
77.786.444.030.822.525.0310.39N.A.1.33N.A.N.A.N.A.N.A.2.280.47
84.864.192.455.415.381.822.76N.A.0.67N.A.N.A.N.A.2.013.5013.68
910.535.775.621.175.329.6115.18N.A.1.44N.A.N.A.N.A.N.A.2.136.84
1011.065.389.4641.306.644.643.910.365.31N.A.N.A.1.9415.546.580.79
117.212.482.0814.298.572.631.89N.A.14.3814.6026.2811.2832.174.4011.00
123.620.760.6414.546.533.063.33N.A.16.0922.0218.301.2612.691.165.56
131.000.460.29N.A.2.031.871.90N.A.7.08N.A.N.A.0.983.722.40N.A.
141.880.390.371.297.8812.2915.25N.A.3.42N.A.N.A.8.374.680.221.42
150.520.710.650.570.210.160.33N.A.1.09N.A.N.A.N.A.N.A.0.05N.A.
16N.A.0.000.00N.A.N.A.N.A.N.A.N.A.N.A.N.A.N.A.N.A.N.A.N.A.N.A.
17N.A.0.000.00N.A.N.A.N.A.N.A.N.A.N.A.N.A.N.A.N.A.N.A.N.A.N.A.
18N.A.0.000.00N.A.N.A.N.A.N.A.N.A.N.A.N.A.10.223.88N.A.N.A.N.A.
19N.A.0.300.80N.A.N.A.N.A.N.A.25.35N.A.18.3117.643.04N.A.N.A.N.A.
20N.A.0.000.00N.A.N.A.N.A.N.A.1.04N.A.10.431.113.60N.A.N.A.N.A.
21N.A.10.3010.00N.A.N.A.N.A.N.A.N.A.6.757.4512.9410.07N.A.N.A.N.A.
22N.A.0.000.00N.A.N.A.N.A.N.A.N.A.N.A.N.A.N.A.N.A.N.A.N.A.N.A.
23N.A.0.000.00N.A.N.A.N.A.N.A.N.A.N.A.N.A.N.A.N.A.N.A.N.A.N.A.
24N.A.0.000.00N.A.N.A.3.97N.A.N.A.N.A.N.A.N.A.N.A.N.A.N.A.N.A.
25N.A.3.203.40N.A.N.A.2.14N.A.N.A.N.A.N.A.N.A.N.A.N.A.N.A.N.A.
26N.A.0.601.50N.A.N.A.1.19N.A.N.A.N.A.N.A.N.A.N.A.N.A.N.A.N.A.
27N.A.2.501.80N.A.N.A.2.71N.A.N.A.N.A.N.A.N.A.N.A.N.A.N.A.N.A.
28N.A.0.700.00N.A.N.A.N.A.N.A.29.0612.806.928.432.78N.A.N.A.N.A.
29N.A.0.000.00N.A.N.A.N.A.N.A.33.196.487.001.14N.A.N.A.N.A.N.A.
30N.A.1.001.40N.A.N.A.N.A.N.A.9.52N.A.N.A.N.A.N.A.12.431.25N.A.
31N.A.0.000.20N.A.N.AN.AN.AN.A.N.A.N.A.N.A.N.A.N.A.N.A.N.A.
32N.A.2.001.90N.A.N.AN.AN.AN.A.N.A.N.A.N.A.N.A.N.A.N.A.N.A.
330.825.606.70N.A.7.18N.A.0.020.15N.A.13.273.947.90N.A.1.061.59
Tab.4  VOCs chemical profiles measured in China for important sources/(wt.%)
lumped species No.stationary fuel combustionroad transportnon-road transportindustrialprocesssolvent utilizationstorage and distribution of fossil fuelsothers
15.6–6.83.3–4.03.6–3.90.5–1.0N.A.0.4–1.00.1–0.1
22.8–3.22.9–4.40.4–0.61.4–1.80.5–0.55.4–7.91.5–1.7
30.1–0.20.8–0.90.2–0.33.6–4.42.0–2.21.2–1.70.1–0.1
46.7–7.328.3–29.716.3–17.223.6–2513.1–14.848.9–53.735.3–42.4
517.0–18.29.3–9.527.7–29.81.6–1.9N.A.0.1–0.114.5–17.3
612.1–13.61.5–1.710.7–11.62.1–3.9N.A.N.A.1.5–1.7
74.7–5.16.3–7.515.9–17.51.8–2.70.2–0.30.4–0.50.1–0.1
82.9–3.03.6–3.97.4–7.73.9–4.10.7–0.810.0–11.30.2–0.2
95.6–5.89.7–11.30.7–1.20.4–0.41.1–1.35.0–5.621.9–26.3
109.9–10.94.8–5.18.5–8.74.1–5.21.4–1.52.1–3.80.2–0.4
112.9–3.74.2–5.11.1–1.95.9–8.214.7–158.5–9.60.5–1.1
121.3–1.94.4–4.80.9–1.52.6–3.910.4–11.04.3–4.80.1–0.2
130.4–0.51.9–1.90.3–0.51.4–2.01.1–1.20.5–1.10.2–0.2
140.6–0.810.9–12.21.0–1.81.3–1.92.2–2.41.4–1.80.2–0.3
151.5–2.70.3–0.30.1–0.11.5–2.0N.A.0.2–0.30.1–0.1
16N.A.N.A.N.A.0.1–0.1N.A.N.A.N.A.
17N.A.N.A.N.A.N.A.0.5–0.6N.A.N.A.
18N.A.N.A.N.A.9.9–12.32.5–2.9N.A.N.A.
190.6–0.7N.A.N.A.2.4–3.29.5–10.1N.A.0.2–0.2
20N.A.N.A.N.A.3.6–4.61.4–1.5N.A.N.A.
217.2–8.60.1–0.1N.A.0.4–0.411.8–12.2N.A.0.1–0.1
22N.A.N.A.N.A.N.A.N.A.N.A.N.A.
23N.A.N.A.N.A.N.A.0.1–0.1N.A.2.3–2.6
240.1–0.20.2–0.3N.A.0.2–0.2N.A.N.A.N.A.
252.5–2.90.2–0.2N.A.N.A.N.A.N.A.N.A.
261.1–1.30.1–0.1N.A.0.1–0.1N.A.N.A.N.A.
271.4–1.60.1–0.2N.A.0.1–0.1N.A.N.A.N.A.
280.1–0.1N.A.N.A.1.1–1.810.7–10.9N.A.N.A.
29N.A.N.A.N.A.0.1–0.23.8–4.1N.A.N.A.
301.0–1.2N.A.N.A.7.0–8.62.6–3.3N.A.3.1–9.4
310.2–0.2N.A.N.A.1.6–3.3N.A.N.A.4.2–11.3
321.4–1.7N.A.N.A.0.3–0.33.7–4.7N.A.0.1–0.1
335.0–5.82.5–3.50.9–1.67.6–9.53.4–3.94.1–6.51.5–1.7
Tab.5  VOCs fractional speciation for seven sectors during 2005-2020/(wt. %)
Fig.1  Comparison of POCP for main emission sectors from this study and literature
chemical speciescategory No.emission mass amounts/(Tg·year–1)emission mass proportions
2005201020152020change rate,2005-20202005201020152020change rate,2005-2020
10.520.560.490.48-7.1%2.7%2.5%2.1%1.9%-30.3%
20.420.510.460.458.3%2.2%2.2%2.0%1.7%-18.7%
30.250.330.380.4580.7%1.3%1.5%1.7%1.7%35.5%
43.944.604.494.9826.3%20.3%20.2%19.3%19.2%-5.3%
51.982.081.761.65-16.8%10.2%9.1%7.6%6.4%-37.6%
61.001.040.970.95-5.4%5.2%4.6%4.2%3.7%-29.0%
70.830.940.800.80-3.8%4.3%4.1%3.4%3.1%-27.9%
80.590.680.660.7424.4%3.0%3.0%2.8%2.8%-6.7%
91.271.321.060.96-24.0%6.5%5.8%4.6%3.7%-43.0%
101.061.171.091.125.5%5.5%5.1%4.7%4.3%-20.9%
111.161.491.762.1786.7%6.0%6.6%7.6%8.4%40.0%
120.791.011.161.4176.9%4.1%4.4%5.0%5.4%32.7%
130.210.250.250.2830.1%1.1%1.1%1.1%1.1%-2.4%
140.750.880.690.69-8.9%3.9%3.9%3.0%2.6%-31.6%
150.140.180.220.2575.1%0.7%0.8%0.9%1.0%31.3%
160.000.000.000.0025.9%0.0%0.0%0.0%0.0%-5.6%
170.020.020.030.05155.0%0.1%0.1%0.1%0.2%91.2%
180.460.570.700.8583.5%2.4%2.5%3.0%3.3%37.6%
190.430.640.881.12158.5%2.2%2.8%3.8%4.3%93.8%
200.160.210.300.40158.1%0.8%0.9%1.3%1.6%93.6%
210.881.051.251.4765.7%4.6%4.6%5.4%5.7%24.3%
220.000.000.000.00-0.0%0.0%0.0%0.0%-
230.030.030.030.032.0%0.2%0.1%0.1%0.1%-23.5%
240.010.020.020.0245.3%0.1%0.1%0.1%0.1%8.9%
250.160.160.130.11-35.0%0.8%0.7%0.6%0.4%-51.3%
260.070.070.060.04-35.1%0.4%0.3%0.2%0.2%-51.3%
270.090.090.080.06-32.7%0.5%0.4%0.3%0.2%-49.6%
280.400.590.861.11178.0%2.1%2.6%3.7%4.3%108.5%
290.140.200.300.37167.3%0.7%0.9%1.3%1.4%100.5%
300.430.570.710.89107.2%2.2%2.5%3.1%3.4%55.4%
310.060.090.140.19243.6%0.3%0.4%0.6%0.8%157.7%
320.260.330.370.4160.1%1.3%1.4%1.6%1.6%20.1%
330.881.031.171.4059.1%4.5%4.5%5.0%5.4%19.3%
Total19.422.723.325.933.3%100.0%100.0%100.0%100.0%-
Tab.6  China’s anthropogenic VOCs speciation emissions during 2005-2020
Fig.2  emission contributions of various activity sectors among provinces
provinces2005 year / 2020 year
alkanesalkenes andalkynesaromaticcompoundsalcoholsketonesacidaldehydesestersethersholocarbonsothers
north-eastHeilongjiang30.3/29.931.2/25.017.9/19.85.7/8.34.6/5.50.2/0.22.3/1.41.1/2.20.4/0.61.8/2.65.1/5.0
regionJilin28.8/26.733.6/27.419.3/20.64.5/7.24.3/5.60.2/0.21.9/1.21.6/3.60.5/0.81.5/2.34.5/5.0
Liaoning30.8/27.623.0/18.121.7/22.24.9/7.64.7/5.90.2/0.11.1/0.62.1/2.90.8/0.72.0/2.69.4/12.1
eastern moreBeijing29.9/29.020.1/15.726.5/25.76.6/8.54.1/6.00.2/0.10.5/0.32.8/3.81.5/1.62.8/3.85.5/6.1
developedTianjin34.3/28.619.0/15.122.8/21.55.1/7.43.7/5.70.2/0.10.6/0.42.1/3.10.9/1.05.1/9.36.7/8.4
regionHebei25.0/22.427.3/17.619.8/19.26.8/10.46.6/9.60.2/0.21.2/0.72.1/3.60.5/0.52.0/2.78.9/13.8
Shandong30.5/29.328.4/17.621.1/21.85.4/8.64.5/7.40.2/0.11.0/0.52.2/4.80.6/1.31.9/2.74.6/6.3
Shanghai30.6/26.417.5/15.625.6/24.55.3/7.64.9/6.20.2/0.10.3/0.23.8/5.11.8/2.63.5/4.67.1/7.7
Jiangsu24.0/21.327.0/15.620.3/22.24.3/6.66.2/7.90.2/0.11.9/0.93.0/6.21.3/2.73.8/6.48.7/10.5
Zhejiang24.3/19.517.5/9.023.9/25.36.2/9.37.9/10.00.2/0.10.4/0.25.3/8.61.9/4.03.2/4.29.8/10.3
Fujian28.6/25.323.5/14.424.9/25.94.2/7.57.2/10.90.2/0.20.6/0.34.9/7.50.9/1.11.8/2.63.7/4.9
Guangdong28.7/25.925.5/14.524.0/26.14.7/9.75.6/8.70.2/0.11.1/0.62.7/4.60.7/0.82.0/3.05.4/6.5
centralShanxi23.8/22.422.9/19.737.9/38.52.7/3.21.9/2.00.2/0.20.8/0.50.8/1.20.3/0.45.6/7.03.6/5.5
regionsInner Mongolia25.1/22.529.4/20.419.2/19.88.3/11.85.4/7.80.2/0.21.6/0.91.1/2.10.4/0.42.0/2.97.9/11.7
Anhui23.6/23.737.5/29.417.1/19.33.8/6.05.9/6.40.2/0.23.1/1.81.2/2.90.5/1.21.5/2.16.2/7.5
Jiangxi25.1/21.130.4/19.823.9/26.64.9/8.54.7/6.80.3/0.31.8/0.92.4/6.70.9/2.81.8/2.64.3/4.5
Henan25.9/25.135.2/27.619.6/19.83.8/6.74.8/6.20.2/0.22.1/1.31.1/2.60.4/0.51.9/2.85.4/7.7
Hubei25.8/24.130.6/22.422.0/23.14.6/7.65.2/6.80.2/0.22.2/1.21.9/4.00.9/1.71.9/2.95.4/6.4
Hunan28.7/24.732.5/23.120.8/23.73.7/6.84.1/6.00.3/0.21.5/0.82.1/5.40.9/2.61.6/2.34.2/4.8
westXinjiang34.1/31.226.5/22.916.6/18.312.8/13.92.4/2.90.2/0.21.2/0.71.0/1.90.4/0.52.0/4.23.5/3.7
developingQinghai31.7/29.033.1/28.319.3/20.83.4/5.53.5/4.70.3/0.31.7/1.21.0/2.10.5/0.71.6/3.04.5/5.0
regionsGansu31.6/31.533.6/29.619.3/213.3/4.53.4/3.50.3/0.31.7/1.11.0/1.60.5/0.71.6/2.34.2/4.4
Ningxia28.1/27.034.7/26.020.0/21.42.7/4.83.9/4.30.2/0.21.9/1.21.0/2.20.5/1.22.7/6.24.9/6.0
Shaanxi34.1/33.330.1/23.420.9/22.72.8/5.13.4/4.40.3/0.31.5/0.91.1/2.10.5/0.81.8/2.74.0/4.8
Chongqing20.1/20.334.0/27.019.7/21.74.3/6.97.1/7.70.2/0.23.4/2.22.3/3.91.3/2.01.8/2.36.3/6.5
Sichuan19.3/19.337.1/29.617.8/194.5/7.47.2/7.70.2/0.24.1/2.91.2/2.70.6/0.91.8/3.26.9/7.7
Guizhou21.2/24.637.7/33.120.1/22.13.4/4.36.1/5.50.3/0.33.5/2.30.8/1.50.3/0.41.7/1.75.6/4.7
Yunnan27.0/28.331.8/25.724.3/24.82.5/4.34.1/4.90.3/0.32.0/1.31.3/2.30.5/0.72.2/3.24.6/4.8
Tibet38.5/35.430.3/20.918.8/22.33.0/5.81.9/4.40.6/0.40.8/0.61.8/3.50.8/1.11.0/1.53.0/4.6
Guangxi23.0/23.039.3/32.718.5/20.21.9/4.26.2/7.20.2/0.23.5/2.70.9/2.50.3/0.61.4/1.75.4/5.5
Hainan24.5/21.835.1/26.221.9/24.53.8/8.05.0/7.00.2/0.22.3/1.41.1/2.70.5/0.91.3/2.04.9/5.8
Tab.7  chemical profiles of VOCs emitted from 31 provinces/(wt.%)
Fig.3  POCP ranges of provincial VOCs emissions in 2005 and 2020
Fig.4  provincial POCP-weighted VOCs emissions in 2005 and 2020
1 Wang H X, Kiang C S, Tang X Y, Zhou Z J, Chameides W L. Surface ozone: a likely threat to crops in Yangtze delta of China. Atmospheric Environment , 2005, 39(21): 3843-3850
doi: 10.1016/j.atmosenv.2005.02.057
2 Coleman B K, Lunden M M, Destaillats H, Nazaroff W W. Secondary organic aerosol from ozone-initiated reactions with terpene-rich household products. Atmospheric Environment , 2008, 42(35): 8234-8245
doi: 10.1016/j.atmosenv.2008.07.031
3 Lamorena R B, Lee W. Influence of ozone concentration and temperature on ultra-fine particle and gaseous volatile organic compound formations generated during the ozone-initiated reactions with emitted terpenes from a car air freshener. Journal of Hazardous Materials , 2008, 158(2-3): 471-477
doi: 10.1016/j.jhazmat.2008.01.095 pmid:18336999
4 Lin S, Bell E M, Liu W, Walker R J, Kim N K, Hwang S A. Ambient ozone concentration and hospital admissions due to childhood respiratory diseases in New York State, 1991-2001. Environmental Research , 2008, 108(1): 42-47
doi: 10.1016/j.envres.2008.06.007 pmid:18656858
5 van Zelm R, Huijbregts M A J, den Hollander H A, van Jaarsveld H A, Sauter F J, Struijs J, van Wijnen H J, van de Meent D. European characterization factors for human health damage of PM10 and ozone in life cycle impact assessment. Atmospheric Environment , 2008, 42(3): 441-453
doi: 10.1016/j.atmosenv.2007.09.072
6 Pei C H. Air pollution control in Beijing. In: Procrrdings of Conference on strategic approaches to regional air quality management in China . Beijing: 2005
7 Shao M, Tang X Y, Zhang Y H, Li W. City clusters in China: air and surface water pollution. Frontiers in Ecology and the Environment , 2006, 4(7): 353-361
doi: 10.1890/1540-9295(2006)004[0353:CCICAA]2.0.CO;2
8 Ding A J, Wang T, Thouret V, Cammas J P, Nédélec P. Tropospheric ozone climatology over Beijing: analysis of aircraft data from the MOZAIC program. Atmospheric Chemistry and Physics , 2008, 8(1): 1-13
doi: 10.5194/acp-8-1-2008
9 Geng F H, Tie X X, Xu J M, Zhou G, Peng L, Gao W, Tang X, Zhao C. Characterizations of ozone, NOx, and VOCs measured in Shanghai, China. Atmospheric Environment , 2008, 42(29): 6873-6883
doi: 10.1016/j.atmosenv.2008.05.045
10 Wang T, Wei X L, Ding A J, Poon C N, Lam K S, Li Y S, Chan L Y, Anson M. Increasing surface ozone concentrations in the background atmosphere of Southern China, 1994-2007. Atmospheric Chemistry and Physics , 2009, 9(16): 6217-6226
doi: 10.5194/acp-9-6217-2009
11 Streets D G, Fu J S, Jang C J, Hao J, He K, Tang X, Zhang Y, Wang Z, Li Z, Zhang Q, Wang L, Wang B, Yu C. Air quality during the 2008 Beijing Olympic Games. Atmospheric Environment , 2007, 41(3): 480-492
doi: 10.1016/j.atmosenv.2006.08.046
12 Xu J, Zhang Y H, Fu J S, Zheng S, Wang W. Process analysis of typical summertime ozone episodes over the Beijing area. Science of the Total Environment , 2008, 399(1-3): 147-157
doi: 10.1016/j.scitotenv.2008.02.013 pmid:18455756
13 Zhang Y H, Su H, Zhong L J, Cheng Y F, Zeng L M, Wang X S, Xiang Y R, Wang J L, Gao D F, Shao M. Regional ozone pollution and observation-based approach for analyzing ozone-precursor relationship during the PRIDE-PRD2004 campaign. Atmospheric Environment , 2008, 42(25): 6203-6218
doi: 10.1016/j.atmosenv.2008.05.002
14 Shao M, Zhang Y H, Zeng L M, Tang X, Zhang J, Zhong L, Wang B. Ground-level ozone in the Pearl River Delta and the roles of VOC and NO(x) in its production. Journal of Environmental Management , 2009, 90(1): 512-518
doi: 10.1016/j.jenvman.2007.12.008 pmid:18207632
15 Cheng H R, Guo H, Saunders S M, Lam S H M, Jiang F, Wang X M, Simpson I J, Blake D R, Louie P K K, Wang T J. Assessing photochemical ozone formation in the Pearl River Delta with a photochemical trajectory model. Atmospheric Environment , 2010, 44(34): 4199-4208
doi: 10.1016/j.atmosenv.2010.07.019
16 Tonooka Y, Kannari A, Higashino H, Murano K. NMVOCs and CO emission inventory in East Asia. Water, Air, and Soil Pollution , 2001, 130(1/4): 199-204
doi: 10.1023/A:1013890513856
17 Klimont Z, Streets D G, Gupta S, Cofala J, Lixin F, Ichikawa Y. Anthropogenic emissions of non-methane volatile organic compounds in China. Atmospheric Environment , 2002, 36(8): 1309-1322
doi: 10.1016/S1352-2310(01)00529-5
18 Streets D G, Bond T C, Carmichael G R, Fernandes S D, Fu Q, He D, Klimont Z, Nelson S M, Tsai N Y, Wang M Q, Woo J H, Yarber K F. An inventory of gaseous and primary aerosol emission in Asia in the year 2000. Journal of Geophysical Research , 2003, 108(D21): 8809-8832
doi: 10.1029/2002JD003093
19 Bo Y, Cai H, Xie S D. Spatial and temporal variation of emission inventories for historical anthropogenic NMVOCs in China. Atmospheric Chemistry and Physics Discussion , 2008, 8(23): 1519-1566
20 Liu J F, Zhao J, Li T T, Bai Y H, Liu Z R. Establishment of Chinese anthropogenic source volatile organic compounds emission inventory. China Environmental Science , 2008, 28(6): 496-500 (In Chinese)
21 Wei W, Wang S X, Chatani S, Klimont Z, Cofala J, Hao J. Emission and speciation of non-methane volatile organic compounds from anthropogenic sources in China. Atmospheric Environment , 2008, 42(20): 4976-4988
doi: 10.1016/j.atmosenv.2008.02.044
22 Wei W, Wang S X, Hao J M, Cheng S. Projection of anthropogenic volatile organic compounds (VOCs) emissions in China for the period 2010-2020. Atmospheric Environment , 2011, 45(38): 6863-6871
doi: 10.1016/j.atmosenv.2011.01.013
23 Derwent R G, Jenkin M E, Passant N R, Pilling M J. Photochemical ozone creation potentials (POCPs) for different emission sources of organic compounds under European conditions estimated with a Master Chemical Mechanism. Atmospheric Environment , 2007, 41(12): 2570-2579
doi: 10.1016/j.atmosenv.2006.11.019
24 Liu X H, Zhang Y, Cheng S H, Xing J, Zhang Q, Streets D G, Jang C, Wang W X, Hao J M. Understanding of regional air pollution over China using CMAQ, part I performance evaluation and seasonal variation. Atmospheric Environment , 2010, 44(20): 2415-2426
doi: 10.1016/j.atmosenv.2010.03.035
25 Altenstdet J, Pleijel K. POCP for individual VOC under European Condition [R]. IVL Swedish Environmental Research Institute . 1998
26 Zhang Q, Streets D G, He K B, Wang Y X, Richter A, Burrows J P, Uno I, Jang C J, Chen D, Yao Z L, Lei Y. NOx emission trends for China, 1995-2004: The view from the ground and the view from space. Journal of Geophysical Research , 2007, 112(D2): 1-18
27 Wang S X, Xing J, Chatani S, Hao J, Klimont Z, Cofala J, Amann M. Verification of anthropogenic emissions of China by satellite and ground observations. Atmospheric Environment , 2011, 45(35): 6347-6358
doi: 10.1016/j.atmosenv.2011.08.054
28 Huang C, Chen C H, Li L, Cheng Z, Wang H L, Huang H Y, Streets D G, Wang Y J, Zhang G F, Chen Y R. Emission inventory of anthropogenic air pollutants and VOC species in the Yangtze River Delta region, China. Atmospheric Chemistry and Physics , 2011, 11(9): 4105-4120
doi: 10.5194/acp-11-4105-2011
29 Wang S X, Wei W, Du L, Li G, Hao J. Characteristics of gaseous pollutants from biofuel-stoves in rural China. Atmospheric Environment , 2009, 43(27): 4148-4154
doi: 10.1016/j.atmosenv.2009.05.040
30 Zhang J F, Smith K R, Ma Y, Ye S, Jiang F, Qi W, Liu P, Khalil M A K, Rasmussen R A, Thorneloe S A. Greenhouse gases and other airborne pollutants from household stoves in China. Atmospheric Environment , 2000, 34(26): 4537-4549
doi: 10.1016/S1352-2310(99)00450-1
31 Liu Y, Shao M, Fu L L, Lu S, Zeng L, Tang D. Source profiles of volatile organic compounds (VOCs) measured in China: Part I. Atmospheric Environment , 2008, 42(25): 6247-6260
doi: 10.1016/j.atmosenv.2008.01.070
32 Fu L L, Shao M, Liu Y, Liu Y, Lu S H, Tang D G. Tunnel experimental study on the emission factors of volatile organic compounds (VOCs) from vehicles. Acta Scientiae Circumstantiae , 2005, 25(7): 879-885 (in Chinese)
33 Liang B S, Zhou Y. Study on emission characteristics of volatile organic compounds in the exhaust of different types of vehicles. Environmental Monitoring in China , 2005, 21(1): 8-11 (in Chinese)
34 Yuan B, Shao M, Lu S H, Wang B. Source profiles of volatile organic compounds associated with solvent use in Beijing, China. Atmospheric Environment , 2010, 44(15): 1919-1926
doi: 10.1016/j.atmosenv.2010.02.014
35 He Q S, Wang X M, Zhao L R,Sheng G Y,Fu J M. Preliminary study on profiles of VOCs emitted from coking. Environmental Monitoring in China , 2005, 21(1): 61-66 (in Chinese)
36 Cheng P, Zhang W J, Chu Y N. Analysis of Petrol and Diesel Vapor Using Selective Ion Flow Tube/Mass Spectrometry. Chinese Journal of Analytical Chemistry , 2003, 31(5): 548-551 (in Chinese)
37 Lu S H, Bai Y H, Zhang G S, M J. Study on the characteristics of VOCs source profiles of vehicle exhaust and gasoline emission. Acta Scientiarum Naturalium Universitatis Pekinensis , 2003, 39(4): 507-512 (in Chinese)
38 Xie J X. A study of the indoor air organic pollution affected by environment tobacco smoke. Desseration for the Doctoral Degree . Guangzhou: Graduate University of Chinese Academy of Science, 2004 (in Chinese)
[1] Fengping Hu, Yongming Guo. Health impacts of air pollution in China[J]. Front. Environ. Sci. Eng., 2021, 15(4): 74-.
[2] Chi Zhang, Wenhui Kuang, Jianguo Wu, Jiyuan Liu, Hanqin Tian. Industrial land expansion in rural China threatens environmental securities[J]. Front. Environ. Sci. Eng., 2021, 15(2): 29-.
[3] Jiuhui Qu, Hongchen Wang, Kaijun Wang, Gang Yu, Bing Ke, Han-Qing Yu, Hongqiang Ren, Xingcan Zheng, Ji Li, Wen-Wei Li, Song Gao, Hui Gong. Municipal wastewater treatment in China: Development history and future perspectives[J]. Front. Environ. Sci. Eng., 2019, 13(6): 88-.
[4] Wenjing Lu, Yawar Abbas, Muhammad Farooq Mustafa, Chao Pan, Hongtao Wang. A review on application of dielectric barrier discharge plasma technology on the abatement of volatile organic compounds[J]. Front. Environ. Sci. Eng., 2019, 13(2): 30-.
[5] Dong Huang, Xiuhong Liu, Songzhu Jiang, Hongchen Wang, Junyan Wang, Yuankai Zhang. Current state and future perspectives of sewer networks in urban China[J]. Front. Environ. Sci. Eng., 2018, 12(3): 2-.
[6] Xiaolong Song, Jingwei Wang, Jianxin Yang, Bin Lu. An updated review and conceptual model for optimizing WEEE management in China from a life cycle perspective[J]. Front. Environ. Sci. Eng., 2017, 11(5): 3-.
[7] Yan Ma, Xiaoming Du, Yi Shi, Deyi Hou, Binbin Dong, Zhu Xu, Huiying Li, Yunfeng Xie, Jidun Fang, Zheng Li, Yunzhe Cao, Qingbao Gu, Fasheng Li. Engineering practice of mechanical soil aeration for the remediation of volatile organic compound-contaminated sites in China: Advantages and challenges[J]. Front. Environ. Sci. Eng., 2016, 10(6): 6-.
[8] He NIU,Ziwei MO,Min SHAO,Sihua LU,Shaodong XIE. Screening the emission sources of volatile organic compounds (VOCs) in China by multi-effects evaluation[J]. Front. Environ. Sci. Eng., 2016, 10(5): 1-.
[9] Meng Gao,Gregory R. Carmichael,Yuesi Wang,Dongsheng Ji,Zirui Liu,Zifa Wang. Improving simulations of sulfate aerosols during winter haze over Northern China: the impacts of heterogeneous oxidation by NO2[J]. Front. Environ. Sci. Eng., 2016, 10(5): 16-.
[10] Hallvard Ødegaard. A road-map for energy-neutral wastewater treatment plants of the future based on compact technologies (including MBBR)[J]. Front. Environ. Sci. Eng., 2016, 10(4): 2-.
[11] Wenyan Wang, Wei Ouyang, Fanghua Hao, Yun Luan, Bo Hu. Spatial impacts of climate factors on regional agricultural and forestry biomass resources in north-eastern province of China[J]. Front. Environ. Sci. Eng., 2016, 10(4): 17-.
[12] Guoxia MA,Jinnan WANG,Fang YU,Yanshen ZHANG,Dong CAO. An assessment of the potential health benefits of realizing the goals for PM10 in the updated Chinese Ambient Air Quality Standard[J]. Front. Environ. Sci. Eng., 2016, 10(2): 288-298.
[13] Fei LI,Suocheng DONG,Fujia LI,Libiao YANG. Is there an inverted U-shaped curve? Empirical analysis of the Environmental Kuznets Curve in agrochemicals[J]. Front. Environ. Sci. Eng., 2016, 10(2): 276-287.
[14] Shou ZHAO,Dongxin WANG,Chenghong FENG,Ying WANG,Zhenyao SHEN. Sequence of the main geochemical controls on the Cu and Zn fractions in the Yangtze River estuarine sediments[J]. Front. Environ. Sci. Eng., 2016, 10(1): 19-27.
[15] Hengyi DUAN,Xiaotu LIU,Meilin YAN,Yatao WU,Zhaorong LIU. Characteristics of carbonyls and volatile organic compounds (VOCs) in residences in Beijing, China[J]. Front. Environ. Sci. Eng., 2016, 10(1): 73-84.
Viewed
Full text


Abstract

Cited

  Shared   
  Discussed