|
|
|
Land use and land cover classification using Chinese GF-2 multispectral data in a region of the North China Plain |
Kun JIA1,2, Jingcan LIU1,2, Yixuan TU1,2, Qiangzi LI3( ), Zhiwei SUN4, Xiangqin WEI3, Yunjun YAO1,2, Xiaotong ZHANG1,2 ), Zhiwei SUN4, Xiangqin WEI3, Yunjun YAO1,2, Xiaotong ZHANG1,2 |
1. State Key Laboratory of Remote Sensing Science, Jointly Sponsored by Beijing Normal University and Institute of Remote Sensing and Digital Earth of Chinese Academy of Sciences, Beijing 100875, China
2. Beijing Engineering Research Center for Global Land Remote Sensing Products, Faculty of Geographical Science, Beijing Normal University, Beijing 100875, China
3. Institute of Remote Sensing and Digital Earth, Chinese Academy of Sciences, Beijing 100101, China
4. Beijing Geoway Times Software Technology Co., Ltd., Beijing 100043, China |
|
|
|
|
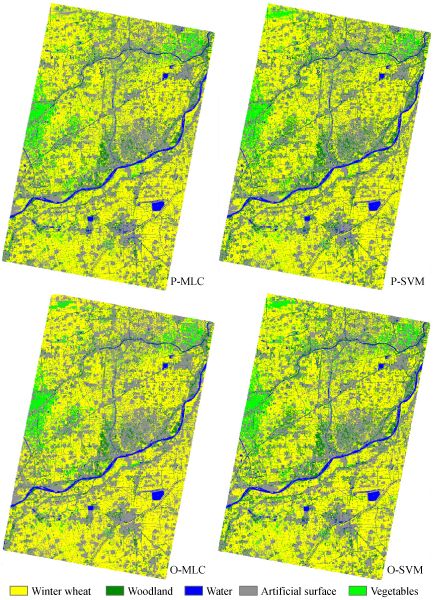
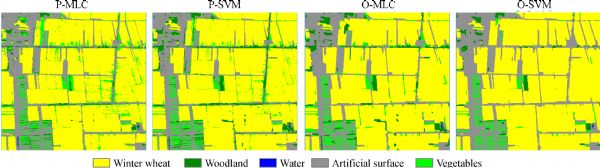
Abstract The newly launched GF-2 satellite is now the most advanced civil satellite in China to collect high spatial resolution remote sensing data. This study investigated the capability and strategy of GF-2 multispectral data for land use and land cover (LULC) classification in a region of the North China Plain. The pixel-based and object-based classifications using maximum likelihood (MLC) and support vector machine (SVM) classifiers were evaluated to determine the classification strategy that was suitable for GF-2 multispectral data. The validation results indicated that GF-2 multispectral data achieved satisfactory LULC classification performance, and object-based classification using the SVM classifier achieved the best classification accuracy with an overall classification accuracy of 94.33% and kappa coefficient of 0.911. Therefore, considering the LULC classification performance and data characteristics, GF-2 satellite data could serve as a valuable and reliable high-resolution data source for land surface monitoring. Future works should focus on improving LULC classification accuracy by exploring more classification features and exploring the potential applications of GF-2 data in related applications.
|
| Keywords
land use and land cover
classification
GF-2
North China Plain
multispectral data
|
|
Corresponding Author(s):
Qiangzi LI
|
|
Just Accepted Date: 29 November 2018
Online First Date: 25 December 2018
Issue Date: 16 May 2019
|
|
| 1 |
EAdam, O Mutanga, JOdindi, E MAbdel-Rahman (2014). Land-use/cover classification in a heterogeneous coastal landscape using RapidEye imagery: evaluating the performance of random forest and support vector machines classifiers. Int J Remote Sens, 35(10): 3440–3458
https://doi.org/10.1080/01431161.2014.903435
|
| 2 |
MAguilar, F Bianconi, FAguilar, IFernández (2014). Object-based greenhouse classification from GeoEye-1 and WorldView-2 stereo imagery. Remote Sens, 6(5): 3554–3582
https://doi.org/10.3390/rs6053554
|
| 3 |
MBaatz, M Schäpe (2000). Multiresolution segmentation- An optimization approach for high quality multi-scale image segmentation. In: Strobl J, Blaschke T, Griesebner G, eds. Angewandte Geographische Informations-Verarbeitung XII. Karlsruhe: Wichmann Verlag, 12–23
|
| 4 |
U CBenz, P Hofmann, GWillhauck, ILingenfelder, MHeynen (2004). Multi-resolution, object-oriented fuzzy analysis of remote sensing data for GIS-ready information. ISPRS J Photogramm Remote Sens, 58(3–4): 239–258
https://doi.org/10.1016/j.isprsjprs.2003.10.002
|
| 5 |
C J CBurges (1998). A tutorial on support vector machines for pattern recognition. Data Min Knowl Discov, 2(2): 121–167
https://doi.org/10.1023/A:1009715923555
|
| 6 |
JChen, J Chen, ALiao, XCao, L Chen, XChen, CHe, G Han, SPeng, MLu, W Zhang, XTong, JMills (2015). Global land cover mapping at 30 m resolution: a POK-based operational approach. ISPRS J Photogramm Remote Sens, 103: 7–27
https://doi.org/10.1016/j.isprsjprs.2014.09.002
|
| 7 |
R GCongalton, KGreen (1999). Assessing the Accuracy of Remotely Sensed Data: Principles and Practices. Florida: Lewis Publishers
|
| 8 |
TCooley, G P Anderson, G W Felde, M L Hoke, A J Ratkowski, J H Chetwynd, J A Gardner, S M Adler-Golden, M W Matthew, A Berk, L SBernstein, P KAcharya, DMiller, PLewis (2002). FLAASH, a MODTRAN4-based atmospheric correction algorithm, its application and validation. In: 2002 IEEE International Geoscience and Remote Sensing Symposium & 24th Canadian Symposium on Remote Sensing. Toronto, Canada: IEEE Press
|
| 9 |
R ODuda, P E Hart (1973). Pattern Classification and Scene Analysis. New York: Wiley
|
| 10 |
G MFoody (2009). Classification accuracy comparison: hypothesis tests and the use of confidence intervals in evaluations of difference, equivalence and non-inferiority. Remote Sens Environ, 113(8): 1658–1663
https://doi.org/10.1016/j.rse.2009.03.014
|
| 11 |
G MFoody (2013). Ground reference data error and the mis-estimation of the area of land cover change as a function of its abundance. Remote Sens Lett, 4(8): 783–792
https://doi.org/10.1080/2150704X.2013.798708
|
| 12 |
G MFoody, N A Campbell, N M Trodd, T F Wood (1992). Derivation and applications of probabilistic measures of class membership from the maximum-likelihood classification. Photogramm Eng Remote Sensing, 58: 1335–1341
|
| 13 |
G MFoody, A Mathur (2004). A relative evaluation of multiclass image classification by support vector machines. IEEE Trans Geosci Remote Sens, 42(6): 1335–1343
https://doi.org/10.1109/TGRS.2004.827257
|
| 14 |
M AFriedl, C E Brodley (1997). Decision tree classification of land cover from remotely sensed data. Remote Sens Environ, 61(3): 399–409
https://doi.org/10.1016/S0034-4257(97)00049-7
|
| 15 |
RGebbers, V I Adamchuk (2010). Precision agriculture and food security. Science, 327(5967): 828–831
https://doi.org/10.1126/science.1183899
|
| 16 |
PGong, J Wang, LYu, Y CZhao, Y YZhao, LLiang, Z GNiu, X MHuang, H HFu, SLiu, C C Li, X Y Li, W Fu, C XLiu, YXu, X Y Wang, Q Cheng, L YHu, W BYao, HZhang, PZhu, Z Y Zhao, H Y Zhang, Y M Zheng, L Y Ji, Y W Zhang, H Chen, AYan, J HGuo, LWang, X J Liu, T T Shi, M H Zhu, Y L Chen, G W Yang, P Tang, BXu, CGiri, N Clinton, Z LZhu, JChen, J Chen (2013). Finer resolution observation and monitoring of global land cover: first mapping results with Landsat TM and ETM+ data. Int J Remote Sens, 34(7): 2607–2654
https://doi.org/10.1080/01431161.2012.748992
|
| 17 |
PGong, L Yu, CLi, JWang, L Liang, XLi, LJi, Y Bai, YCheng, ZZhu (2016). A new research paradigm for global land cover mapping. Ann GIS, 22(2): 87–102 doi:10.1080/19475683.2016.1164247
|
| 18 |
M CHansen, R S Defries, J R G Townshend, R Sohlberg (2000). Global land cover classification at 1km spatial resolution using a classification tree approach. Int J Remote Sens, 21(6–7): 1331–1364
https://doi.org/10.1080/014311600210209
|
| 19 |
KJia, Q Z Li, Y C Tian, B F Wu, F F Zhang, J H Meng (2012). Crop classification using multi-configuration SAR data in the North China Plain. Int J Remote Sens, 33(1): 170–183
https://doi.org/10.1080/01431161.2011.587844
|
| 20 |
KJia, S Liang, NZhang, X QWei, X FGu, XZhao, Y J Yao, X Xie (2014a). Land cover classification of finer resolution remote sensing data integrating temporal features from time series coarser resolution data. ISPRS J Photogramm Remote Sens, 93: 49–55
https://doi.org/10.1016/j.isprsjprs.2014.04.004
|
| 21 |
KJia, X Q Wei, X F Gu, Y J Yao, X H Xie, B Li (2014b). Land cover classification using Landsat 8 Operational Land Imager data in Beijing, China. Geocarto Int, 29(8): 941–951
https://doi.org/10.1080/10106049.2014.894586
|
| 22 |
KJia, B F Wu, Q Z Li (2013). Crop classification using HJ satellite multispectral data in the North China Plain. J Appl Remote Sens, 7(1): 073576
https://doi.org/10.1117/1.JRS.7.073576
|
| 23 |
KJia, B F Wu, Y C Tian, Y Zeng, Q ZLi (2011). Vegetation classification method with biochemical composition estimated from remote sensing data. Int J Remote Sens, 32(24): 9307–9325
https://doi.org/10.1080/01431161.2011.554454
|
| 24 |
QLi, X Cao, KJia, MZhang, QDong (2014). Crop type identification by integration of high-spatial resolution multispectral data with features extracted from coarse-resolution time-series vegetation index data. Int J Remote Sens, 35(16): 6076–6088
https://doi.org/10.1080/01431161.2014.943325
|
| 25 |
SLiang (2008). Advances in Land Remote Sensing System, Modeling Inversion and Application. Dordrecht: Springer
|
| 26 |
J YLiu, M L Liu, D F Zhuang, Z X Zhang, X Z Deng (2003). Study on spatial pattern of land-use change in China during 1995–2000. Sci China Ser D Earth Sci, 46: 373–384
|
| 27 |
DLu, Q Weng (2007). A survey of image classification methods and techniques for improving classification performance. Int J Remote Sens, 28(5): 823–870
https://doi.org/10.1080/01431160600746456
|
| 28 |
LMa, M Li, XMa, LCheng, PDu, Y Liu (2017). A review of supervised object-based land-cover image classification. ISPRS J Photogramm Remote Sens, 130: 277–293
https://doi.org/10.1016/j.isprsjprs.2017.06.001
|
| 29 |
AMathur, G Foody (2008). Crop classification by support vector machine with intelligently selected training data for an operational application. Int J Remote Sens, 29(8): 2227–2240
https://doi.org/10.1080/01431160701395203
|
| 30 |
S NMiller, D Phillip Guertin , D CGoodrich (2007). Hydrologic modeling uncertainty resulting from land cover misclassification. J Am Water Resour Assoc, 43(4): 1065–1075
https://doi.org/10.1111/j.1752-1688.2007.00088.x
|
| 31 |
GMountrakis, J Im, COgole (2011). Support vector machines in remote sensing: a review. ISPRS J Photogramm Remote Sens, 66(3): 247–259
https://doi.org/10.1016/j.isprsjprs.2010.11.001
|
| 32 |
MPal, G M Foody (2012). Evaluation of SVM, RVM and SMLR for accurate image classification with limited ground data. IEEE J Sel Top Appl Earth Obs Remote Sens, 5(5): 1344–1355
https://doi.org/10.1109/JSTARS.2012.2215310
|
| 33 |
MPal, P M Mather (2005). Support vector machines for classification in remote sensing. Int J Remote Sens, 26(5): 1007–1011
https://doi.org/10.1080/01431160512331314083
|
| 34 |
S WRunning (2008). Ecosystem disturbance, carbon, and climate. Science, 321(5889): 652–653
https://doi.org/10.1126/science.1159607
|
| 35 |
MSchmidt, M Pringle, RDevadas, RDenham, DTindall (2016). A framework for large-area mapping of past and present cropping activity using seasonal Landsat images and time series metrics. Remote Sens, 8(4): 312
https://doi.org/10.3390/rs8040312
|
| 36 |
BTso, P M Mather (2001). Classification Methods for Remotely Sensed Data. London: Taylor and Francis
|
| 37 |
LYan, D P Roy (2016). Conterminous United States crop field size quantification from multi-temporal Landsat data. Remote Sens Environ, 172: 67–86
https://doi.org/10.1016/j.rse.2015.10.034
|
| 38 |
JYang, P Gong, RFu, M HZhang, J MChen, S LLiang, BXu, J C Shi, R Dickinson (2013). The role of satellite remote sensing in climate change studies. Nat Clim Chang, 3(10): 875–883
https://doi.org/10.1038/nclimate1908
|
| 39 |
LYu, J Su, CLi, LWang, Z Luo, BYan (2018). Improvement of moderate resolution land use and land cover classification by introducing adjacent region features. Remote Sens, 10(3): 414
https://doi.org/10.3390/rs10030414
|
| 40 |
HZhang, Q Li, JLiu, JShang, XDu, L Zhao, NWang, TDong (2017). Crop classification and acreage estimation in North Korea using phenology features. GIsci Remote Sens, 54(3): 381–406
https://doi.org/10.1080/15481603.2016.1276255
|
| 41 |
LZhang, K Jia, X SLi, Q ZYuan, X FZhao (2014). Multi-scale segmentation approach for object-based land-cover classification using high-resolution imagery. Remote Sens Lett, 5(1): 73–82
https://doi.org/10.1080/2150704X.2013.875235
|
| 42 |
M WZhang, Q B Zhou, Z X Chen, J Liu, YZhou, C FCai (2008). Crop discrimination in northern China with double cropping systems using Fourier analysis of time-series MODIS data. Int J Appl Earth Obs Geoinf, 10(4): 476–485
https://doi.org/10.1016/j.jag.2007.11.002
|
| 43 |
LZhong, L Hu, LYu, PGong, G S Biging (2016). Automated mapping of soybean and corn using phenology. ISPRS J Photogramm Remote Sens, 119: 151–164
https://doi.org/10.1016/j.isprsjprs.2016.05.014
|
|
Viewed |
|
|
|
Full text
|
|
|
|
|
Abstract
|
|
|
|
|
Cited |
|
|
|
|
| |
Shared |
|
|
|
|
| |
Discussed |
|
|
|
|