|
|
|
Distribution of snow depth variability |
S.R. FASSNACHT1,2,3,4( ), K.S.J. BROWN1, E.J. BLUMBERG5, J.I. LÓPEZ MORENO6, T.P. COVINO1,3, M. KAPPAS4, Y. HUANG7, V. LEONE8, A.H. KASHIPAZHA1 ), K.S.J. BROWN1, E.J. BLUMBERG5, J.I. LÓPEZ MORENO6, T.P. COVINO1,3, M. KAPPAS4, Y. HUANG7, V. LEONE8, A.H. KASHIPAZHA1 |
1. ESS-Watershed Science, Colorado State University, Fort Collins, CO 80523-1476, USA
2. Cooperative Institute for Research in the Atmosphere, Fort Collins, CO 80523-1375, USA
3. Natural Resources Ecology Laboratory, Fort Collins, CO 80523-1499, USA
4. Geographisches Institut, Georg-August-Universität Göttingen, 37077 Göttingen, Deutschland
5. Geosciences, Colorado State University, Fort Collins, CO 80523-1482, USA
6. Instituto Pirenaico de Ecología, CSIC, Campus de Aula Dei, 50080 Zaragoza, España
7. State Key Laboratory of Hydroscience and Engineering, Tsinghua University, Beijing 100084, China
8. Seconda Università degli Studi di Napoli, Viale Abramo Lincoln, 5, 81100 Caserta CE, Italia |
|
|
|
|
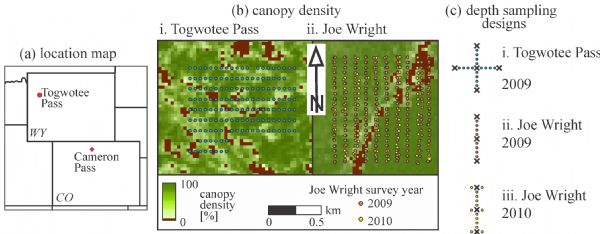
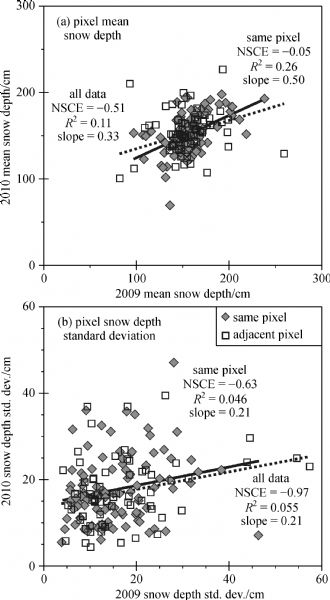
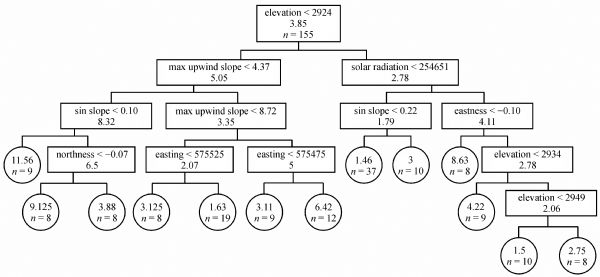
Abstract Snow depth is the easiest snowpack property to measure in the field and is used to estimate the distribution of snow for quantifying snow storage. Often the mean of three snow depth measurements is used to represent snow depth at a location. This location is used as a proxy for an area, typically a digital elevation model (DEM) or remotely sensed pixel. Here, 11, 17, or 21 snow depth measurements were used to represent the mean snow depth of a 30-m DEM pixel. Using the center snow depth measurement for each sampling set was not adequate to represent the pixel mean, and while the use of three snow depth measurements improved the estimate of mean, there is still large error for some pixels. These measurements were then used to determine the variability of snow depth across a pixel. Estimating variability from few points rather than all in a measurement was not sufficient. The sampling size was increased from one to the total per pixel (11, 17, or 21) to determine how many point samples were necessary to approximate the mean snow depth per pixel within five percent. Binary regression trees were constructed to determine which terrain and canopy variables dictated the spatial distribution of the snow depth, the standard deviation of snow depth, and the sample size to within 5% of the mean per pixel. One location was measured in two years just prior to peak accumulation, and it is shown that there was little to no inter-annual consistency in the mean or standard deviation.
|
| Keywords
uncertainty
sampling
binary regression trees
snow telemetry
|
|
Corresponding Author(s):
S.R. FASSNACHT
|
|
Just Accepted Date: 14 May 2018
Online First Date: 21 June 2018
Issue Date: 20 November 2018
|
|
| 1 |
Bales R C, Molotch N P, Painter T H, Dettinger M, Rice R, Dozier J (2006). Mountain hydrology of the western United States. Water Resour Res, 42(8): W08432
https://doi.org/10.1029/2005WR004387
|
| 2 |
Balk B, Elder K (2000). Combining binary decision tree and geostatistical methods to estimate snow distribution in a mountain watershed. Water Resour Res, 36(1): 13–26
https://doi.org/10.1029/1999WR900251
|
| 3 |
Blöschl G (1999). Scaling issues in snow hydrology. Hydrol Processes, 13(14–15): 2149–2175
https://doi.org/10.1002/(SICI)1099-1085(199910)13:14/15<2149::AID-HYP847>3.0.CO;2-8
|
| 4 |
Debarbieux B, Price M F (2012). Mountain regions: a global common good? Mt Res Dev, 32(S1): S7–S11
https://doi.org/10.1659/MRD-JOURNAL-D-11-00034.S1
|
| 5 |
Deems J S, Fassnacht S R, Elder K J (2006). Fractal distribution of snow depth from LiDAR data. J Hydrometeorol, 7(2): 285–297
https://doi.org/10.1175/JHM487.1
|
| 6 |
Deems J S, Fassnacht S R, Elder K J (2008). Interannual consistency in fractal snow depth patterns at two Colorado mountain sites. J Hydrometeorol, 9(5): 977–988
https://doi.org/10.1175/2008JHM901.1
|
| 7 |
Dingman S, Seely-Reynolds D, Reynold D (1988). Application of Kriging to estimating mean annual precipitation in a region of orographic influence. J Am Water Resour Assoc, 24(2): 329–339
https://doi.org/10.1111/j.1752-1688.1988.tb02991.x
|
| 8 |
Dozier J, Frew J (1990). Rapid calculation of terrain parameters for radiation modeling from digital elevation data. IEEE Trans Geosci Remote Sens, 28(5): 963–969
https://doi.org/10.1109/36.58986
|
| 9 |
Elder K, Dozier J, Michaelsen J (1991). Snow accumulation and distribution in an alpine watershed. Water Resour Res, 27(7): 1541–1552
https://doi.org/10.1029/91WR00506
|
| 10 |
Elder K J, Cline D W, Liston G E, Armstrong R (2009). NASA cold land processes experiment (CLPX 2002–2003): field measurements of snowpack properties and soil moisture. J Hydrometeorol, 10(1): 320–329
https://doi.org/10.1175/2008JHM877.1
|
| 11 |
Erickson T, Williams M, Winstral A (2005). Persistence of topographic controls on the spatial distribution of snow in rugged mountain terrain, Colorado, United States. Water Resour Res, 41(4): W04014
https://doi.org/10.1029/2003WR002973
|
| 12 |
Erxleben J, Elder K, Davis R (2002). Comparison of spatial interpolation methods for estimating snow distribution in the Colorado Rocky Mountains. Hydrol Processes, 16(18): 3627–3649
https://doi.org/10.1002/hyp.1239
|
| 13 |
Fassnacht S R, Deems J S (2006). Measurement sampling and scaling for deep montane snow depth data. Hydrol Processes, 20(4): 829–838
https://doi.org/10.1002/hyp.6119
|
| 45 |
Fassnacht S R, Deitemeyer D C, Venable N B H (2014). Capitaliziing on the daily time step of snow telemetry data to model the snowmelt components of the hydrograph for small watersheds. Hydrological Processes, 28(16): 4654–4668
|
| 14 |
Fassnacht S R, Dressler K A, Bales R C (2003). Snow water equivalent interpolation for the Colorado River Basin from snow telemetry (SNOTEL) data. Water Resour Res, 39(8): 1208
https://doi.org/10.1029/2002WR001512
|
| 15 |
Fassnacht S R, Dressler K A, Hultstrand D M, Bales R C, Patterson G G (2012). Temporal inconsistencies in coarse-scale snow water equivalent patterns: Colorado River Basin snow telemetry-topography regressions. Pirineos, 167(0): 165–185
https://doi.org/10.3989/Pirineos.2012.167008
|
| 16 |
Fassnacht S R, Heun C, López Moreno J I, Latron J (2010). Variability of snow density measurements in the Esera valley, Pyrenees mountains, Spain. Cuadernos de Investigación Geográfica, 36(1): 59–72
https://doi.org/10.18172/cig.1227
|
| 17 |
Fassnacht S R, Williams M W, Corrao M V (2009). Changes in the surface roughness of snow from millimetre to metre scales. Ecol Complex, 6(3): 221–229
https://doi.org/10.1016/j.ecocom.2009.05.003
|
| 18 |
Fassnacht S R, Wyss D, Heering S M (2017). Räumliches Denken – ein Beispiel im Schnee / A Spatial Thinking Research-Didactic Example in Snow. Geoöko, 37(3-4)
|
| 19 |
Hultstrand D, Fassnacht S R, Stednick J (2006). Geostatistical methods for estimating snowmelt contribution to the alpine water balance. Proceedings of the Annual Western Snow Conference, (Las Cruces NM), 74: 149–154
|
| 20 |
Kashipazha A H (2012). Practical snow depth sampling around six snow telemetry (SNOTEL) stations in Colorado and Wyoming, United States. Dissertation for M.S. degree. Watershed Science Program, Colorado State University, Fort Collins, Colorado USA
|
| 21 |
Logan L (1973). Basin-wide water equivalent estimation from snowpack depth measurements. In: Role of Snow and Ice in Hydrology. IAHS AIHS Publ. 107: 864–884
|
| 22 |
López–Moreno J I, Fassnacht S R, Begueria S, Latron J (2011). Variability of snow depth at the plot scale: implications for mean depth estimation and sampling strategies. Cryosphere, 5(3): 617–629
https://doi.org/10.5194/tc-5-617-2011
|
| 23 |
López-Moreno J I, Fassnacht S R, Heath J T, Musselman K, Revuelto J, Latron J, Morán-Tejeda E, Jonas T (2013). Small scale spatial variability of snow density and depth over complex alpine terrain: implications for estimating snow water equivalent. Adv Water Resour, 55: 40–52
https://doi.org/10.1016/j.advwatres.2012.08.010
|
| 24 |
López-Moreno J I, Nogués Bravo D (2006). Interpolating local snow depth data: an evaluation of methods. Hydrol Processes, 20(10): 2217–2232
https://doi.org/10.1002/hyp.6199
|
| 25 |
López-Moreno J I, Revuelto J, Fassnacht S R, Azorín-Molina C, Vicente-Serrano S M, Morán-Tejeda E, Sexstone G A (2015). Snowpack variability across various spatio-temporal resolutions. Hydrol Processes, 29(6): 1213–1224
https://doi.org/10.1002/hyp.10245
|
| 26 |
Meiman J R (1968). Snow accumulation related to elevation, aspect, and forest canopy. In Proceedings of Snow Hydrology Workshop Seminar, Canadian National Committee of the International Hydrological Decade, Fredericton NB, pp. 35–47
|
| 27 |
Meromy L, Molotch N, Link T, Fassnacht S R, Rice R (2013). Subgrid variability of snow water equivalent at operational snow stations in the western USA. Hydrol Processes, 27(17): 2383–2400
https://doi.org/10.1002/hyp.9355
|
| 28 |
Molotch N, Brooks P, Burns S, Litvak M, Monson R, McConnell J, Musselman K (2009). Ecohydrological controls on snowmelt partitioning in mixed conifer sub alpine forests. Ecohydrology, 2(2): 129–142
https://doi.org/10.1002/eco.48
|
| 29 |
Molotch N P, Bales R C (2005). Scaling snow observations from the point to the grid-element: implications for observation network design. Water Resour Res, 41: W11421
https://doi.org/https://doi.org/10.1029/2005WR004229
|
| 30 |
Moriasi D N, Arnold J G, Van Liew M W, Bingner R L, Harmel R D, Veith T L (2007). Model evaluation guidelines for systematic quantification of accuracy in watershed simulations. Trans ASABE, 50(3): 885–900
https://doi.org/10.13031/2013.23153
|
| 31 |
Mould B (1985). New Day Rising. Chapter 1 in New Day Rising, Solid State Tuners, Taylor, Texas
|
| 32 |
Nash J E, Sutcliffe J V (1970). River flow forecasting through conceptual models part I- A discussion of principles. J Hydrol (Amst), 10(3): 282–290
https://doi.org/10.1016/0022-1694(70)90255-6
|
| 33 |
Neumann N, Derksen C, Smith C, Goodison B (2006). Characterizing local scale snow cover using point measurements during the winter season. Atmos-ocean, 44(3): 257–269
https://doi.org/10.3137/ao.440304
|
| 34 |
Rice R, Bales R (2010). Embedded sensor network design for snow cover measurements around snow pillow and snow course sites in the Sierra Nevada of California. Water Resour Res, 46(3): W03537
https://doi.org/10.1029/2008WR007318
|
| 35 |
Sexstone G A, Fassnacht S R (2014). What drives basin scale spatial variability of snowpack properties in the Front Range of northern Colorado? Cryosphere, 8(2): 329–344
https://doi.org/10.5194/tc-8-329-2014
|
| 36 |
Sturm M, Wagner A (2010). Using repeated patterns in snow distribution modeling: an Arctic example. Water Resour Res, 46(12): W12549
https://doi.org/10.1029/2010WR009434
|
| 37 |
Trujillo E, Ramírez J A, Elder K J (2007). Topographic, meteorologic, and canopy controls on the scaling characteristics of the spatial distribution of snow depth fields. Water Resour Res, 43(7): W07409
https://doi.org/10.1029/2006WR005317
|
| 46 |
U.S. Department of Agriculture (2011). Snow Survey and Water Supply Forecasting Program. National Engineering Handbook Part 622, Water and Climate Center, Natural Resources Conservation Service
|
| 38 |
U.S. Department of Agriculture (2016). Snow Survey and Water Supply Forecasting Program. National Water and Climate Center, Natural Resources Conservation Service
|
| 39 |
U.S. Geological Survey (2018). The National Map. U.S. Department of Interior
|
| 40 |
Veatch W, Brooks P, Gustafson J, Molotch N (2009). Quantifying the effects of forest canopy cover on net snow accumulation at a continental, mid latitude site. Ecohydrology, 2(2): 115–128
https://doi.org/10.1002/eco.45
|
| 41 |
Wallace C, Gass L (2008). Elevation derivatives for Mojave Desert tortoise habitat models. US Geological Survey Open File Report 2008-1283, 7pp
|
| 42 |
Webb R (2017). Using ground penetrating radar to assess the variability of snow water equivalent and melt in a mixed canopy forest, Northern Colorado. Front Earth Sci, 11(3): 482–495
https://doi.org/10.1007/s11707-017-0645-0
|
| 43 |
Winstral A, Elder K, Davis R (2002). Spatial snow modeling of wind redistributed snow using terrain based parameters. J Hydrometeorol, 3(5): 524–538
https://doi.org/10.1175/1525-7541(2002)003<0524:SSMOWR>2.0.CO;2
|
| 44 |
Winstral A, Marks D (2002). Simulating wind fields and snow redistribution using terrain based parameters to model snow accumulation and melt over a semi arid mountain catchment. Hydrol Processes, 16(18): 3585–3603
https://doi.org/10.1002/hyp.1238
|
|
Viewed |
|
|
|
Full text
|
|
|
|
|
Abstract
|
|
|
|
|
Cited |
|
|
|
|
| |
Shared |
|
|
|
|
| |
Discussed |
|
|
|
|