|
|
|
Analysis of spatio-temporal variability of aerosol optical depth with empirical orthogonal functions in the Changjiang River Delta, China |
Tianyong ZHAI1,2,Qing ZHAO1,2,*( ),Wei GAO1,2,3,Runhe SHI1,2,Weining XIANG4,Hung-lung Allen HUANG5,Chao ZHANG1,2 ),Wei GAO1,2,3,Runhe SHI1,2,Weining XIANG4,Hung-lung Allen HUANG5,Chao ZHANG1,2 |
1. Key Laboratory of Geographic Information Science (Ministry of Education), East China Normal University, Shanghai 200062, China
2. Joint Laboratory for Environmental Remote Sensing and Data Assimilation, ECNU&CEODE, Shanghai 200062, China
3. Colorado State University, Natural Resource Ecology Laboratory, Fort Collins, Colorado 80521, USA
4. Shanghai Key Laboratory for Urban Ecology and Sustainability, East China Normal University, Shanghai 200062, China
5. University of Wisconsin–Madison, Cooperative Institute for Meteorological Satellite Studies (CIMSS), Madison, Wisconsin 53706, USA |
|
|
|
|
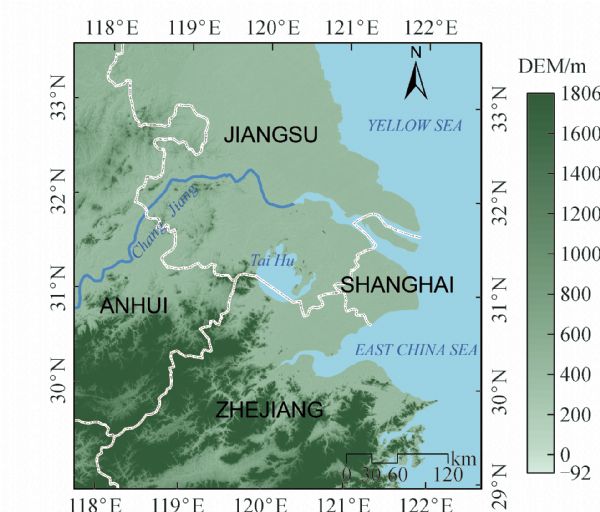
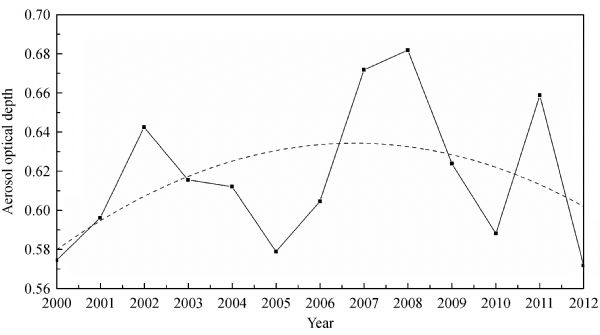
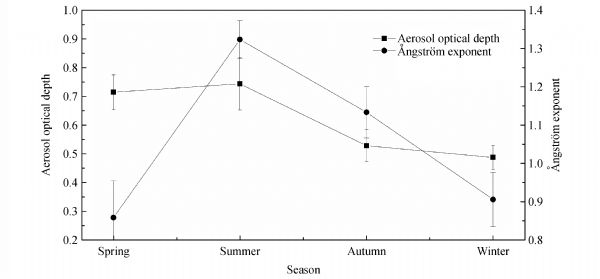
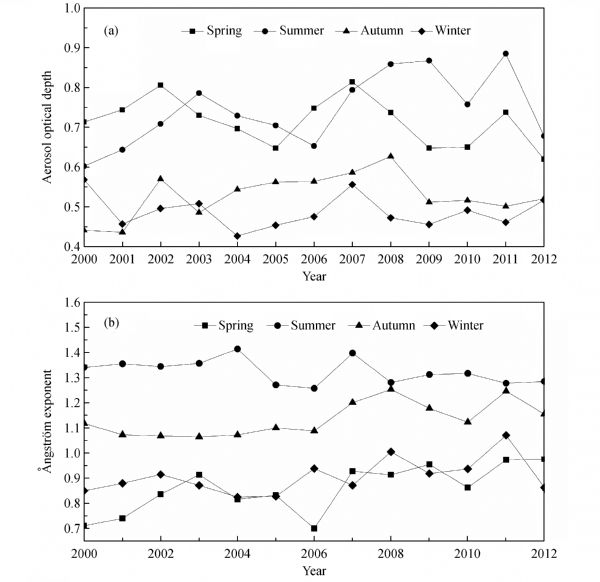
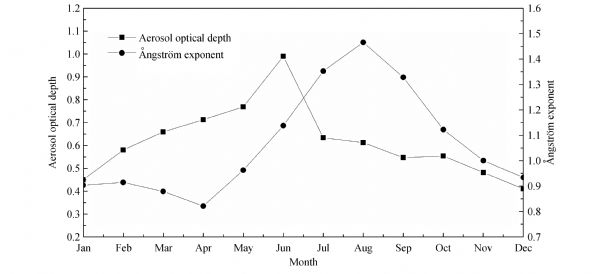
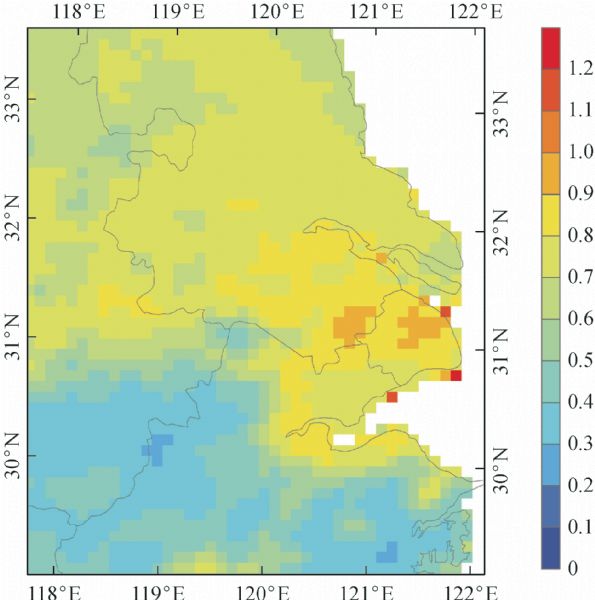
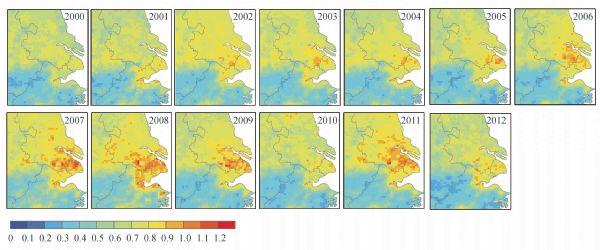
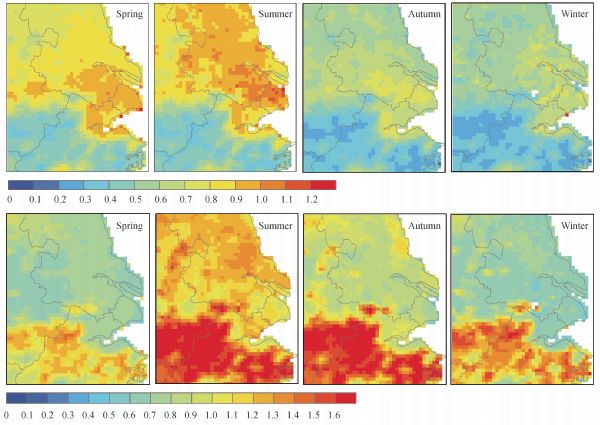
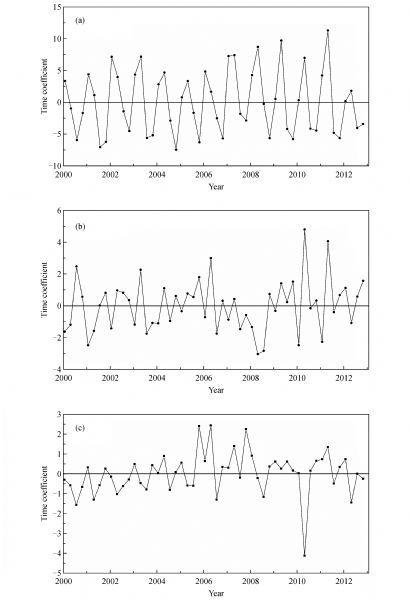
Abstract This work aims to analyze the spatial and temporal variability of aerosol optical depth (AOD) from 2000 to 2012 in the Changjiang River Delta (CRD), China. US Terra satellite moderate resolution imaging spectroradiometer (MODIS) AOD and ?ngstr?m exponent (α) data constitute a baseline, with the empirical orthogonal functions (EOFs) method used as a major data analysis method. The results show that the maximum value of AOD observed in June is 1.00±0.12, and the lowest value detected in December is 0.40±0.05. AOD in spring and summer is higher than in autumn and winter. On the other hand, the α-value is lowest in spring (0.86±0.10), which are affected by coarse particles. High α-value appears in summer (1.32±0.05), which indicate that aerosols are dominated by fine particles. The spatial distribution of AOD has a close relationship with terrain and population density. Generally, high AODs are distributed in the low-lying plains, and low AODs in the mountainous areas. The spatial and temporal patterns of seasonal AODs show that the first three EOF modes cumulatively account for 77% of the total variance. The first mode that explains 67% of the total variance shows the primary spatial distribution of aerosols, i.e., high AODs are distributed in the northern areas and low AODs in the southern areas. The second mode (7%) shows that the monsoon climate probably plays an important role in modifying the distribution of aerosols, especially in summer and winter. In the third mode (3%), this distribution of aerosols usually occurs in spring and winter when the prevailing northwestern or western winds could bring aerosol particles from the inland areas into the central regions of the CRD.
|
| Keywords
AOD
MODIS
EOFs
?ngstr?m exponent
Changjiang River Delta
|
|
Corresponding Author(s):
Qing ZHAO
|
|
Online First Date: 15 July 2014
Issue Date: 04 February 2015
|
|
| 1 |
?ngstr?m A (1929). On the atmospheric transmission of sun radiation and on dust in the air. Geogr Anal, 12: 130–159
|
| 2 |
Chu D A, Kaufman Y J, Ichoku C, Remer L A, Tanr D, Holben B N (2002). Validation of MODIS aerosol optical depth retrieval over land. Geophys Res Lett, 29(12): 8007
https://doi.org/10.1029/2001GL013205
|
| 3 |
Deng X, Deng W, He D (2010). Spatial-temporal features of atmospheric aerosol in East China in recent years. Transactions of Atmospheric Sciences, 33(3): 347–354 (in Chinese)
|
| 4 |
Duan H, Zhao J, Li Y (2013). The frequencies, severities, and driving factors of the sand-dust weather processes occurred in Northern China in the spring of 2011. J Desert Res, 33(1): 179–186 (in Chinese)
|
| 5 |
Duan X, Yu X, Liu X (2009). Analysis on the character of regional development of 30 years in the Yangtze River Delta. Econ Geogr, 29(2): 185–192 (in Chinese)
|
| 6 |
Eck T F, Holben B N, Reid J S, Dubovik O, Smirnov A, O’Neill N T, Slutsker I, Kinne S (1999). Wavelength dependence of the optical depth of biomass burning, urban, and desert dust aerosols. J Geophys Res, 104(D24): 31333–31349
https://doi.org/10.1029/1999JD900923
|
| 7 |
Engel-Cox J A, Holloman C H, Coutant B W, Hoff R M (2004). Qualitative and quantitative evaluation of MODIS satellite sensor data for regional and urban scale air quality. Atmos Environ, 38(16): 2495–2509
https://doi.org/10.1016/j.atmosenv.2004.01.039
|
| 8 |
He Q, Li C, Geng F, Lei Y, Li Y (2012). Study on long-term aerosol distribution over the land of East China using MODIS data. Aerosol and Air Quality Research, 12(3): 304–319
https://doi.org/10.4209/aaqr.2011.11.0200
|
| 9 |
He Q, Li C, Tang X, Li H, Geng F, Wu Y (2010). Validation of MODIS derived aerosol optical depth over the Yangtze River Delta in China. Remote Sens Environ, 114(8): 1649–1661
https://doi.org/10.1016/j.rse.2010.02.015
|
| 10 |
Holben B N, Eck T F, Slutsker I, Tanré D, Buis J P, Setzer A, Ver-mote E, Reagan J A, Kaufman Y J, Nakajima T, Lavenu F, Jankowiak I, Smirnov A (1998). AERONET—A federated instrument network and data archive for aerosol characterization. Remote Sens Environ, 66(1): 1–16
https://doi.org/10.1016/S0034-4257(98)00031-5
|
| 11 |
Holben B N, Tanré D, Smirnov A, Eck T F, Slutsker I, Abuhassan N, Newcomb W W, Schafer J S, Chatenet B, Lavenu F, Kaufman Y J, Castle J V, Setzer A, Markham B, Clark D, Frouin R, Halthore R, Karneli A, O’Neill N T, Pietras C, Pinker R T, Voss K, Zibordi G (2001). An emerging ground-based aerosol climatology: aerosol optical depth from AERONET. J Geophys Res, 106(D11): 12067–12097
https://doi.org/10.1029/2001JD900014
|
| 12 |
Hu T, Sun Z, Zhang H (2008). Spatial/Temporal variations and trends of aerosol optical depth at 380 nm wavelength in China during 1980–2001. Journal of Applied Meteorological Science, 19(5): 513–521 (in Chinese)
|
| 13 |
Ichoku C, Chu D A, Mattoo S, Kaufman Y J, Remer L A, Tanré D, Slutsker I, Holben B N (2002). A spatio-temporal approach for global validation and analysis of MODIS aerosol products. Geophys Res Lett, 29(12): 8006
https://doi.org/10.1029/2001GL013206
|
| 14 |
Kaskaoutis D G, Kambezidis H D, Adamopoulos A D, Kassomenos P A (2006). On the Characterization of aerosols using the ?ngstr?m exponent in the Athens area. J Atmos Sol Terr Phys, 68(18): 2147–2163
https://doi.org/10.1016/j.jastp.2006.07.008
|
| 15 |
Kaufman Y J, Tanré D, Boucher O (2002). A satellite view of aerosols in the climate system. Nature, 419(6903): 215–223
https://doi.org/10.1038/nature01091
pmid: 12226676
|
| 16 |
Kaufman Y J, Tanré D, Remer L A, Vermote E F, Chu A, Holben B N (1997). Operational remote sensing of tropospheric aerosol over land from EOS moderate resolution imaging spectroradiometer. J Geophys Res, D, Atmospheres, 102(D14): 17051–17067
https://doi.org/10.1029/96JD03988
|
| 17 |
Kennedy I M (2007). The health effects of combustion-generated aerosols. Proc Combust Inst, 31(2): 2757–2770
https://doi.org/10.1016/j.proci.2006.08.116
|
| 18 |
Kim H S, Chung Y S, Lee S G (2013). Analysis of spatial and seasonal distributions of MODIS aerosol optical properties and ground-based measurements of mass concentrations in the Yellow Sea region in 2009. Environ Monit Assess, 185(1): 369–382
https://doi.org/10.1007/s10661-012-2559-3
pmid: 22362557
|
| 19 |
Kim S W, Yoon S C, Kim J, Kim S Y (2007). Seasonal and monthly variations of columnar aerosol optical properties over East Asia determined from multi-year MODIS, LIDAR, and AERONET Sun/sky radiometer measurements. Atmos Environ, 41(8): 1634–1651
https://doi.org/10.1016/j.atmosenv.2006.10.044
|
| 20 |
King M D, Kaufman Y J, Menzel W P, Tanré D (1992). Remote sensing of cloud, aerosol, and water vapor properties from the moderate resolution imaging spectrometer (MODIS). IEEE Trans Geosci Rem Sens, 30(1): 2–27
https://doi.org/10.1109/36.124212
|
| 21 |
King M D, Kaufman Y J, Tanré D, Nakajima T (1999). Remote sensing of tropospheric aerosols from space: past, present, and future. Bull Am Meteorol Soc, 80(11): 2229–2259
https://doi.org/10.1175/1520-0477(1999)080<2229:RSOTAF>2.0.CO;2
|
| 22 |
King M D, Menzel W P, Kaufman Y J, Tanré D, Gao B, Platnick S, Ackerman S A, Remer L A, Pincus R, Hubanks P A (2003). Cloud and aerosol properties, precipitable water, and profiles of temperature and water vapor from MODIS. IEEE Trans Geosci Rem Sens, 41(2): 442–458
https://doi.org/10.1109/TGRS.2002.808226
|
| 23 |
Levy R C, Remer L A, Tanré D, Mattoo S, Kaufman Y J (2009). Algorithm for Remote Sensing of Tropospheric Aerosol over Dark Targets from MODIS: Collections 005 and 051: Revision 2; Feb 2009
|
| 24 |
Li C, Lau A K H, Mao J, Chu D A (2005). Retrieval, validation, and application of the 1km aerosol optical depth from MODIS measurements over Hong Kong. IEEE Trans Geosci Rem Sens, 43(11): 2650–2658
https://doi.org/10.1109/TGRS.2005.856627
|
| 25 |
Li C, Mao J, Lau K H A, Chen J, Yuan Z, Liu X, Zhu A, Liu G (2003). Characteristics of distribution and seasonal variation of aerosol optical depth in eastern China with MODIS products. Chin Sci Bull, 48(22): 2488–2495
|
| 26 |
North G R, Bell T L, Cahalan R F, Moeng F J (1982). Sampling errors in the estimation of empirical orthogonal functions. Mon Weather Rev, 110(7): 699–706
https://doi.org/10.1175/1520-0493(1982)110<0699:SEITEO>2.0.CO;2
|
| 27 |
Pan L, Che H, Geng F, Xia X, Wang Y, Zhu C, Chen M, Gao W, Guo J (2010). Aerosol optical properties based on ground measurements over the Chinese Yangtze Delta Region. Atmos Environ, 44(21–22): 2587–2596
https://doi.org/10.1016/j.atmosenv.2010.04.013
|
| 28 |
Pope C A 3rd, Dockery D W (2006). Health effects of fine particulate air pollution: lines that connect. J Air Waste Manag Assoc, 56(6): 709–742
https://doi.org/10.1080/10473289.2006.10464485
pmid: 16805397
|
| 29 |
Preisendorfer R W, Mobley C D (1988). Principal component analysis in meteorology and oceanography. Amsterdam: Elsevier
|
| 30 |
Qiu J, Yang L (2000). Variation characteristics of atmospheric aerosol optical depths and visibility in North China during 1980–1994. Atmos Environ, 34(4): 603–609
https://doi.org/10.1016/S1352-2310(99)00173-9
|
| 31 |
Remer L A, Kaufman Y J, Tanré D, Mattoo S, Chu D A, Martins J V, Li R R, Ichoku C, Levy R C, Kleidman R G, Eck T F, Vermote E, Holben B N (2005). The MODIS aerosol algorithm, products, and validation. J Atmos Sci, 62(4): 947–973
https://doi.org/10.1175/JAS3385.1
|
| 32 |
Shrestha P, Barros A P (2010). Joint spatial variability of aerosol, clouds and rainfall in the Himalayas from satellite data. Atmos Chem Phys, 10(17): 8305–8317
https://doi.org/10.5194/acp-10-8305-2010
|
| 33 |
Su J, Zhu B, Kang H, Wang H, Wang T (2012). Applications of pollutions released from crop residues at open burning in Yangtze River Delta Region in air quality model. Environ Sci, 33(5): 1418–1424 (in Chinese)
|
| 34 |
Yang K L (2002). Spatial and seasonal variation of PM10 mass concentrations in Taiwan. Atmos Environ, 36(21): 3403–3411
https://doi.org/10.1016/S1352-2310(02)00312-6
|
| 35 |
Zhao Q, Gao W, Xiang W, Shi R, Liu C, Zhai T, Huang H A, Gumley L E, Strabala K (2013). Analysis of air quality variability in Shanghai using AOD and API data in the recent decade. Front Earth Sci, 7(2): 159–168
https://doi.org/10.1007/s11707-013-0357-z
|
|
Viewed |
|
|
|
Full text
|
|
|
|
|
Abstract
|
|
|
|
|
Cited |
|
|
|
|
| |
Shared |
|
|
|
|
| |
Discussed |
|
|
|
|