|
|
|
Environmental cost and pollution risk caused by the industrial transfer in Qinghai Province |
Qun’ou JIANG1,Chengcai TANG2,Jinyan ZHAN3,*( ),Wei ZHANG1,Feng WU3 ),Wei ZHANG1,Feng WU3 |
1. School of Soil and Water Conservation, Beijing Forestry University, Beijing 100038, China
2. School of Tourism Management, Beijing International Studies University, Beijing 100024, China
3. State Key Laboratory of Water Environment Simulation, School of Environment, Beijing Normal University, Beijing 100875, China |
|
|
|
|
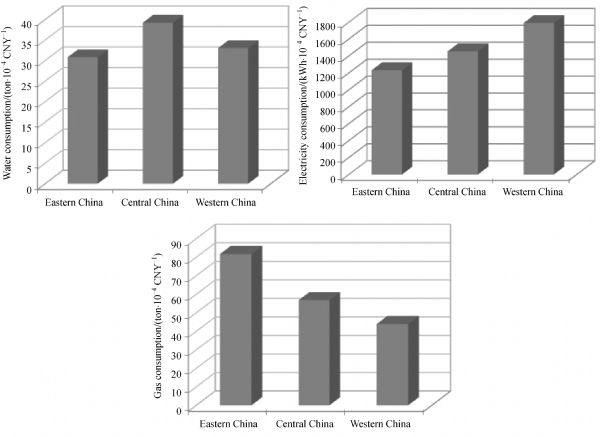
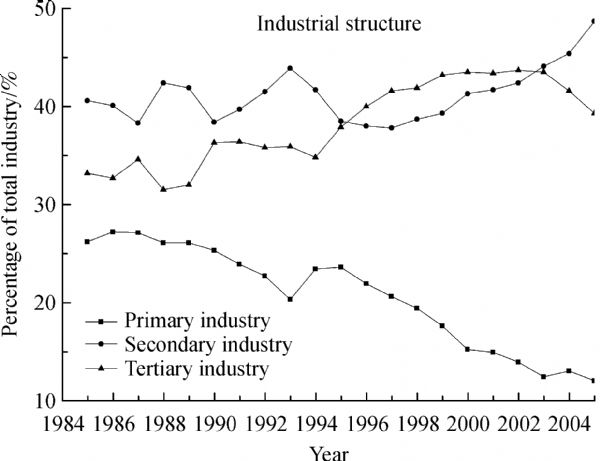
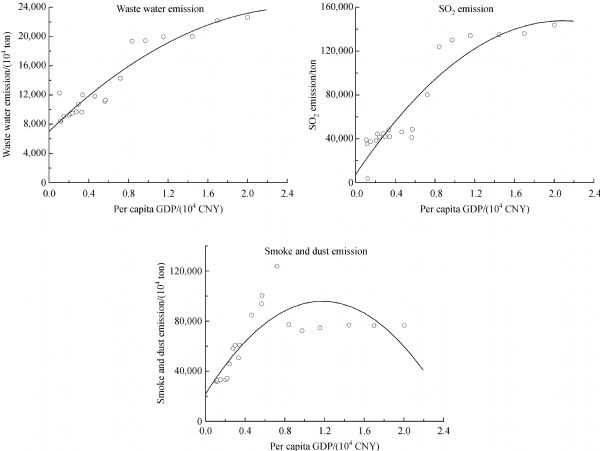
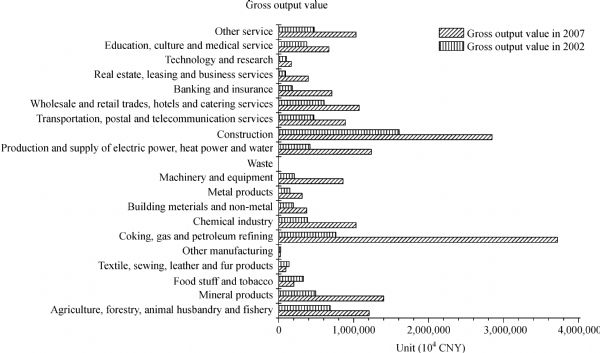
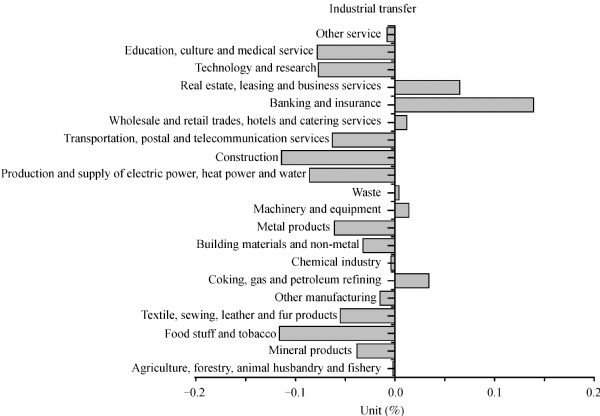
Abstract With the rising pressure due to energy consumption and costs of environmental protection and recovery, industrial transfer from the eastern to central and western areas has surged in China. However, extremely fragile ecological conditions and severe water shortage are significant hurdles for industry development in Western China. Whether the vulnerable environment can bear the pollution caused by the transferred industry from Eastern China becomes a significant issue. This study firstly estimates energy and environmental costs in different areas of China, and assesses the necessity to upgrade the industrial structure of Qinghai Province. Then the emissions of waste water, waste gas, and smoke caused by transferred industries are calculated by Input-Output Model. On the basis of the effect analysis of waste emission on environment, pollution risks of Qinghai province are assessed. The results illustrate that the costs of environmental protection and recovery in China have a gradient distribution, of which the energy efficiency is lower while environmental costs are higher in Western China. Industrial structure adjustment has different impacts on the pollution of different sectors. Although the development of machinery and equipment, hotels and catering services, and real estate, leasing, and business services has increased the emission of pollutants, it is offset by the decreasing emissions caused by other industries such as construction and metal products. Therefore, although economic development will increase environmental pollution, industrial adjustments can effectively decrease waste water and waste gas emissions to reduce the pollution risk. It should be noted that there are still tremendous challenges for industrial transfer in Qinghai Province to coordinate the environment and industry development.
|
| Keywords
environmental cost
industrial transfer
energy
pollution risk
Qinghai
|
|
Corresponding Author(s):
Jinyan ZHAN
|
|
Issue Date: 04 July 2014
|
|
| 1 |
Bureau of Statistics of Qinghai Province (1991-2011). <?Pub Caret?>Qinghai statistical yearbook. Beijing: China Statistics Press
|
| 2 |
Cao G M, Long R J (2009). The bottleneck and its resolutions to the natural recovery of black soil type degraded grassland in the Three River Source Region. Acta Agrestia Sinica, 17(1): 4-9
|
| 3 |
Chen B, Chen G Q (2009). Emergy-based energy and material metabolism of the Yellow River Basin. Commun Nonlinear Sci Numer Simul, 14(3): 923-934
doi: 10.1016/j.cnsns.2007.05.034
|
| 4 |
Christiansen O, Ehnts D H, Trautwein H (2010). Industry relocation, linkages and spillovers across the Baltic Sea: extending the footloose capital model. Baltic Journal of Economics. Baltic International Centre for Economic Policy Studies, 10(1): 61-78
|
| 5 |
Cole M A (2004). Trade, the pollution haven hypothesis and the environmental Kuznets curve: examining the linkages. Ecol Econ, 48(1): 71-81
doi: 10.1016/j.ecolecon.2003.09.007
|
| 6 |
Dietzenbacher E, Velázquez E (2007). Analysing and alusian virtual water trade in an input-output framework. Reg Stud, 41(2): 185-196
doi: 10.1080/00343400600929077
|
| 7 |
Fan J (2004). Western development policy: changes, effects and evaluation. In: Yeung Y M, Shen J F eds. Developing China’s West: A Critical Path to Balanced National Development. Hong Kong: The Chinese University Press
|
| 8 |
Hoover E M (1937). Location theory and the shoes and leather industry. Cambridge: Harvard University Press
|
| 9 |
Jin Z D, You C F, Yu T L, Wang B S (2010). Sources and flux of trace elements in river water collected from the lake Qinghai catchment, NE Tibetan Plateau. Appl Geochem, 25(10): 1536-1546
doi: 10.1016/j.apgeochem.2010.08.004
|
| 10 |
Kander A, Lindmark M (2006). Foreign trade and declining pollution in Sweden: a decomposition analysis of long-term structural and technological effects. Energy Policy, 34(13): 1590-1599
doi: 10.1016/j.enpol.2004.12.007
|
| 11 |
Kawata Y (2011). Economic growth and trend changes in wildlife hunting. Acta Agric Slov, 97(2): 115-123
doi: 10.2478/v10014-011-0007-7
|
| 12 |
Kirkegaard J F (2007). Offshoring, outsourcing, and production relocation: labor-market effects in the OECD countries and developing Asia. IIE Working Paper
|
| 13 |
Krueger G G (1991). Environmental impacts of a North American free trade agreement. National Bureau Economic Research Working Paper 3914, NBER, Cambridge M A
|
| 14 |
Lai H H (2002). China’s western development program: its rationale, implementation, and prospects. Mod China, 28(4): 432-466
doi: 10.1177/009770040202800402
|
| 15 |
Liu G, Lucas M, Shen L (2008). Rural household energy consumption and its impacts one co-environment in Tibet: taking Taktse county as an example. Renew Sustain Energy Rev, 12(7): 1890-1908
doi: 10.1016/j.rser.2007.03.008
|
| 16 |
Liu H G, Liu W D, Liu Z G (2011). The quantitative study on inter-regional industry transfer. China Industrial Economics, (6): 79-88
|
| 17 |
Liu W, Yeung H W (2008). China’s dynamic industrial sector: the automobile industry. Eurasian Geography and Economics, 49(5): 523-548
doi: 10.2747/1539-7216.49.5.523
|
| 18 |
National Bureau of Statistics (2009). Input-Output Tables of China. Beijing: China Statistics Press
|
| 19 |
Okadera T, Watanabe M, Xu K Q (2006). Analysis of water demand and water pollutant discharge using a regional input-output table: an application to the city of Chongqing, upstream of the three gorges dam in China. Ecol Econ, 58(2): 2321-2371
|
| 20 |
Ouyang Z Y, Zheng H, Huang B R (2009). Regional Ecosystem Assessment and Ecosystem Service Zoning. Beijing: China Environmental Science Press
|
| 21 |
Panayotou T (1993). Empirical tests and policy analysis of environmental degradation at different stages of economic development. Technology, Environment and Employment, Geneva: International Labour Office
|
| 22 |
Ping X G, Jiang Z G, Li C W (2011). Status and future perspectives of energy consumption and its ecological impacts in the Qinghai-Tibet region. Renew Sustain Energy Rev, 15(1): 514-523
doi: 10.1016/j.rser.2010.07.037
|
| 23 |
Rodriguez-Clare A (1996). Multinationals, linkages and economic development. Am Econ Rev, 88(5): 1290-1310
|
| 24 |
Shafik N, Bandyopadhyay S (1992). Economic growth and environmental quality: time series and cross-country evidence back ground. Paper for World Development Report. World Bank
|
| 25 |
Yang J, Chen B (2011). Using LMDI method to analyze the change of industrial CO2 emission from energy use in Chongqing. Frontiers of Earth Science, 5(1): 103-109
|
| 26 |
Zhao X Y (2007). Analysis of the industrial structure transformation and its eco-environment effect in Gansu. Areal Research and Development, 26(2): 102-106
|
|
Viewed |
|
|
|
Full text
|
|
|
|
|
Abstract
|
|
|
|
|
Cited |
|
|
|
|
| |
Shared |
|
|
|
|
| |
Discussed |
|
|
|
|